Volume 2013, Article ID 949816,19pages http://dx.doi.org/10.1155/2013/949816
Research Article
Enhanced Synaptic Connectivity in the Dentate Gyrus during
Epileptiform Activity: Network Simulation
Keite Lira de Almeida França,
1Antônio-Carlos Guimarães de Almeida,
1Antonio Fernando Catelli Infantosi,
2Mario Antônio Duarte,
1Gilcélio Amaral da Silveira,
1Fulvio Alexandre Scorza,
3Ricardo Mario Arida,
4Esper Abrão Cavalheiro,
3and Antônio Márcio Rodrigues
11Laborat´orio de Neurociˆencia Experimental e Computacional, Departamento de Engenharia de Biossistemas,
Universidade Federal de S˜ao Jo˜ao del-Rei (UFSJ), Brazil
2Programa de Engenharia Biom´edica, Universidade Federal do Rio de Janeiro (UFRJ/COPPE), Brazil
3Disciplina de Neurologia Experimental, Escola Paulista de Medicina (EPM), Universidade Federal de S˜ao Paulo (UNIFESP), Brazil 4Disciplina de Neuroisiologia e Fisiologia do Exerc´ıcio, Escola Paulista de Medicina (EPM), Universidade Federal de S˜ao Paulo
(UNIFESP), Brazil
Correspondence should be addressed to Antˆonio M´arcio Rodrigues; [email protected]
Received 7 August 2012; Revised 6 December 2012; Accepted 20 December 2012
Academic Editor: Steven Bressler
Copyright © 2013 Keite Lira de Almeida Franc¸a et al. his is an open access article distributed under the Creative Commons Attribution License, which permits unrestricted use, distribution, and reproduction in any medium, provided the original work is properly cited.
Structural rearrangement of the dentate gyrus has been described as the underlying cause of many types of epilepsies, particularly temporal lobe epilepsy. It is said to occur when aberrant connections are established in the damaged hippocampus, as described in human epilepsy and experimental models. Computer modelling of the dentate gyrus circuitry and the corresponding structural changes has been used to understand how abnormal mossy ibre sprouting can subserve seizure generation observed in experi-mental models when epileptogenesis is induced by status epilepticus. he model follows the McCulloch-Pitts formalism including the representation of the nonsynaptic mechanisms. he neuronal network comprised granule cells, mossy cells, and interneurons. he compensation theory and the Hebbian and anti-Hebbian rules were used to describe the structural rearrangement including the efects of the nonsynaptic mechanisms on the neuronal activity. he simulations were based on neuroanatomic data and on the connectivity pattern between the cells represented. he results suggest that there is a joint action of the compensation theory and Hebbian rules during the inlammatory process that accompanies the status epilepticus. he structural rearrangement simulated for the dentate gyrus circuitry promotes speculation about the formation of the abnormal mossy iber sprouting and its role in epileptic seizures.
1. Introduction
Epileptic syndromes are a group of neurological disorders with diferent etiology and clinics characterized by recur-rent seizures with excessive and hypersynchronous neuronal activity [1]. Nowadays, approximately 50 million people are afected with epilepsy and 40% of which are classiied as temporal lobe epilepsy (TLE) [2].
he human TLE is frequently associated with neuronal loss in the hippocampus and dentate gyrus (DG) [3].
the neuronal activity and, therefore, the seizure propagation through the hippocampus and other limbic system structures [5].
Mossy iber sprouting (MFS) has been observed in several animal models of TLE. he recurrent synaptic transmission between granule cells is one of the supposed inductors of a recurrent excitation between these cells and therefore is responsible for the generation of spontaneous seizures with probable origin in the hippocampus [8,9]. Some investigators believe that the MFS makes the hippocampal circuitry sus-ceptible to prolonged bursts of action potentials, contributing to the seizure onset [9,10]. hus, the abnormal MFS could play an important role in sustaining seizures in TLE with mesial sclerosis, contributing to the provision of the epilepto-genic substrate of the hippocampus. According to Lytton et al. [11], the abnormal organization of the brain circuits can be considered crucial for several types of epilepsy.
On the other hand, the occurrence or lack of occurrence of spontaneous recurrent seizures in an animal model is not directly related to the presence of mossy iber sprouting. herefore, the complexity involved in the investigation of the main mechanisms responsible for seizure eruption makes the computational simulation of DG an indispensable approach in providing new insights. Of course any model is an oversim-pliication of the reality. In the particular case of a mathemat-ical model, the reductionism must be a rule to make the com-putational implementation reliable. However, it is a powerful tool to help evaluate if the minimum conditions represented are enough to reproduce the phenomenon investigated.
In 1943, McCulloch and Pitts created the irst formalized model of an artiicial neural network. Since then, computer modeling has enabled important advances in the understand-ing of complex phenomena such as epilepsy [12–14].
he aim of this study was to investigate the possible role of abnormal MFS on the DG excitability, involved in exper-imental models of status epilepticus. he computational model was based on the McCulloch-Pitts formalism and neuroanatomical data as well as on patterns of connectivity of the main cell types present in the hippocampus [12,15–
19]. he model also represents sustained depolarizations that are typical of nonsynaptic mechanisms during the ictal periods and changes in GABAa transmission reported during inlammatory response observed ater pilocarpine-induced seizures. he simulations create the possibility for discussion concerning the complex role of the synaptic reorganization associated with experimental models ofstatus epilepticus.
2. Methods
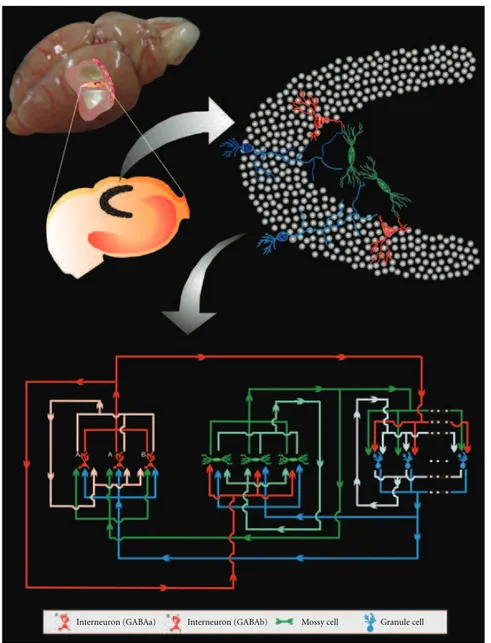
2.1. Neuronal Network Model. he neural network imple-mented for the simulation study is based on the McCulloch-Pitts formalism [15,20], including the Compensation Algo-rithm for synaptogenesis, proposed by Dammasch et al. [19, 21], and Hebbian and anti-Hebbian rules. he cell population represents the main types described in the dentate gyrus (DG) as well as its connectivity (Figure 1). Since the cytoarchitecture of DG is favourable to the non-synaptic connections, they were also represented in the model.
he neuronal network, with�neurons, is composed of NE excitatory and�−NE inhibitory neurons. he excitatory neurons were divided into {1, . . . ,NE − 3} granule cells
and{NE+ 2, . . . ,NE}hilar mossy cells. he connectivity is
represented by a connection matrixC(�×�), where��,�, 1 ≤
�, � ≤ � is the synaptic weight of the connection of the
neuron�on the neuron�.
he collection of states of each neuron of the network is represented by a vector�� = (��1, . . . , ���), where��� ∈ {0, 1},
1 ≤ � ≤ �, � = 0, 1, 2, . . . .Each neuron� may have two
possible states in the instant of time�: active (��� = 1) or inactive (��� = 0). he probability of neuron�turning active in time�could be estimated by the threshold function [20]:
prob(���) = 1
1 + �(MP�−1
� +�−�)/−�, (1)
where�represents the stimulation input, MP�is the mem-brane potential of the neuron�, � is the threshold, and� represents the noise of the threshold function.
he membrane potential in the instant of time�of the neuron�, MP��, is calculated by
MP�� = �
NE−3
∑
�=1 ��,�� �−1 �
+ ��
NE
∑
�=NE−2
��,���−1� − �
�
∑
�=NE+1
��,���−1� +NS��,
(2)
where NS�� is the efect of the non-synaptic mechanisms on the transmembrane potential. he connection weights are� (connections from granule cells),��(� = 1se� ≤NE and� =
2se� >NE; connections from mossy cells), and�(inhibition
from interneurons).
According to Almeida et al. [14,22], the Na+inlux trough ionic channels and the Na+elux trough Na/K pump deine the transition points between the ictal and interictal periods during non-synaptic epileptiform activity. In the present model, the ictal period of the epileptiform activities was asso-ciated with the spontaneous increase of cell activities (SICA). Representating these two Na+currents in the generation of a SICA, NS��was calculated based on two components: NSE, representing the excitatory efect of the Na+inlux, and NSI, representing the inhibitory efect of the Na+elux. herefore,
NS�� = � ⋅NSE��− � ⋅NSI��, (3)
where “�” and “�” are parameters used to adjust the balance between excitation and inhibition, respectively.
In the proposed model, to simulate the ictal and interictal periods, two states of the neuronal activity were identiied:
sustained depolarizationstate andpolarizedstate. he former state comprises the ictal period and the last the interictal period. In order to represent the transition between both states, thesustained depolarizationstate was divided in two: thesustained depolarizationitself and the in repolarization
Interneuron (GABAa) Interneuron (GABAb) Mossy cell Granule cell
Figure 1: Diagrammatic representation of the basic circuitry of the dentate gyrus represented in the model.
happens when��� > �. During thesustained depolarization, the neuron is iring and the sustained depolarization is done due to Na+inlux trough ionic channels greater than its elux trough pump, which can be represented by NSE�� > NSI��. Consequently, when in the in repolarizationstate NSE�� < NSI�� is required, the essential condition for the interictal period (polarizedstate) is���< �. he mathematical descrip-tion of the three states is basically deined by the same functional composition. he changing rates of NSE and NSI follow the equations
�NSE��
�� = ℎ (�) − � ⋅NSE��,
�NSI��
�� = � (�) − � ⋅NSI��,
(4)
whereℎ(�)and�(�)are dependent on the state and�and� are time constants governing the recovering rate of NSE and NSI. To Summarize, consider the following
(i)Sustained depolarizationstate (��� > �and NSE�� > NSI��):
ℎ (�) = � ⋅ (���− 0.25) ,
� (�) = � ⋅NSE��
(5)
with�constant and�dependent on NSE��, according to
� = � ⋅ (��
�− 0.25) ⋅ (1 −tanh(NSE
� �− 18
0.5 )) , (6)
based on the increment of the neuronal discharge. On the other side, the increment of intracellular Na+ increases the Na/K pump action, promoting the inhibitory efect of the electrogenic current, which is represented in the present model by an efect proportional to NSE.
(ii)In repolarizationstate (NSE�� <NSI��):
ℎ (�) = −� ⋅ ��
NSE, if NSE�� > 0.1,
� (�) = −ℎ ⋅ ��NSI, if NSI��> 0.009,
(7)
where � and ℎ are constants and ��NSE and ��NSI are functions that contribute to cell repolarization:
���
NSE
�� = � ⋅ (1 − ��NSE) , if NSE��> 0.1,
��
NSE= 0, if NSE�� ≤ 0.1,
���NSI
�� = � ⋅ (1 − ��NSI) , if NSI�� > 0.009,
��
NSI= 0, if NSI�� ≤ 0.009,
(8)
where� and�are constants. he aim of the above equations was to represent the moment when the electrogenic current of the Na/K pump is able to interfere with the membrane potential promoting the repolarization. In these circumstances, the voltage-dependent sodium channels start to reduce conduc-tance and the repolarization takes place. Equation (9) is a phenomenological representation of this behavior. (iii)Polarizedstate (���> �) withℎ(�) = �(�) = 0.
2.2. Neuronal Network Connectivity
2.2.1. Compensation heory. Experimental observations indi-cate that neurons react to anatomical changes induced by long-term metabolic disequilibrium. hese reactions depend on whether the state is high or low [19, 20, 23]. herefore, each neuron follows the local rules aiming at compensatory changes to the input activity, caused by structural adaptations. Consequently, for a speciic neuron�, its deviation from the average activity expected, in the present work 0.2, is called the morphogenetic state of the neuron,���, which is estimated by means of the following relationship:
Δ��� = ���− 0.2, where��� =∑
�+Δ�
� prob(���)
Δ� , (9)
where the average activity is calculated from�to�+�and� is the morphogenetic time step, corresponding to the period of time needed to perform the connectivity changes of the network.���, used as a measure of the neuron�activity, is the average iring probability.
he morphogenetic state of neuron represents the neu-ronal capacity to form, stabilize, or degrade pre- or postsy-naptic elements or synapses [20,21]. he possible interactions between these three states follow the synaptogenesis compen-sation theory proposed by Wolf and Wagner [17]. According
to this theory, the aferent synapse spectrum inluences—via transmission—the functional state of the neuron, estimated as an average of activity along the determinate period of time Δ�. Depending on its level of activity, the functional state leads to a morphogenetic state that tries to compensate its deviations. his is performed by changing the neuronal elements, bound and free, pre- and postsynaptic, ater each morphogenetic time step. he degeneration of bound ele-ments and recombination of free synaptic eleele-ments lead to a new structural state. he new aferent spectrum leads the neuron to a new functional state.
To simulate the network morphogenesis, the synapses are distinguished in pre- (pr) and postsynapses (po), which are then divided into bound (b) and free (f). he postsy-naptic elements have additional divisions: excitatory (e) and inhibitory (i) [20]. his classiication leads to the following representation:
(i) bound (bpr) and free (fpr) presynaptic elements; (ii) bound (bepo) and free (fepo) excitatory postsynaptic
elements;
(iii) bound (bipo) and free (ipo) inhibitory postsynaptic elements.
he sum of the synaptic elements of the neuron �, according to this classiication, represented by��, is deined as follows [19,20]:
(i) sum of the bound excitatory postsynaptic elements:
�bepo
� = ∑NE�=1��,�,
(ii) sum of the bound inhibitory postsynaptic elements:
�bipo
� = ∑��=NE+1��,�,
(iii) sum of the free excitatory postsynaptic elements:
�fepo
� ,
(iv) sum of the free inhibitory postsynaptic elements:
�fipo
� ,
(v) sum of the bound presynaptic elements: �bpr� =
∑��=1��,�,
(vi) sum of free presynaptic elements:�fpr� .
he morphogenetic rules depend on the morphogenetic state of the neuron��, on the actual structural state of the neuron, and also on the cell sensitivity to structural variations [19,20]. hese rules are represented inTable 1.
he current structural state of the neuron is charac-terized by the number of aferent and eferent synapses. he synaptogenesis and the modiication of the synaptic contact can change the structural state of the network [19]. According to the formalization of the compensation theory of synaptogenesis [17], two kinetic parameters are deined:
��
⋅⋅⋅ and��⋅⋅⋅, where�and� refer to the level of excitability
Table 1: Morphogenetic rules according to Dammasch et al. [21].
Neurons in high state of activity,�, when���> 0.25 Neurons in low state of activity,�, when���< 0.15
Δ�bpr
� = 0 Δ�bpr� = −��bpr����Δ������� < 0
Δ�bepo
� = −��bepo����Δ������� < 0 Δ�
bepo
� = 0
Δ�bipo
� = 0 Δ�bipo� = −��bipo����Δ������� < 0
Δ�fpr
� = ��fpr����������� > 0 �
fpr
� = −��fpr�
fpr
� ����Δ������� ≤ 0
Δ�fepo
� = −��fepo�fepo� ����Δ������� ≤ 0 Δ�fepo� = ��fepo����Δ������� > 0
Δ�fipo
� = ��fipo����������� > 0 �
fipo
� = −�fipo� �
fipo
� ����Δ������� ≤ 0
amount of synaptic elements (Table 1). In the present model, the changes in the connectivity of the network followed the rules proposed by Dammasch et al. [19] and Dammasch et al. [21].
he network connectivity variation also happens with dependence on the reduction of the bound synaptic elements. he presynaptic elements’ decay is proportional to the strength of the actual connections [19]:
��,�= ��,�+ (��bpr ��,�
�bpr
�
) , ∀��,�∈C. (10)
he loss of postsynaptic elements is computed separately for inhibitory and excitatory synapses, according to the following equation [20]:
��,�= ��,�+ { { { { { { { { { { { �bepo
� ��bepo�,� �
, � = 1, . . . ,NE
Δ�bipo
� ��,�
�bipo
�
, � =NE+ 1, . . . , �
} } } } } } } } } } } , (11)
for all��,�∈C.
he presynaptic elements of altered synapses are redis-tributed postsynaptically while the postsynaptic elements are removed. herefore, the amount of presynaptic elements previously bound (equal to the amount of degraded postsy-naptic elements|��,�post|) is transferred to the amount of free presynaptic elements [20]:
�fpr
� = ��fpr+ Δ�fpr� + � ∑ �=1������ post �,� �����, �fepo
� = �fepo� + Δ�fepo� ,
�fipo
� = �fipo� + Δ�fipo� .
(12)
New synaptic contacts and the reinforcement of the current synaptic contacts take place from the recombination
of free elements. he recombination is given by Butz et al. [20]:
��,�= ��,� + { { { { { { { { { { { �fpr
� �fepo�
max(∑�
�=1��fepo, ∑NE�=1��fpr)
, � = 1, . . . ,NE
�fpr
� ��fipo
max(∑�
�=1�fipo� , ∑��=NE+1�fpr� )
, � =NE+ 1, . . . , �
} } } } } } } } } } } ≥ 0, (13)
for all��,�∈C, where� = 1, . . . , �.
he amount of free synaptic elements remained during the recombination is also renewed subsequently.
2.2.2. Hebbian and Anti-Hebbian Rules. he synaptic modii-cation during learning is made by a mechanism that depends on the simultaneous activity of the presynaptic button and the postsynaptic cell. According to the Hebbian learning rule [24], a synapse is potentiated when the activity in the synaptic button increases at the same time that the postsynaptic neuron is depolarized. he synaptogenesis, according to the Hebbian rules depend on the activities of connected cells and on the contribution of each cell to the iring of the other. herefore, the change of the connection weight between two neurons,�and�, is determined by
��
��= ��������, if ��� > 0.25, ���> 0.25,
��
��= 0, otherwise,
(14)
where�is constant and���is the number of times that the discharge of the presynaptic neuron�is followed by discharge of the postsynaptic neuron�during one morphogenetic time step. Assuming that the formation of new synapses is limited as well as the strengthening of the synaptic weight, in the present model a sigmoid function was used to calculate�
����= �
1 + �(����−0.4)/0.05, (15)
where�is a proportionality constant.
hus, the changes in the connectivity were performed accord-ing to
��
��= −�Δ��Δ�����, if��� > 0.25, ���> 0.25,
��
��= 0, otherwise,
(16)
where�is constant and���is the number of times that the discharge of the postsynaptic neuron �is not preceded by discharge of the pre-synaptic neuron�during one morpho-genetic time step.
2.3. Connection Matrix and Parameters of the Model. he concept of the connection matrix representing the DG was based on the current literature. According to Dyhrjeld-Johnsen et al. [16], the hippocampus comprises 1.000.000 granule cells, 30.000 mossy cells, 10.000 basket cells, 2.000 axo-axonic cells, 4.000 MOPP cells (molecular layer per-forant path-associated cell), 12.000 HIPP cells (hilar perper-forant path-associated cell), 3.000 HICAP cells (hilar commissural-associational pathway related cells), and 3.000 IS cells (interneuron selective cells). he model network was per-formed in a reduced scale (1 : 10.000), that is, with 99 granule cells, 3 mossy cells, and 3 interneurons (basket, axoaxonic, MOPP, HIPP, HICAP, and IS). Combining these three types of cells, nine groups of connections were represented and the connections’ arrangement for the initial conditions of the simulations was set according to experimental investigations [12,16]:
(a) group I (granule cells → granule cells): no connec-tions;
(b) group II (granule cells → mossy cells): each mossy cell receives connection from 33 granule cells; (c) group III (granule cells→ interneurons): each
inter-neuron receives connection from 33 granule cells; (d) group IV (mossy cells → granule cells): each mossy
cell sends a connection to all granule cells;
(e) group V (mossy cells→mossy cells): each mossy cell sends a connection to all mossy cells;
(f) group VI (mossy cells → interneurons): each mossy cell sends a connection to all interneurons;
(g) group VII (interneurons → granule cells): each interneuron sends a connection to all granule cells; (h) group VIII (interneurons→ mossy cells): each
inter-neuron sends a connection to all mossy cells; (i) group IX (interneurons→ interneurons): each
inter-neuron sends a connection to all interinter-neurons.
he initial values of the elements of the connectivity matrix followed a normal distribution with mean and stan-dard deviation set to1.0 ± 0.2.
According to Dammasch et al. [19], Dammasch et al. [21], and Cromme and Dammasch [23], it is hypothetically assumed that degeneration of the free synaptic elements is faster than the degeneration of the bound synaptic elements. Dammasch et al. [21] found in simulations that while the
relation between decrease and increase of bound elements is critical for stability, the decrease of free elements is of less importance. herefore, the following rations of kinetic parameters were chosen:
��bpr= �fpr� ⋅ 0.033,
��bpr= �fpr� ⋅ 0.167.
(17)
To maintain the oscillation properties of the network during the morphogenesis, as proposed by Cromme and Dammasch [23], it was assumed that
��fepo= 9 ∗ ��fipo. (18)
Assuming no bias decrease of the synaptic elements, then
��
fepo= ��fipo= �fpr� ,
��bepo= ��bipo= ��bpr.
(19)
he relationships of the kinetic parameters described above allow the description of one parameter in terms of the other. Choosing��fipoas the adjusting parameter,
��
fipo= �, (20)
where�can be interpreted as a constant that deines the speed of the morphogenetic changes. During the process of network connectivity change, the kinetic parameters must guarantee smooth convergence in the change of synaptic elements [21] and thus�must be small. In this model, studying the efect of the compensation theory on the network activity, �was set in the interval 0 ≤ � ≤ 0.1. Taking into account the investigations by Dammasch and Wagner [18], Dammasch et al. [19], Dammasch et al. [21], Cromme and Dammasch [23], and Butz et al. [20], it was assumed that� = 8,� = 2, and
� = 1.0.
For the excitatory pre-synaptic cells the synaptic weights
were � = 0.19, � = �1 = 4.92, when� < NE− 3, and
� = �2= 2.37, when NE−3 < � ≤NE. hese parameters were
estimated by running simulations of the network activity without stimulation and allowing it to reach stable activity [19]. he network was considered stable when the average activity reaches values in the range 0.15–0.25.
he parameters related to the increase of the neuronal activity due to the nonsynaptic mechanisms were adjusted to induce depolarization and repolarization during SICA mimicking the efects of the Na+inlux through the channels and its elux through the pump, during a spontaneous nonsynaptic epileptiform activity, as described by Almeida et al. [14]. With this aim, the adjusted values were� = 0.8,
� = 0.2, � = 2.8 × 10⁻⁶min−1, � = 5.6 × 10⁻⁵min−1,
� = 2.8×10⁻³min−1,� = 1.1min−1,�= 2.8×10⁻²min−1,ℎ =
2.8 × 10⁻²min−1,� = 2.8 × 10⁻²min−1,� = 1.1 × 10⁻²min−1,
and� = 0.32.
Days Days Days 0
0.5 1 0 0.5 1 0 1
0.5
1.3 1.4 1.5 1.6 1.7 1.8 1.3 1.4 1.5 1.6 1.7 1.8 1.3 1.4 1.5 1.6 1.7 1.8
Interneuron Mossy cell
Granule cell ��
�� ��
� = 0.5 � = 1 � = 1.5
(a)
Days
Depolarization Inhibition 10
20 30
Days Days
1.3 1.4 1.5 1.6 1.7 1.8 1.3 1.4 1.5 1.6 1.7 1.8 1.3 1.4 1.5 1.6 1.7 1.8
NS
E a
n
d NS
I
(b)
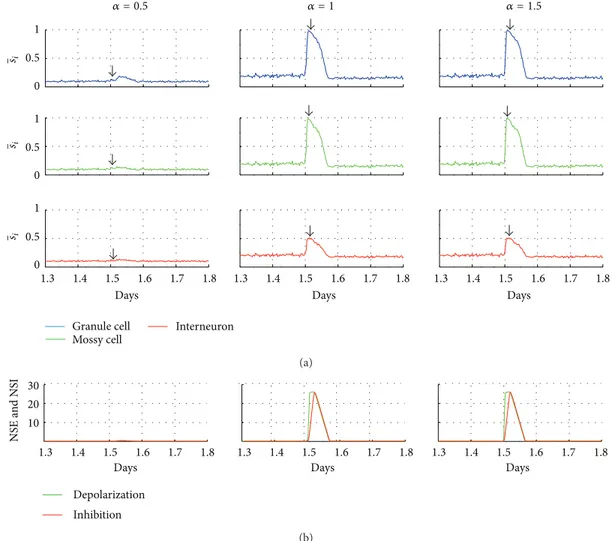
Figure 2: Stimulation efect on the neuronal network. (a) Average activity of the network for diferent types of cell in response to stimulation. (b) Curves of the nonsynaptic excitation (NSE) and inhibition (NSI) functions for the diferent stimulus intensities (� = 0.5,� = 1.0, and
� = 1.5, resp., let, middle, and right).
changes (duration of one morphogenetic time step Δ�). hus, one morphogenetic time step of the proposed model (Δ�) corresponds to the spiking remodelling and, similarly, to the axonal ramiication between diferent postsynaptic targets [25,26]. In the model, each morphogenetic time step corresponds to 150 interactions of�and each interaction�to 0.36 min.
he efect of the Hebbian rule on the connectivity changes and on the network activity was investigated to guarantee smooth connectivity changes. For this conditions, the possi-ble range for� (0 < � < 0.5)was determined.
3. Results
By investigating the efect of diferent strengths of stimulation
(� = 0.5, 1.0, and 1.5; duration= 70min) on the neuronal
network activity, an increase of induced activity can be seen (Figure 2). It can be observed that the increase of the network connectivity also causes a progressive increase of the network activity with aterdischarges. Mimicking the nonsynaptic
mechanisms, during aterdischarges, the depolarization func-tion NSE increases quickly, also raising the �� value. he inhibition function, NSI, increases more slowly and, at the end of aterdischarges, overcomes the excitation function. From that moment on, the values of NSE and NSI are restored to the levels at which the neuronal activity remains low.
transient change of the inhibitory efect of interneurons to excitatory efect aimed at representing the excitatory efect of the GABAa receptors, typical of the inlammatory states in the brain, which can persist from the irst 24 h for up to two weeks ater thestatus epilepticus[30]. Experimental observations show that ater status epilepticus, at the begin-ning of the latent period, changes in the transmembrane Cl-gradients may occur, due to anionic accumulation in the neuronal cytoplasm. his accumulation is enough to change the GABAa receptors activation efect from inhibitory to excitatory. he cause of this change was demonstrated to be related to the diminished expression of the cotransporter KCC2, responsible for the Cl-extrusion [30]. his mechanism is reported by Morimoto et al. [7] as the GABAa-mediated excitation hypothesis. his transient change was performed with the synaptic weight of two of the three interneurons altered according to the following equation:
��= � × 0.25 (tanh(� − ��
0.2 ) + 1.0)
× (tanh(� − ��
1.5 ) + 1.0) ,
(21)
where�� = 2days indicates the onset of the inlammatory state and��= 12.5days the end. Only two interneurons were submitted to the transient changes, since in the DG not all inhibitory synapses are GABAa [31]. he weight of the two interneuron connections was altered for the connection to 22 granule cells. his group of cells corresponds to the 22% of excitatory GABAa observed in epileptic human brain tissue [32,33]. Similar indings were also encountered by Pathak et al. [30] studying DG granule cells in rat hippocampus.
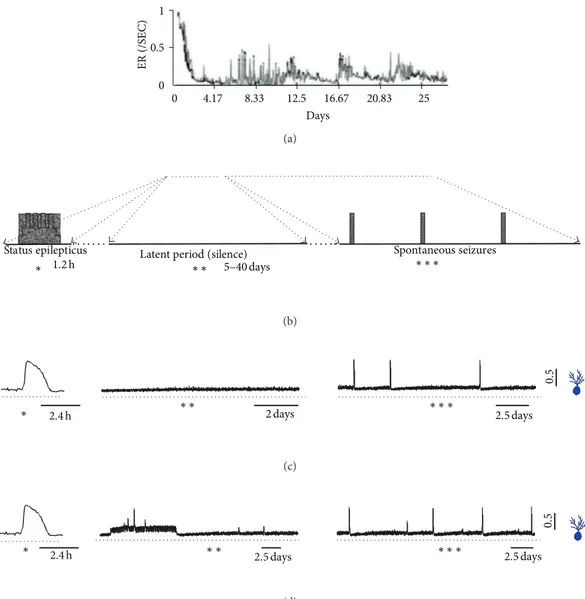
By comparing the simulation with experimental data the model can be evaluated according to its ability to represent mechanisms subserving the synaptogenesis and epileptoge-nesis involved in the status epilepticus (Figure 3). he three main periods that characterize the seizure progression ater status epilepticus can be distinguished in the simulations: status epilepticus, latent period, and spontaneous seizures. According to Morimoto et al. [7], in the model of status epilepticus the administration of chemical agents such as pilocarpine or kainate is followed by an emergence of contin-ual recurrent seizures sustained for several hours. he same process is represented in the simulations with the network stimulation. Following the induction of status epilepticus, the absence of seizures characterizes the latent (or silent) period. When the seizure returns, the period of spontaneous seizures starts. he simulations involving the stimulation period are in close correspondence with the occurrence of these periods. InFigure 3, the event rates registered experimentally by van Puttena et al. [6] and a diagrammatic representation of the periods, according to Morimoto et al. [7], are correlated with the simulations.
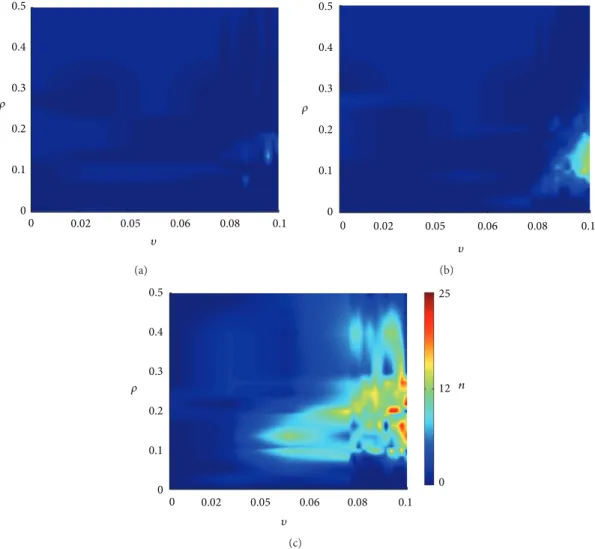
To analyze the SICA induction in the neuronal network, the occurrence of SICA along the 100 days, for all simulated situations, is shown inFigure 4. he SICAs are shown to have dependence on the combination of the parameters related to the compensation theory and the Hebbian rule. To perform the stimulation (Figure 4(b)), the stimulus was also applied
at day 1.5, with � = 1.0, during 70 min. he demarked SICAs are the ones whose activity exhibited variations greater than 30%, assuming that the less intense activities are not necessarily related to epileptiform activities. he average activity of the cells and the excitation and inhibition functions showed similar behaviour during the SICA to those observed during the induced increase by stimulation (Figure 2). What distinguishes the two events is the manner of triggering the activity. he SICA delagration was due to the increased eicacy of the synaptic connections.
InFigure 4(a), when the network is stimulated, it can be observed that the combinations of the compensation theory with Hebbian rule result in SICA for a limited range of values for�and �. In the case where the network was stimulated (Figure 4(b)), it is evident the increase of region where the SICA emerges, meaning larger range for�and �. Further-more, the number of SICA observed for each combination of � and � was higher. When the GABAa excitation was represented (Figure 4(c)), the conditions favorable for SICA occurred over a wider range of values of�and�.
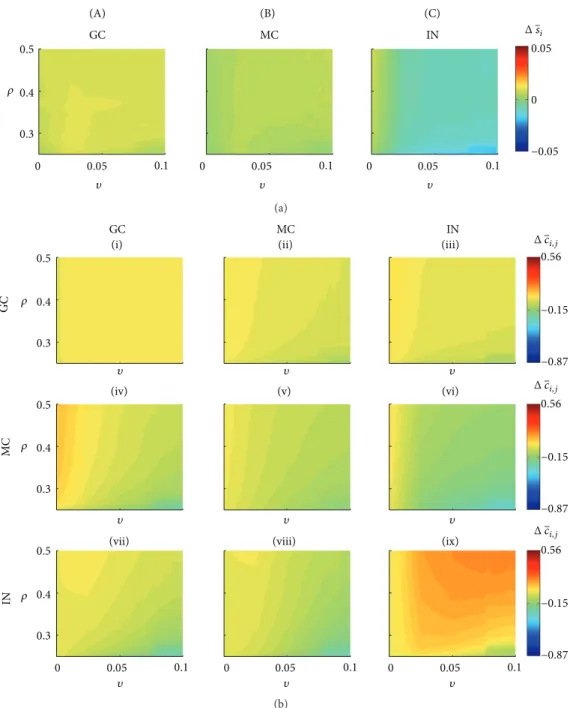
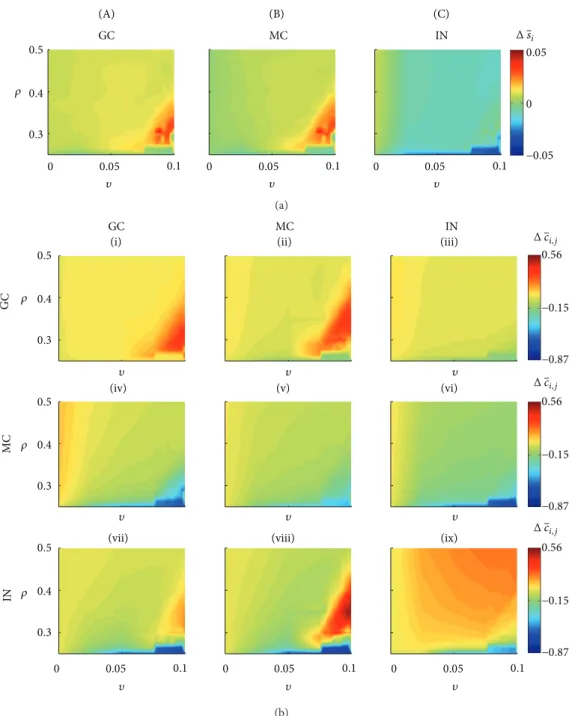
In the situation where the network has not been stimu-lated, it is possible to investigate the average activity of the diferent cell types (Figure 5(a)) as well as for each group of connections (Figure 5(b)). Ater 41 days, applying the theory of compensation and the Hebbian rule caused variation in the average activity of granule cells that ranged between 0.0034 and 0.0096% (<1%). his variation is associated with small changes in the connectivity between the granular cells (group I),Δ��� ≈ 0. For most combinations of�and�(Figure 5(b), yellow region), there are changes in the connections that the mossy cells and the interneurons send to the granule cells (groups IV and VII, resp.). he major variations of the connectivity of the groups IV and VII occurred for higher values of�and lower values of� (Figure 5(b), light blue region). Reductions were observed for both groups of connection in the order ofΔ��� ≈ −0.25. he changes in the average activity of the mossy cells were in the range−0.005 to 0.0068%, being associated with the following changes in the connectivity: group (II),Δ��� ∈ (−0.0981, 0.0280); group
(V), Δ��� ∈ (−0.1798, 0.0150); and group (VIII), Δ��� ∈
(−0.2760, 0.0060). Similarly for groups (I) and (IV), the major
reductions of connectivity occurred for higher values of � and lower for�(Figure 5(b), light blue region). he change in the connectivity of the interneurons was in the range
−0.0196 to 0.0079, and the reduction of the interneuron activity (Figure 5(a), IN, light blue region) can be attributed to the increased role of the compensation theory. he changes in the average activity were associated with the following connectivity changes: group (III),Δ��� ∈ (−0.1051, 0.0393); group (VI),Δ��� ∈ (−0.3205, 0.0330); and group (IX),Δ��� ∈
(−0.01341, 0.1819).
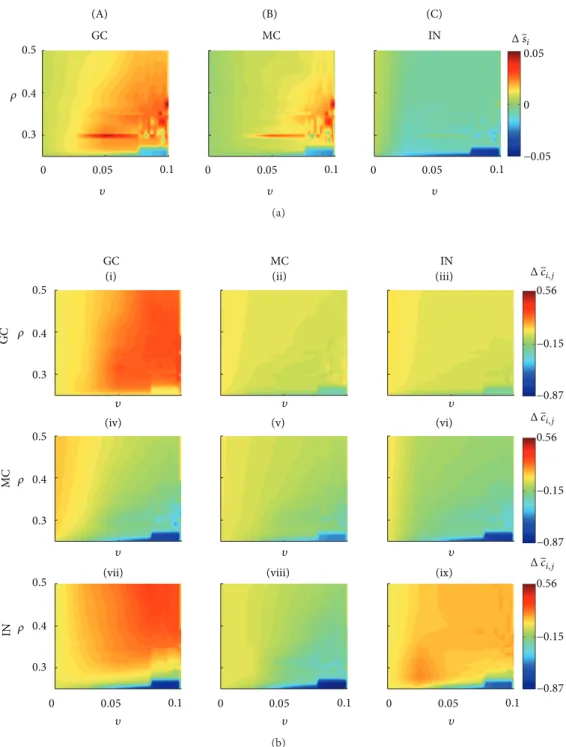
When the simulation includes the stimulation (� =
1.0, during 70 min), the percentage variation of the average activity in the 41st day, calculated in respect to the 1st day, was more intense for higher � values and lower � values (Figure 6(a), dark red regions, for GC and MC, and dark blue for IN). he increased average activity of the GC, in the order of 3% causing the most pronounced number of SICA for� ≤
4.17 8.33 12.5 16.67 20.83 25 0
0 0.5 1
Days
ER (/S
EC)
(a)
Status epilepticus Latent period (silence) Spontaneous seizures
1.2 h ∗ 5–40 days ∗∗∗
∗ ∗
(b)
2.4 h 2 days 2.5 days
0.
5
∗∗ ∗∗ ∗
∗
(c)
2.4 h 2.5 days 2.5 days
0.
5
∗∗ ∗ ∗ ∗
∗
(d)
Figure 3: Comparison between simulations and experimental indings, showing the development of epileptogenesis and emergence of recurrent spontaneous seizures in models ofstatus epilepticus.hestatus epilepticus, latent (or silent) period, and spontaneous seizures are depicted. (a) Event rate following kainic acid application (modiied from van Puttena et al. [6]). (b) Diagrammatic representation of the periods (modiied from Morimoto et al. [7]). (c) Average activity of the granule cells simulated with stimulation for inducing thestatus epilepticus. (d) Average activity of the granule cells simulating thestatus epilepticusand including change in the interneurons action from inhibitory to excitatory.
of the groups (I) and (VII), respectively, Δ��� ≈ 0.35 and
Δ���≈ 0.19, as well as reduction of the group (IV), withΔ���≈
−0.60(Figure 6(b)). For the same combination of� and �
values, the average activity of the MC also increased almost 3% and the following connectivity changes were observed: group (II),Δ��� ≈ 0.34; group (V),Δ��� ≈ −0.44; and group (VIII),Δ��� ≈ 0.55. On the other hand, the average activity of the interneurons decreased 3% and with the following connectivity changes with interneurons as the postsynaptic cells: group (III),Δ��� ≈ −0.14; group (VI),Δ��� ≈ −0.16; group (IX),Δ��� ≈ 0.19. When� = 0, that is, considering only the compensation theory, stimulation caused, especially for larger values of�, reduction in the level of activity and connectivity of the neurons.
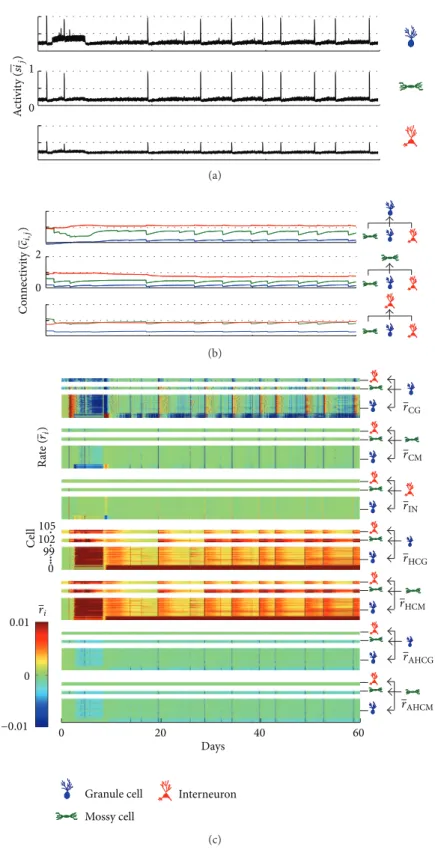
Including GABAa changing from inhibitory to excitatory for two interneurons and stimulating the neural network, the granule and mossy cells activities increase more intensely for a larger number of combinations of � and � values:
� > 0.1 and � ≥ 0.0025 (Figure 7(a)). he increase of
the average granule cell activities (∼5%) increased the SICA occurrence for� > 0.1and � ≥ 0.0025and is associated with connectivity increase for the groups (I)(Δ��� ≈ 0.32) and (VII)(Δ��� ≈ 0.31)and connectivity decrease for the group (IV) (Δ��� ≈ −0.74) (Figure 7(b)). For the same � and�values, the average activity of the mossy cells increased 4.5% and the following connectivity changes occurred: group (II),Δ��� ≈ −0.15; group (V),Δ��� ≈ −0.2; group (VIII),
0.5
0.4
0.3
0.2
0.1
0
0 0.02 0.05 0.06 0.08 0.1
�
�
(a)
0.5
0.4
0.3
0.2
0.1
0
0 0.02 0.05 0.06 0.08 0.1
�
�
(b)
25
12
0
0.02 0.05 0.06 0.08 0.1
0.5
0.4
0.3
0.2
0.1
0 0
� �
�
(c)
Figure 4: Spontaneous increases of SICA simulated for diferent values for�(Hebbian rules) and�(compensation theory). (a) No stimulation; (b) with stimulation; (c) with stimulation and the transient excitatory GABAa. “�” indicates numbers of SICA.
∼4% and the following changes in the connectivity occurred for postsynaptic interneurons: group (III), Δ��� ≈ −0.2; group (VI),Δ��� ≈ −0.25; group (IX),Δ��� ≈ 0.19. When
� = 0, therefore considering only the compensation theory,
the stimulation followed by the transient excitatory GABAa caused the most intense activity and connectivity reduction (dark blue regions).
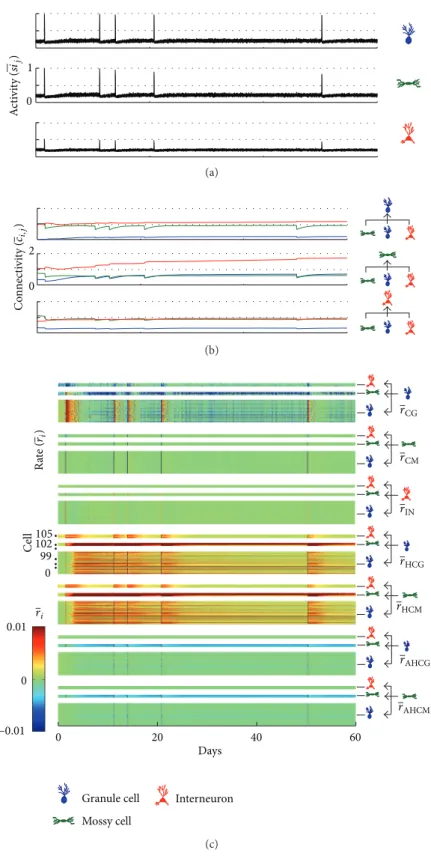
he higher incidence of SICA, reproducing the induction of epileptiform activity in experimental models, occurred
for � = 0.2182 and � = 0.1. For these
combina-tions of the compensation theory with the Hebbian rule, the occurrence of SICA is depicted in Figure 8(a). Con-comitantly, the inhibitory synapses formation rate increases throughout the network (Figure 8(c)—�IN). On the other
hand, the connectivity of the excitatory synapses decreases in response to the activity increase (Figure 8(b)) due to the compensatory theory (Figure 8(c)—�GC, �MC) and the
anti-Hebbian rule (Figure 8(c)—�AH). Following the
ater-discharges induced by the network stimulation, between the second and twelth days, the average activity of the network reduces (Figure 8(a)); it is when a progressive increase of the excitatory synapses takes place (Figure 8(b)—green and
blue curves). hese changes were correlated with the synaptic changes, with progressive increase of the excitatory synapses (Figure 8(b)), promoted by the Hebbian rule (Figure 8(c)—
��) and the compensation theory (Figure 8(c)—�GC, �MC),
and decrease of the inhibitory synapses (Figure 8(b)), due to compensation. Later, synaptic activity increases until the emergence of SICA. Changes in activity and connectivity during and subsequent to the SICA were similar to those observed for the increased activity induced by stimulation. Furthermore, it can be seen that the connectivity of all groups of connections, including group (I) representing the interconnections between the granule cells, increases to a maximum level.
0.05
0
−0.05
GC MC IN
(A) (B) (C)
0 0.05 0.1
0.3 0.4 0.5
0 0.05 0.1 0 0.05 0.1
�
Δ ��
� � �
(a)
0.56
−0.15
−0.87
0.56
−0.15
−0.87
0.56
−0.15
−0.87 0.3
0.4 0.5
0.3 0.4 0.5
0 0.05 0.1
0.1 0.05
0.3 0.4 0.5
0 0.05 0.1
GC MC IN
GC
MC
IN
(iii)
(i) (ii)
(iv) (v) (vi)
(vii) (viii) (ix)
0 �
�
�
Δ ��,�
Δ ��,�
Δ ��,�
� � �
� � �
� � �
(b)
Figure 5: Network changes when no stimulation was applied, for diferent combinations of�(Hebbian rules) and�(compensation theory). (a) Percentage variation of the average activity for the three diferent cell types. (b) Connectivity changes for each group (I–IX). he changes in the average activity and connectivity were calculated for the irst 41 days. GC: granule cells; MC: mossy cells; IN: interneurons.
increased for all cell types, due to compensation. Ater this period, a progressive increase of the connectivity takes place between the GC and also the excitatory connectivity of the MC. In respect to the inhibitory synapses, the main efect is reduction of the inhibitory input on the MC (Figure 9(b)).
4. Discussion
he aim of the work presented was to investigate, by means of mathematical modelling and computational simulation, the interplay between changes in synaptic connectivity and the induction of SICA on neuronal networks that rep-resents the circuitry of the DG of the rat hippocampus.
he neuronal networks used described the cellular activity with dependence on the synaptic connectivity, according to McCulloch-Pitts formalism [15], and on the non-synaptic mechanisms typical of the DG region. he correspondence between the simulations and the experimental indings allows for the proposal of possible mechanisms involved. Assuming that the synaptic connectivity can be altered following the compensation theory [17,18] and the Hebbian rules [24], the simulations performed suggest the following:
GC MC IN
(A) (B) (C)
0 0.05 0.1
0.3 0.4 0.5
0 0.05 0.1 0 0.05 0.1
0.05
0
−0.05 �
Δ ��
� � �
(a)
0.3 0.4 0.5
0.3 0.4 0.5
0 0.05 0.1
0.1 0.05
0.3 0.4 0.5
0 0.05 0.1
GC MC IN
GC
MC
IN
(iii)
(i) (ii)
(iv) (v) (vi)
(vii) (viii) (ix)
0
0.56
−0.15
−0.87
0.56
−0.15
−0.87
0.56
−0.15
−0.87 �
�
�
Δ ��,�
Δ ��,�
Δ ��,�
� � �
� � �
� � �
(b)
Figure 6: Network changes when stimulation was applied, for diferent combinations of�(Hebbian rules) and�(compensation theory). (a) Percentage variation of the average activity for the three diferent cell types. (b) Connectivity changes for each group (I–IX). he changes in the average activity and connectivity were calculated for the irst 41 days. GC: granule cells; MC: mossy cells; IN: interneurons.
(ii) besides the abnormal mossy iber sprouting, other modiications of connectivity, such as those that result in reduction of inhibitory cell activity, contribute to the occurrence of SICA;
(iii) the transient excitatory GABAa, during the inlam-matory period subsequent to the status epilepticus, acts, intensifying the Hebbian rules action and, con-sequently, strengthening the abnormal mossy iber sprouting.
4.1. Network in Absence of Stimulation. According to Schae-fers et al. [34], the DG exhibits high synaptic turnover rate
GC MC IN
(A) (B) (C)
0 0.05 0.1
0.3 0.4 0.5
0 0.05 0.1 0 0.05 0.1
0.05
0
−0.05 �
Δ ��
� � �
(a)
0.3 0.4 0.5
0.3 0.4 0.5
0 0.05 0.1
0.1 0.05
0.3 0.4 0.5
0 0.05 0.1
GC MC IN
GC
MC
IN
(iii)
(i) (ii)
(iv) (v) (vi)
(vii) (viii) (ix)
0
0.56
−0.15
−0.87
0.56
−0.15
−0.87
0.56
−0.15
−0.87 �
�
�
Δ ��,�
Δ ��,�
Δ ��,�
� � �
� � �
� � �
(b)
Figure 7: Network changes when stimulation was applied and the transient excitatory GABAa was represented, for diferent combinations of� (Hebbian rules) and�(compensation theory). (a) Percentage variation of the average activity for the three diferent cell types. (b) Connectivity changes for each group (I–IX). Changes in the average activity and connectivity were calculated for the irst 41days. GC: granule cells; MC: mossy cells; IN: interneurons.
favouring the emergence of epileptiform events, even in the absence of stimulation or another action to increase excita-tion. In this situation, two alterations in the connectivity can be qualiied as the main reason for the SICA (Figure 5): (i) the decrease of the inhibition action on the mossy cells and (ii) the increase of the inhibition action on the interneurons.
1
0
A
cti
vi
ty
(
���
)
(a)
0 2
C
o
nn
ecti
vi
ty
(
��,�
)
(b)
0 105
99 102
0 20 40
Days
Granule cell
Ce
ll
Mossy cell
Interneuron
60 0.01
0
−0.01
𝑟�
𝑟AHCM 𝑟AHCG 𝑟HCG 𝑟IN 𝑟CM 𝑟CG
𝑟HCM
Ra
te
(
𝑟�
)
(c)
Figure 8: Average activity (a), average connectivity (b), and average synaptic formation rate for each cell type (c), depending on the Hebbian and anti-Hebbian rules and compensation theory. he simulation was performed with simulation at day 1.5,� = 0.1and� = 0.2182.
mossy cell excitability is responsible for the generation and sustaining of epileptic seizures.
he increase of the inhibitory action on the interneu-rons, therefore the second connectivity alteration, results in
0 1
A
cti
vi
ty
(
���
)
(a)
0 2
C
o
nn
ecti
vi
ty
(
��,�
)
(b)
0 105
99 102
0 20 40
Days
Granule cell
Ce
ll
Mossy cell
Interneuron
60 0.01
0
−0.01
𝑟�
𝑟AHCM 𝑟AHCG 𝑟HCG 𝑟IN 𝑟CM 𝑟CG
𝑟HCM
Ra
te
(
𝑟�
)
(c)
Figure 9: Average activity (a), average connectivity (b), and average synaptic formation rate for each cell type (c), depending on the Hebbian and anti-Hebbian rules and compensation theory. he simulation was performed with simulation at day 1.5,� = 0.1and� = 0.2182, considering the occurrence of the transient excitatory GABAa.
and sustaining of the epileptic seizures. In this hypothesis, the interneurons’ death or activation reduction is the main cause of the seizure disruption. he simulations present additional mechanisms that can produce the same efect.
In the simulations, without stimulation, the SICAs were not due to the abnormal mossy ibers sprouting, since there was no signiicant increase in the interconnectivity of the granule cells (Figure 4—group (I)). his indicates that the abnormal mossy iber sprouting, although oten observed in experimental epilepsy [36], is not necessary for the seizure disruption. his result is consistent with the experimental indings from Buckmaster and Lew [37]. he epileptic rats treated with rapamycin, a suppressant of the axon sprouting, had no efect on seizure occurrence. It has been shown that amygdala, subiculum, and other temporal limbic structures could replace the mossy iber efects. In fact, other brain areas show increases in recurrent excitation in models of TLE. he simulations ofer an additional insight into this ield, the network disconnected from other structures, and without mossy iber sprouting was able to support synaptic reorganization with generation of spontaneous seizure by means of the Hebbian rules and compensation theory.
4.2. Network with Stimulation. When stimulated, the net-work simulation shows an increase in the neuronal activity enough to overcome the threshold for actuation of non-synaptic mechanisms with subsequent triggering of SICA (Figure 2). he SICA duration was about 1.8 h and, associ-ated with the experimental conditions, represents thestatus epilepticus. According to the simulations, thestatus epilepticus
may be modulated by nonsynaptic mechanisms. In fact, experimental observations ofer support to this speculation, since it was conirmed that nonsynaptic mechanisms are able to sustain epileptiform seizures in DG of rats’ hippocampus [14,22,38–40].
During the period corresponding to thestatus epilepticus, the compensation theory causes excitatory reduction and inhibitory increase in the network connectivity. In conse-quence, immediately ater the end of the period, the activity of the neural network was reduced, characterized as the latency period for the occurrence of SICA, which may be associated with the latency period observed for epilepsy induction with experimental models [7, 41]. During this period, following the compensation theory, new excitatory synapses are formed with the goal of reversing the activity reduction. Among these excitatory synapses included the interconnectivity between granule cells and the increase which characterizes the abnormal mossy iber sprouting. he simulations suggest that the abnormal mossy iber sprouting starts as a protective mechanism of the neural network, in order to compensate the increase of inhibitory synapses that occur duringstatus epilepticus. his hypothesis reinforces the view that the axonal sprouting and the reactive synaptoge-nesis of the dentate gyrus serve as a repair mechanism, in order to restore normal function of the tissue [36]. However, an increase in the interconnectivity of the granule cells improves the performance of the Hebbian rules and the iring of a pre-synaptic cell is able to inluence even more the iring of the postsynaptic cell connected. Consequently, the simulations suggest that the Hebbian rules, reinforced by the compensation theory, contribute to intensify the abnormal mossy iber sprouting. his may happen along several days, during the latency period and even ater SICA disruption.
he intense interconnectivity between granule cells (Figures
5(b)and7(b)) and the resulting increase of SICA occurrence (Figure 4(b)) take place for higher �values (compensation theory) and lower, however not null,�value (Hebbian rule), supporting the hypothesis that both theories (compensation and Hebbian) may be realized in the same network [19]. his dependence on�and �suggests that the interconnec-tivity increases between granule cells (abnormal mossy iber sprouting) and the SICA happens only if the compensation theory forms inhibitory synapses and degenerates excitatory synapses more eiciently than the Hebbian rules increaseing the synaptic weight of the excitatory connections of the network. Additionally, the simulations show that the Hebbian rules are indispensable. When� = 0, the stimulation leads the network to a degeneration due to the action of the compensation theory.
4.3. Network with Stimulation and Transient Excitatory GABAa. he simulation of the network including the stim-ulation and also the excitatory efect of the GABAa synapses increased the occurrence of SICA and the range of combining values for�and �able to sustain them. he main changes observed in these simulations were the intense increase of the interconnectivity between granule cells (Figures7and9). he simulations suggest that the excitatory GABAa synapses counteract the activity reduction caused by the increase of inhibitory connectivity along of thestatus epilepticus. his process enhanced granule cell iring, which, ater thestatus epilepticus, was more interconnected due to the compensa-tion theory. hus, the granule cell promotes even more iring of action potentials between them. herefore, the Hebbin rules were reinforced and the abnormal mossy iber sprouting was intensiied. hese simulations support the conjecture that slow plasticity changes (Hebbian plasticity) ater brain injury orstatus epilepticusmay act on the eventual transition to the epilepsy state [42].
5. Conclusion
Stimulation (electrical, chemical, injury, etc.)
Status epilepticus seizures
Latency period Epileptic state
Seizure
Time CT
Inhibition
Excitation
MFS
Cellular activity
(−) (+)
GC MC IN
Inflammatory period CT
Inhibition
Excitation
NS Inhibition
Excitation
NS Inhibition Excitation HR
Excitation
HR
Excitation
HR
Excitation HR
Excitation
NS Inhibition
Excitation
NS Inhibition Excitation CT
Inhibition Excitation
CT Inhibition Excitation
MFS
Figure 10: Pictorial representation of the conjoint action of the compensation theory and the Hebbian rules for the structural rearrangement of the dentate gyrus favourable to epileptic seizures. (bottom row) DG circuitry represented schematically with connectivity level (axonal branches) and cell activity (colour intensity). (top row) Excitation and inhibition actions associated to the compensation theory (CT), the Hebbian rules (HR), and the nonsynaptic mechanisms (NS). he neuronal network states associated with the epilepsy induction states (resting, status epilepticus, latent, and epilepsy) are indicated in the top line. he inlammatory period is indicated and its efect on the Hebbian rules is highlighted in red. he mechanisms involved in the abnormal mossy iber sprouting are indicated by the green dashed line. GC: granule cells; MC: mossy cells; IN: interneurons.
the emergence of excitatory connections between granule cells, which indicates the onset of abnormal mossy iber sprouting. During this period, the non-synaptic mechanisms do not contribute signiicantly to the excitability. In this sense, the abnormal mossy iber sprouting arises as a protective mechanism, which tends to reverse the reduction of granule cell activities induced by the status epilepticus. he mossy iber sprouting increases the connectivity between granule cells and reinforces the action of the Hebbian rules. In positive feedback, the Hebbian rule enhances the mossy iber sprouting and helps to increase granule cell activity. Additionally, at the beginning of the latency period, the efect of the transient excitatory GABAa, promoted by the inlammatory process, contributes to reverse the neuronal activity reduction. his efect further enhances the perfor-mance of the Hebbian rules on the mossy iber sprouting. As long as the abnormal mossy iber sprouting intensiies, the excitation increases and, following the compensation theory, the network reacts to reverse this situation. When the abnormal mossy iber sprouting is able to increase the granule cell activities overcoming the threshold of the nonsynaptic mechanisms actuation, the transition to the epilepsy state takes place.
he predictions proposed in this paper could be used to experimentally test the conjoint action of the compensation theory and Hebbian rule on the epileptogenesis induced by models ofstatus epilepticus.
Acknowledgments
his work was supported by the Brazilian agencies Con-selho Nacional de Desenvolvimento Cient´ıico e Tecnol´ogico (CNPq), Fundac¸˜ao de Amparo `a Pesquisa do Estado de Minas Gerais (FAPEMIG), Fundac¸˜ao CAPES, FAPESP/FAPEMIG, and INNT.
References
[1] J. Engel,Seizures and Epilepsy, Edited by F. A. Davis Company, F. A. Davis Company, Philadelphia, Pa, USA, 1989.
[2] M. J. S. Fernandes, E. A. Cavalheiro, J. P. Leite, and D. S. Persike, “Temporal lobe epilepsy: cell death and molecular targets activity,” inUnderlying Mechanisms of Epilepsy, F. S. Kaneez, Ed., pp. 117–134, InTech, Rijeka, Croatia, 2011.
[3] A. K. Sharma, R. Y. Reams, W. H. Jordan, M. A. Miller, H. L. hacker, and P. W. Snyder, “Mesial temporal lobe epilepsy: pathogenesis, induced rodent models and lesions,”Toxicologic Pathology, vol. 35, no. 7, pp. 984–999, 2007.
[4] F. A. Guedes, O. Y. Galvis-Alonso, and J. P. Leite, “Plasticidade neuronal associada `a epilepsia do lobo temporal mesial: insights a partir de Estudos em Humanos e em Modelos Animais,” Jour-nal of Epilepsy and Clinical Neurophysiology, vol. 12, pp. 10–17, 2006.
[6] M. J. A. M. van Puttena, L. C. Liefaardb, M. Danhof, and R. A. Voskuyl, “Quantitative EEG analysis: a biomarker for epilep-togenesis,” in Pharmacoresistance in Epilepsy-Modelling and Prediction of Disease Progression, C. Liefaard, Ed., pp. 51–67, 2008.
[7] K. Morimoto, M. Fahnestock, and R. J. Racine, “Kindling and status epilepticus models of epilepsy: rewiring the brain,” Progress in Neurobiology, vol. 73, no. 1, pp. 1–60, 2004. [8] J. E. Franck, J. Pokorny, D. D. Kunkel, and P. A. Schwartzkroin,
“Physiologic and morphologic characteristics of granule cell circuitry in human epileptic hippocampus,”Epilepsia, vol. 36, no. 6, pp. 543–558, 1995.
[9] M. M. Okazaki, P. Moln´ar, and J. V. Nadler, “Recurrent mossy iber pathway in rat dentate gyrus: synaptic currents evoked in presence and absence of seizure-induced growth,”Journal of Neurophysiology, vol. 81, no. 4, pp. 1645–1660, 1999.
[10] J. P. Wuarin and F. E. Dudek, “Electrographic seizures and new recurrent excitatory circuits in the dentate gyrus of hip-pocampal slices from kainate-treated epileptic rats,”Journal of Neuroscience, vol. 16, no. 14, pp. 4438–4448, 1996.
[11] W. W. Lytton, K. M. Hellman, and T. P. Sutula, “Computer models of hippocampal circuit changes of the kindling model of epilepsy,”Artiicial Intelligence in Medicine, vol. 13, no. 1-2, pp. 81–97, 1998.
[12] V. Santhakumar, I. Aradi, and I. Soltesz, “Role of mossy iber sprouting and mossy cell loss in hyperexcitability: a network model of the dentate gyrus incorporating cell types and axonal topography,”Journal of Neurophysiology, vol. 93, no. 1, pp. 437– 453, 2005.
[13] R. J. Morgan and I. Soltesz, “Nonrandom connectivity of the epileptic dentate gyrus predicts a major role for neuronal hubs in seizures,”Proceedings of the National Academy of Sciences of the United States of America, vol. 105, no. 16, pp. 6179–6184, 2008.
[14] A. C. G. Almeida, A. M. Rodrigues, F. A. Scorza et al., “Mech-anistic hypotheses for nonsynaptic epileptiform activity induc-tion and its transiinduc-tion from the interictal to ictal state-Computa-tional simulation,”Epilepsia, vol. 49, no. 11, pp. 1908–1924, 2008. [15] W. S. McCulloch and W. Pitts, “A logical calculus of the ideas immanent in nervous activity,”he Bulletin of Mathematical Biophysics, vol. 5, no. 4, pp. 115–133, 1943.
[16] J. Dyhrjeld-Johnsen, V. Santhakumar, R. J. Morgan, R. Huerta, L. Tsimring, and I. Soltesz, “Topological determinants of epilep-togenesis in large-scale structural and functional models of the dentate gyrus derived from experimental data,”Journal of Neurophysiology, vol. 97, no. 2, pp. 1566–1587, 2007.
[17] J. R. Wolf and G. P. Wagner, “Selforganization in synapto-genesis: interaction between the formation of excitatory and inhibitory synapses,” inSynergetics of the Brain, E. Basar, H. Flohr, H. Haken, and A. J. Mandell, Eds., pp. 50–59, Springer, Berlin, Germany, 1983.
[18] I. E. Dammasch and G. P. Wagner, “On the properties of randomly connected McCulloch-Pitts networks: diferences between input-constant and input-variant networks,” Cybernet-ics and Systems, vol. 15, no. 1-2, pp. 91–117, 1984.
[19] I. E. Dammasch, G. P. Wagner, and J. R. Wolf, “Self-stabilization of neuronal networks I. he compensation algorithm for synap-togenesis,”Biological Cybernetics, vol. 54, no. 4-5, pp. 211–222, 1986.
[20] M. Butz, K. Lehmann, I. E. Dammasch, and G. Teuchert-Noodt, “A theoretical network model to analyse neurogenesis
and synaptogenesis in the dentate gyrus,”Neural Networks, vol. 19, no. 10, pp. 1490–1505, 2006.
[21] I. E. Dammasch, G. P. Wagner, and J. R. Wolf, “Self-stabilization of neuronal networks. II. Stability conditions for synaptogene-sis,”Biological Cybernetics, vol. 58, no. 3, pp. 149–158, 1988. [22] A. C. G. Almeida, A. M. Rodrigues, M. A. Duarte et al.,
“Bio-physical aspects of the nonsynaptic epileptiform activity,” in Underlying Mechanisms of Epilepsy, F. S. Kaneez, Ed., pp. 189– 218, InTech, Rijeka, Croatia, 2011.
[23] L. J. Cromme and I. E. Dammasch, “Compensation type algo-rithms for neural nets: stability and convergence,”Journal of Mathematical Biology, vol. 27, no. 3, pp. 327–340, 1989. [24] J. Lisman, “A mechanism for the Hebb and the anti-Hebb
processes underlying learning and memory,”Proceedings of the National Academy of Sciences of the United States of America, vol. 86, no. 23, pp. 9574–9578, 1989.
[25] J. T. Trachtenberg, B. E. Chen, G. W. Knott et al., “Long-term in vivo imaging of experience-dependent synaptic plasticity in adult cortex,”Nature, vol. 420, no. 6917, pp. 788–794, 2002. [26] V. De Paola, A. Holtmaat, G. Knott et al., “Cell type-speciic
structural plasticity of axonal branches and boutons in the adult neocortex,”Neuron, vol. 49, no. 6, pp. 861–875, 2006.
[27] J. E. Cavazos, G. Golarai, and T. P. Sutula, “Mossy iber synaptic reorganization induced by kindling: time course of develop-ment, progression, and permanence,”Journal of Neuroscience, vol. 11, no. 9, pp. 2795–2803, 1991.
[28] B. Adams, M. Lee, M. Fahnestock, and R. J. Racine, “Long-term potentiation trains induce mossy iber sprouting,”Brain Research, vol. 775, no. 1-2, pp. 193–197, 1997.
[29] U. Sayin, S. Osting, J. Hagen, P. Rutecki, and T. Sutula, “Sponta-neous seizures and loss of axo-axonic and axo-somatic inhibi-tion induced by repeated brief seizures in kindled rats,”Journal of Neuroscience, vol. 23, no. 7, pp. 2759–2768, 2003.
[30] H. R. Pathak, F. Weissinger, M. Terunuma et al., “Disrupted den-tate granule cell chloride regulation enhances synaptic excitabil-ity during development of temporal lobe epilepsy,”Journal of Neuroscience, vol. 27, no. 51, pp. 14012–14022, 2007.
[31] S. W. Briggs and A. S. Galanopoulou, “Altered GABA signaling in early life epilepsies,”Neural Plasticity, vol. 2011, Article ID 527605, 16 pages, 2011.
[32] I. Cohen, V. Navarro, S. Clemenceau, M. Baulac, and R. Miles, “On the origin of interictal activity in human temporal lobe epilepsy in vitro,”Science, vol. 298, no. 5597, pp. 1418–1421, 2002. [33] G. Huberfeld, L. Wittner, S. Clemenceau et al., “Perturbed chlo-ride homeostasis and GABAergic signaling in human temporal lobe epilepsy,”Journal of Neuroscience, vol. 27, no. 37, pp. 9866– 9873, 2007.
[34] A. T. U. Schaefers, K. Grafen, G. Teuchert-Noodt, and Y. Winter, “Synaptic remodeling in the dentate gyrus, CA3, CA1, subicu-lum, and entorhinal cortex of mice: efects of deprived rearing and voluntary running,”Neural Plasticity, vol. 2010, Article ID 870573, 11 pages, 2010.
[35] V. Santhakumar, R. Bender, M. Frotscher et al., “Granule cell hyperexcitability in the early post-traumatic rat dentate gyrus: the ’irritable mossy cell’ hypothesis,”Journal of Physiology, vol. 524, no. 1, pp. 117–134, 2000.
[36] J. V. Nadler, “he recurrent mossy iber pathway of the epileptic brain,”Neurochemical Research, vol. 28, no. 11, pp. 1649–1658, 2003.
temporal lobe epilepsy,”Journal of Neuroscience, vol. 31, no. 6, pp. 2337–2347, 2011.
[38] J. G. R. Jeferys and H. L. Haas, “Synchronized bursting of CA1 hippocampal pyramidal cells in the absence of synaptic transmission,”Nature, vol. 300, no. 5891, pp. 448–450, 1982. [39] C. P. Taylor and F. E. Dudek, “Synchronous neural
aterdischar-ges in rat hippocampal slices without active chemical synapses,” Science, vol. 218, no. 4574, pp. 810–812, 1982.
[40] Z. Q. Xiong and J. L. Stringer, “Sodium pump activity, not glial spatial bufering, clears potassium ater epileptiform activity induced in the dentate gyrus,”Journal of Neurophysiology, vol. 83, no. 3, pp. 1443–1451, 2000.
[41] M. Frotscher, P. Jonas, and R. S. Sloviter, “Synapses formed by normal and abnormal hippocampal mossy ibers,”Cell and Tis-sue Research, vol. 326, no. 2, pp. 361–367, 2006.
Submit your manuscripts at
http://www.hindawi.com
Computer Games Technology
International Journal of
Hindawi Publishing Corporation
http://www.hindawi.com Volume 2014
Hindawi Publishing Corporation
http://www.hindawi.com Volume 2014 Distributed
Sensor Networks
International Journal of
Advances in
Fuzzy
Systems
Hindawi Publishing Corporation
http://www.hindawi.com Volume 2014
International Journal of
Reconfigurable Computing
Hindawi Publishing Corporation
http://www.hindawi.com Volume 2014
Hindawi Publishing Corporation
http://www.hindawi.com Volume 2014
Applied
Computational
Intelligence and Soft
Computing
Advances in
Artiicial
Intelligence
Hindawi Publishing Corporationhttp://www.hindawi.com Volume 2014
Advances in
Software Engineering
Hindawi Publishing Corporation
http://www.hindawi.com Volume 2014
Hindawi Publishing Corporation
http://www.hindawi.com Volume 2014 Electrical and Computer Engineering
Journal of Journal of
Computer Networks and Communications
Hindawi Publishing Corporation
http://www.hindawi.com Volume 2014
Hindawi Publishing Corporation
http://www.hindawi.com Volume 2014
Multimedia
International Journal of
Biomedical Imaging
Hindawi Publishing Corporation
http://www.hindawi.com Volume 2014
Artiicial
Neural Systems
Advances inHindawi Publishing Corporation
http://www.hindawi.com Volume 2014
Robotics
Journal ofHindawi Publishing Corporation
http://www.hindawi.com Volume 2014 Hindawi Publishing Corporation
http://www.hindawi.com Volume 2014
Computational Intelligence and Neuroscience
Hindawi Publishing Corporation
http://www.hindawi.com Volume 2014
Modelling & Simulation in Engineering
Hindawi Publishing Corporation
http://www.hindawi.com Volume 2014
The Scientiic
World Journal
Hindawi Publishing Corporationhttp://www.hindawi.com Volume 2014
Hindawi Publishing Corporation
http://www.hindawi.com Volume 2014 Human-Computer Interaction
Advances in
Computer EngineeringAdvances in
Hindawi Publishing Corporation
![Table 1: Morphogenetic rules according to Dammasch et al. [21].](https://thumb-eu.123doks.com/thumbv2/123dok_br/17578235.266878/5.900.76.823.133.287/table-morphogenetic-rules-according-dammasch-et-al.webp)