Substorm associated radar auroral surges: a statistical study
and possible generation model
B. A. Shand, M. Lester and T. K. Yeoman
Department of Physics and Astronomy, University of Leicester, University Road, Leicester, LE1 7RH, UK
Received: 1 April 1997 / Revised: 6 October 1997 / Accepted: 22 October 1997
Abstract. Substorm-associated radar auroral surges (SARAS) are a short lived (15±90 minutes) and spatially localised (5° of latitude) perturbation of the plasma
convection pattern observed within the auroral E-region. The understanding of such phenomena has important rami®cations for the investigation of the larger scale plasma convection and ultimately the coupling of the solar wind, magnetosphere and iono-sphere system. A statistical investigation is undertaken of SARAS, observed by the Sweden And Britain Radar Experiment (SABRE), in order to provide a more extensive examination of the local time occurrence and propagation characteristics of the events. The statistical analysis has determined a local time occurrence of observations between 1420 MLT and 2200 MLT with a maximum occurrence centred around 1700 MLT. The propagation velocity of the SARAS feature through the SABRE ®eld of view was found to be predominately L-shell aligned with a velocity centred around 1750 m s)1
and within the range 500 m s)1 and 3500 m s)1. This
comprehensive examination of the SARAS provides the opportunity to discuss, qualitatively, a possible gener-ation mechanism for SARAS based on a proposed model for the production of a similar phenomenon referred to as sub-auroral ion drifts (SAIDs). The results of the comparison suggests that SARAS may result from a similar geophysical mechanism to that which produces SAID events, but probably occurs at a dierent time in the evolution of the event.
Key words. SubstormsáAuroral surgesá Plasma
con-vectionáSub-auroral ion drifts
1 Introduction
The understanding of short lived or spatially localised variations in the auroral ionospheric convection ¯ow
has important rami®cations concerning the investigation of the larger scale plasma convection system, and ultimately the coupling of the solar wind, magneto-sphere and ionomagneto-sphere system. One such transient auroral feature known as a substorm-associated radar auroral surge (SARAS) was ®rst identi®ed by Freeman et al. (1992) in data from the bistatic Sweden And Britain Radar Experiment (SABRE; Nielsen et al., 1983a). A number of SARAS were identi®ed by Freeman and co-workers of which three were examined in detail. The main characteristics of the SARAS events obtained from the study by Freeman and co-workers of the radar data are as follows
1. An enhancement in the magnitude of the estimated E-region drift velocity up to 1 km s)1over periods of
tens of minutes.
2. A decrease in backscatter intensity observed in data from both radars during the period of enhanced drift velocity (i.e. the variation in the backscatter intensity is anti-correlated with the changes in the velocity magnitude).
3. Drift of the entire signature, with a velocity of the order of 2 1 km s)1, in an approximately
west-ward direction.
4. The three SARAS events studied in detail by Freeman and co-workers were observed some minutes after substorm expansion phase onsets.
5. The latitudinal extent of a SARAS is comparable with or possibly larger than the observational area of the SABRE radar (5°).
An unexpected result from the investigation of the SARAS by Freeman et al. (1992) was the reduction in backscatter intensity at both radar sites during the period of enhanced plasma ¯ow. The authors suggested the observation may be a result of a reduction in the local electron density, which would have the eect of reducing the scattering cross section presented to the radar. Shand et al. (1996) investigated the statistical behavior of backscatter intensity as a function of line of sight (l.o.s) velocity for the entire SABRE data set. The
intensity was found to decrease for l.o.s velocities above 700 m s)1for ¯ow towards the radar which is
predom-inately associated with ionospheric convection observed within the eastward electrojet. In this work a statistical investigation of this SARAS type feature is presented with a view to extending the understanding of the SARAS signature. Results from the statistical study, along with information obtained by Freeman and co-workers, are further employed in an investigation of a generation mechanism for SARAS based on a model proposed by Andersonet al. (1993) for sub-auroral ion drifts (SAIDs; e.g. Anderson et al., 1991; Spiro et al., 1979).
2 SABRE
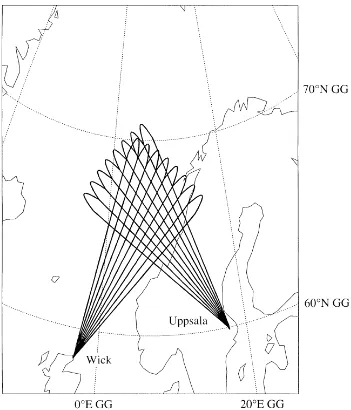
SABRE (Nielsenet al., 1983a) was a bistatic VHF radar system which operated from its deployment in 1981 until 1986. The two components of the SABRE system were located at Wick, Scotland (58.4°N,)3.1°E Geographic) and at Uppsala, Sweden (59.9°N, 17.7°E Geographic). Figure 1 is a schematic of the beam geometry of the two SABRE radars and also indicates the area observed by overlapping beams. Within the common observation volume of the two radar systems the individual Doppler velocities can be combined, by means of the `cosine rule', to produce an estimation of the electron drift velocity (E´ B). However, a number of studies (e.g.
Nielsen et al., 1983b; Nielsen and Schlegel, 1985; Robinson, 1993) have shown that the estimation of the direction and magnitude of the true electronE´ Bdrift
velocity determined by this technique leads to an underestimation of the magnitude and error in the direction when compared to the true electron drift velocity. The dierences are a result of the saturation of the observed Doppler velocities close to the local ion acoustic velocity and which, therefore, do not represent the true component of the electron drift in the direction of the radar k-vector. The saturation of measured Doppler velocities occurs when the scattering irregular-ity is generated by the Farley-Buneman or modi®ed two-stream instability (see review by Fejer and Kelly, 1980; Fejer and Providakes, 1987 and references therein). The common viewing area of the SABRE system was
2´105km2 with an observational scale size of
22´ 22 km, based on a 26 ´26 regular grid of data points.
A statistical data base was compiled during the 5 years, 1982±1986, in which both radar sites of the SABRE system operated. The data base consists of one minute average data of the east-west and north-south estimated drift velocities as well as the backscatter intensity from both radar sites. Each parameter being averaged for a location close to the centre of the SABRE combined viewing area (65°N±67°N, 5°E±7°E). The area employed in the statistical data base will be referred to as thecentral positionof the SABRE viewing area in all following sections.
3 SARAS identi®cation
It was crucial for this study that SARAS type events could be automatically and unambiguously identi®ed and a computer-based algorithm was therefore devel-oped for this purpose. A computer-based algorithm was adopted in preference to an ``eyeball'' search of the available data to provide a set of objective criteria for the selection of SARAS events. The algorithm is based upon a set of simple predetermined selection criteria drawn from the de®nition of SARAS by Freemanet al. (1992). Figure 2 of Freeman et al. (1992) illustrates the diversity of the SARAS signature, which resulted in some major diculties in determining a set of selection criteria from which an algorithm could be coded. Many methods were investigated during the development of the algorithm, one of which led to the investigation of the variation of the backscatter intensity as a function of the Doppler velocity measured by the Wick radar (Shand et al., 1996).
The selection algorithm and associated criteria ®nally adopted was devised to ensure selection of the majority of events outlined by Freemanet al. (1992). The initial requirement of the algorithm was that the acceleration of the ¯ow speed, as a function of time, exceeded a value of 30 m s)2for the start epoch of an event to be set. The
absolute velocity time series was then cross-correlated with two idealised functions (see Fig. 2a) chosen to allow the selection of all those SARAS events presented in the study by Freeman and co-workers. All ideal functions employed by the algorithm were constructed from sinusoids with base values appended to either end Fig. 1. Schematic of the beam geometry of the Sweden And Britain
Radar Experiment (SABRE)
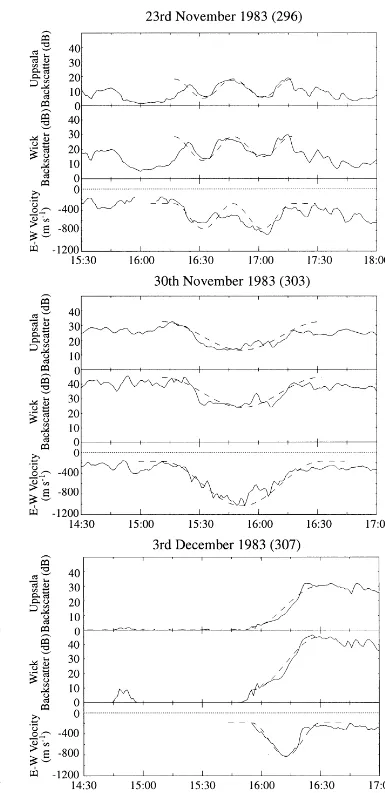
of the function. The time extent of these idealised functions was automatically adjusted to determine a ``best ®t'' of the data with the function (de®ned by the maximum zero lag cross-correlation coecient). Each time series cross-correlated with an idealised function (e.g. velocity) was ®rst low-pass ®ltered with a cut-o equivalent to one quarter of the period of the event or half an hour whichever was the shortest. The backscat-ter intensity ®elds were then tested, over the same period, by cross-correlation with four idealised func-tions (Fig. 2b). For an event to be selected the cross-correlation coecients of the velocity and backscatter intensity ®elds with one of the representative functions was required to be greater than 0.7. Finally, the backscatter intensity variations for both radars were checked to ensure they were in anti phase with the absolute E-W velocity variation. In this way the algorithm represented as well as possible our initial de®nition of a SARAS signature. Figure 3 illustrates the Wick and Uppsala backscatter intensities and east-west
(E-W) velocity for three SARAS located by the selection algorithm and which were also selected by Freemanet al. (1992). The dotted lines depict the idealised functions employed by the selection algorithm in locating these particular events. The procedure resulted in the selection of 55 SARAS type events from the statistical data base and successfully located 9 of the 10 events presented by Freeman and co-workers. The event on day 288 (Octo-Fig. 2. aIdeal velocity variations employed as ®tting function by the
search algorithm coded to locate SARAS type events.bSeries of ideal backscatter intensity variations employed (see text for details)
Fig. 3. Three examples of the backscatter intensity and east-west velocity variations during SARAS events. Thedotted linein eachpanel
ber 15th), 1983 illustrated by Freemanet al. (1992) (their Fig. 2 panel g) was not selected by the algorithm as the backscatter intensity did not reduce during the interval and therefore did not fully meet the selection require-ments adopted in the present study.
4 Statistical characteristics of SARAS
4.1 SARAS occurrence statistics
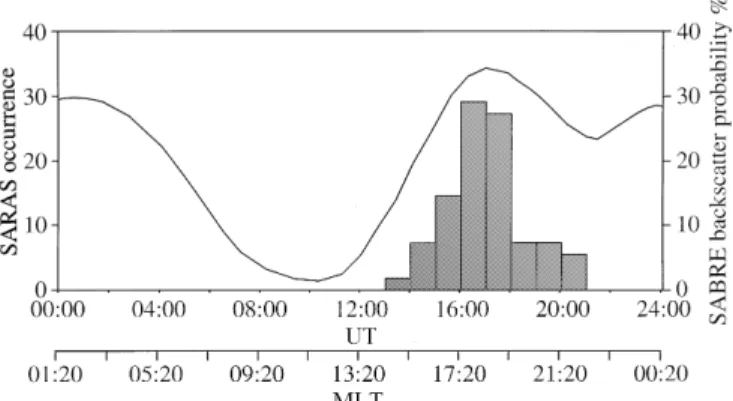
Figure 4 depicts the SARAS occurrence statistics as a function of UT and MLT as a percentage of 55 events located along with the SABRE backscatter probability determined for all KP values (Waldock et al., 1985) which is illustrated by the solid line. MLT was determined from the IGRF for the central position of SABRE ®eld of view and is UT + 1:20. The bin size employed in the calculation of the occurrence statistics was 1 h and the epoch of each SARAS is de®ned by the start time of the event determined by the selection algorithm. The results indicate a distribution of SARAS events from 1300 UT until 2100 UT, with a maximum occurrence around 1700 UT with no events observed after 2100 UT or before 1300 UT. In discussing the occurrence statistics of the SARAS features we must be careful to assess the eect of the SABRE backscatter probability (Waldock et al., 1985) on the results obtained in this study. Waldocket al. (1985) illustrated a backscatter probability of better than 20% for all KP values between1400 UT and 0300 UT, with maxima around 1800 UT and 0000 UT. However the probability of backscatter over this period increased to 30% for 3KP5 and up to a value of 50% for KP5. Figure 4 illustrates that the SARAS occurrence is not a simple re¯ection of the backscatter probability deter-mined by Waldock and co-workers as there is approx-imately the same probability of backscatter between 2100 UT and 0500 UT when no SARAS were observed as between 1300 UT and 2100 UT when all SARAS were observed.
4.2 Phase propagation of SARAS
The phase motion (propagation velocity) of the SARAS feature through the SABRE ®eld of view has been calculated by examining the combined dierences in three parameters, the estimated drift velocity magnitude deduced from the combined l.o.s velocity data and the backscatter intensity from both Wick and Uppsala, as a function of time between various positions within the SABRE ®eld of view. The calculation of the propaga-tion velocity by this method requires the assumppropaga-tion that, ®rstly, the SARAS velocity, backscatter intensity signature and spatial dimensions of an event remain constant during the passage of the signature and, secondly, that the propagation velocity through the SABRE ®eld of view is constant in both magnitude and direction. Also, employing all three parameters in the determination of the propagation velocity requires that the inter parameter relationship remains constant during the passage of the event. If the magnitude and direction of the propagation velocity are not constant, the result of this analysis will only provide an estimate of the average propagation velocity across the observation area.
A time series of one of the measured parameters (e.g. velocity) from two positions, separated in either latitude or longitude, for a SARAS event was cross-correlated with the corresponding data taken from a central point over a time interval represented by tto10 minutes,
where to is de®ned as the start epoch of the SARAS
determined by the selection algorithm. The time lag of maximum cross-correlation then de®nes the time taken for the SARAS feature to propagate to the central position from another point within the ®eld of view. The time lags for each of the three measured parameters were determined for 20 separate longitudinal and latitudinal points within the 26 ´26 grid of SABRE
data values. For a time lag to be selected for further analysis the cross-correlation coecient was required to be greater than 0.9. The resulting latitudinal and longitudinal data values from the three parameters were binned in terms of the calculated time lag with a bin width equivalent to the integration period of SABRE data (i.e. 20 s), and a weighted mean distance for each time bin calculated. The weighting was based on the cross-correlation value of each of the data points analysed. A linear regression was then performed on the time lag as a function of latitude or longitude to determine propagation velocity. Propagation velocities in the westward and southward directions are de®ned as positive. A combination of all the three available SABRE parameters was required to ensure at least six values were employed in the calculation of the mean distance for each time lag bin. The correlation coecient of the linear regression was required to be greater than 0.8 for both longitudinal and latitudinal data for the calculation of the magnitude and direction of propaga-tion. The minimum propagation velocity that may be calculated by this method is 500 m s)1. This method
successfully provided a propagation velocity and direc-tion for 42 of the 55 SARAS events.
Fig. 4. SARAS occurrence statistics along with the SABRE back-scatter intensity occurrence statistics (Waldocket al., 1985)
4.3 SARAS propagation velocity and propagation direction
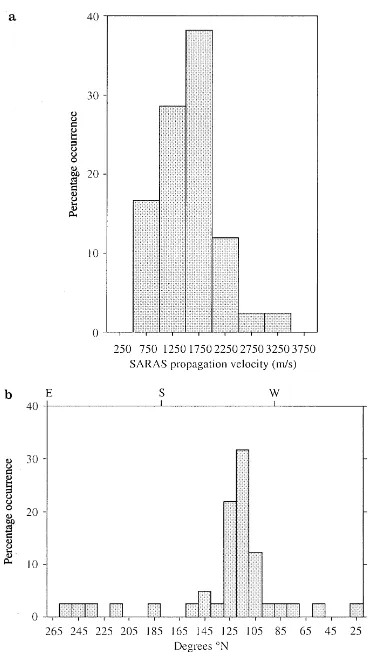
Figure 5a depicts the occurrence of events, in velocity bins of 500 m s)1, as a percentage of the 42 events of
which the propagation velocity was determined. The results demonstrate a distribution in the propagation between the minimum calculable velocity of 500 m s)1
and a velocity of 3500 m s)1, with a maximum in
occurrence centred at 1750 m s)1. Moreover less than
20% of events have a propagation velocity of greater than 2000 m s)1.
Figure 5b illustrates the direction of propagation, in bins of 10°, again as a percentage of the 42 SARAS events for which propagation velocities were deter-mined. The angle is measured anticlockwise from
geographic north. The distribution illustrates a maxi-mum percentage occurrence centred around 110°±
130°W which is representative of approximately
west-ward L-shell aligned propagation of the SARAS through the SABRE ®eld of view. However, there are 14 events which do not appear to propagate in a westward L-shell aligned direction associated with the majority of the events. Careful examination of the time lags associated with these events suggests that the estimated propagation velocity was adversely aected by some of the values employed in the linear regression.
5 A generation mechanism for SARAS
Freeman et al. (1992) noted the similarity between SARAS and two other notable convection signatures associated with substorms, namely subauroral ion drifts (SAIDs; e.g. Anderson et al., 1993, 1991) and the westward travelling surge (WTS; e.g. Akasofu et al., 1965). Freeman and co-workers discussed both these features with reference to SARAS and concluded that although they exhibited some similar characteristics, they were in fact somewhat dierent phenomena. SARAS events are predominantly observed around 1700 UT (1820 MLT) and are observed as early as 1500 MLT, and therefore unlikely to be the result of a WTS which, in general, does not reach that MLT. The head of the WTS is also associated with a region of enhanced electron density (conductivity) and reduced electric ®eld (or ¯ow velocity) (e.g. Morelli et al., 1995) in contrast to the reduction in the backscatter intensity and enhanced ¯ow velocity observed during a SARAS. SAIDs are, however, observed as early as 1600 MLT (e.g. Spiro et al., 1979) but they are typically latitudin-ally localised to <2° unlike SARAS which commonly extend over at least 5°in latitude. Despite this, and other dierences, a generation mechanism for SAIDs suggest-ed by Andersonet al. (1993) is investigated as a potential mechanism for SARAS. This model does not imply that SARAS and SAID are the same phenomenon, but it does suggest they may result from similar geophysical conditions.
The SAID generation model proposed by Anderson and co-workers is a development of a process described by Southwood and Wolf (1978). This requires the creation of a shielding or AlfveÂn layer due to the radial separation in ion and electron boundaries within the equatorial plane magnetosphere, thus forming an en-hanced outward directed radial electric ®eld. This enhanced electric ®eld maps along the magnetic ®eld lines to ionospheric altitudes to a northward oriented electric ®eld which produces a westward E´Belectron
drift component. The radial separation in the magneto-spheric ions and electrons results in a separation in their associated precipitation boundaries within the iono-sphere, with the ion precipitation boundary being located equatorward of the electron precipitation boun-dary. The magnitude of the electric ®eld was suggested by Anderson and co-workers to be inversely propor-tional to the separation of the these ion and electron Fig. 5. aDistribution of SARAS propagation velocity expressed as a
boundaries. Furthermore, the maximum ionospheric electric ®eld in the north-south direction is suggested to be co-located with the equatorward edge of the electron precipitation boundary whilst the equatorward extent of the enhanced electric ®eld is co-located with the ion precipitation boundary or region 2 currents. In the next three sections we present evidence supporting the proposal that the model could produce SARAS.
5.1 The DMSP auroral boundary
Given that the proposed mechanism involves the displacement of the equatorward electron and ion precipitation boundaries, it is important to examine the location of these boundaries with respect to the SABRE ®eld of view. Such an investigation will indicate, from purely geometrical considerations, whether the generation of SARAS is more likely in certain MLT sectors. A number of statistical models are available which represent the position of the auroral oval. These models de®ne the statistical location of the oval from either optical emissions (Feldstein, 1963; Holzworth and Meng, 1975) or measurements of the particle tion by satellites e.g. DMSP electron and ion precipita-tion models (Hardy et al. 1987, 1991 respectively) and the NOAA/TIROS oval model (e.g. Fuller-Rowell and Evans, 1987). In this discussion the statistical separation between the ion and electron precipitation boundaries is of importance and therefore, the DMSP electron and ion integral energy ¯ux models are utilised to obtain estimates of the ion and electron equatorward boundary positions and their statistical separation.
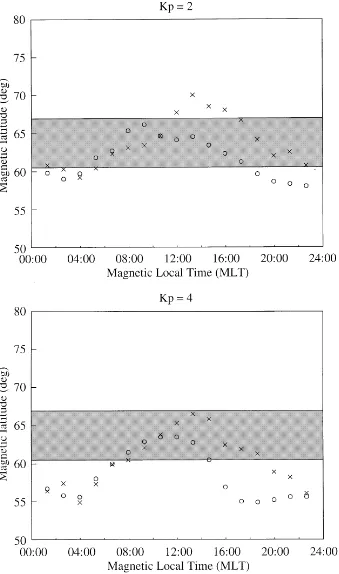
Figure 6 illustrates the statistical geomagnetic lati-tude of the ion (open circles) and electron (crosses) equatorward boundaries as a function of MLT and KP. The electron equatorward boundary is de®ned here for an energy ¯ux of 107keV (cm2s sr))1, which is
approx-imately equivalent to the 0.25 ergs (cm2s))1 employed
by Szuszczewicz et al. (1993) for the equatorward boundary of the NOAA/TIROS model in a comparison with the DMSP and Feldstein statistical models. The boundary of the diuse aurora (electron precipitation boundary) was de®ned from the DMSP electron energy ¯ux rather than the calculated Hall and Pedersen conductivities (Hardy et al., 1987) thus, providing a more consistent comparison with the DMSP ion energy ¯ux model which we employ to represent the equator-ward edge of the ion precipitation. The limit employed for the equatorward boundary of the ion precipitation is that suggested by Hardyet al. (1991) and has a value of approximately 103keV (cm2s sr))1. The upper panel of
Fig. 6 depicts the boundary locations calculated for a KPvalue of 2 and the lower panel for a KP value of 4. KPwas typically £4 when SARAS were observed. The shaded region in each panel of Fig. 6 represents the latitudinal limits of the SABRE ®eld of view (f.o.v). For KP 2 the ion boundary moves from just equatorward of the radar f.o.v at 0200 MLT to the poleward edge at 0900 MLT. Following this, the ion boundary moves equatorward across the SABRE f.o.v. The electron
boundary follows a similar pattern except that from 1200 MLT to 1600 MLT it is poleward of the f.o.v. A separation of the statistical ion and electron precipita-tion boundaries of 5° (the latitudinal extent of the
SABRE ®eld of view) in latitude is evident from
1300 MLT through until 2300 MLT. The bound-aries determined for a KPvalue of 4 (Fig. 6, lower panel) are similar to those for the KP 2 case except they have both moved approximately 5° further
equator-ward. A separation in the two boundaries of 5° is
again present from 1200 MLT through until
2000 MLT. Thus, the electron boundary is, in general, located within the SABRE viewing area during the MLT periods for which SARAS are predominantly observed and the ion boundary somewhat further equatorward, ensuring the SABRE viewing area is within the region where we might statistically expect ion and electron precipitation. The exact location of the boundaries Fig. 6.Theupper paneldepicts the DMSP ion (circles) and electron (crosses) boundaries with respect to the SABRE ®eld of view (illustrated by theshaded region) determined for a KPvalue of 2. Thelower paneldepicts the boundary locations for a KPvalue of 4. The regions in which the ion and electron boundaries substantially separate (i.e. 1200 MLT to 2000 MLT) coincides with the MLT sector in which SARAS are predominately observed
during each of the SARAS events cannot be determined without direct measurement of the boundary and/or the separation (i.e. satellite measurements of the ion and electron energy ¯ux) during the period the SARAS is observed. The statistical DMSP model results indicate that if the SARAS feature is associated with the generation mechanism suggested by Anderson et al. (1993), then from purely geometrical considerations SARAS would be expected to be observed between
1200 and 2200 MLT, which is in agreement with the SARAS occurrence statistics (Fig. 4).
The statistical latitudinal separation of the ion and electron boundaries is comparable with the extent of the SABRE ®eld of view (i.e. 5°). The SAID generation model of Andersonet al. (1993) indicates that the extent of the enhanced electric ®eld region is approximately twice that of the separation of the ion/electron precip-itation boundaries (i.e. 10°). For each of the SARAS
examined in the present study the latitudinal extent was greater than the SABRE ®eld of view. This observation is consistent with the latitudinal extent expected purely from the examination of the statistical separation of the ion and electron equatorward precipitation boundaries within the MLT SARAS are observed.
The model of Andersonet al. (1993) further predicts that when a suciently small separation is formed between the ion and electron boundaries, and thus a substantially enhanced electric ®eld is present, one result could be a reduction in the E-region Hall and Pedersen conductivities. Such a reduction is a result of the poleward transport of the ionospheric ions and, there-fore, ionospheric electrons to maintain charge neutrality (Banks and Yasuhara, 1978). With reference to SARAS in particular, the reduction in the E-region Hall and Pedersen conductivities is important. A reduction in conductivity is equivalent to a reduction in the ambient electron density and, therefore, the scattering cross section presented to the radar which ultimately results in a reduction in the radar backscatter intensity (e.g. Haldoupis et al., 1990; Shand et al., 1996). Such a reduction is one of the characteristics of a SARAS.
5.2 The generation mechanism and SARAS propagation velocity
Freeman et al. (1992) employed data from a geosyn-chronous satellite to determine the time and location of the substorm injection region with respect to the SABRE ®eld of view and SARAS observation time, and thus, a propagation velocity was calculated. Free-man and co-workers (1992) compared the calculated propagation velocities with those determined from SABRE observations, the results of which indicated the association of SARAS with substorms. It is possible that the SARAS propagation velocity may be related to the velocity of an enhanced magnetospheric ion popu-lation, which results from the substorm expansion phase, and drifts westward under curvature and gradient forces. The in¯uence of such a westward drifting, enhanced, magnetospheric ion population is consistent
with the requirement of the proposed model for SARAS of an ion precipitation boundary within the auroral ionosphere, which is separated from the electron precipitation boundary. Furthermore, it would also explain the preferential L-shell aligned propagation of SARAS determined by the present statistical study (Fig. 5b).
5.3 Dynamics Explorer (DE) ion drift observations
One further piece of evidence linking the mechanisms suggested for SAIDs and SARAS was presented in Fig. 3 of Anderson et al. (1993). This ®gure illustrates the typical signature of a SAID with substantial ion ¯ows of the order of 4 km s)1observed in the data from
the DE 2 satellite on day 315 1981, which is approxi-mately 2 h after a substorm expansion phase onset as observed in DE 1 images. However, during the previous DE 2 Northern Hemisphere pass, approximately 98 min earlier, enhanced ion ¯ows of the order of 1 km s)1were
observed with a signature not typical of a SAID (Fig. 3a of Andersonet al., 1993). The enhanced ion ¯ow region observed during the earlier pass is centred around the equatorward boundary of the optical aurora and extends over a latitude range of approximately 6°. The feature is observed some 30 min after substorm expan-sion phase and appeared to have a latitudinal extent more like a SARAS than a typical SAID (i.e. >5° in latitude rather than 1±2°). Thus, an auroral signature more reminiscent of a SARAS, at least in latitudinal extent, was observed prior to the observation of an ion ¯ow signature associated with a typical SAID. This observation adds weight to the conclusion that SARAS may be the result of a similar generation mechanism to that of a SAID observed early in its evolution and prior to the formation of the typical SAID signature. SARAS, therefore, may be formed when the separation between the ion and electron precipitation boundaries is still decreasing, and not yet reached a separation required for the formation of an SAID.
6 Summary
A statistical investigation of SARAS events has been carried out to ®rstly produce a better understanding of the feature itself and secondly to allow investigation of a possible generation mechanism for SARAS. Fifty ®ve SARAS type events were selected by a computer algorithm designed to locate SARAS events (Sect. 2.1). From these 55 events a number of statistics were obtained and these are summarised below.
1. Occurrence statistics for SARAS indicate a distribu-tion of observadistribu-tions between 1420 MLT to 2200 MLT with a maximum in the occurrence around 1800 MLT.
2. SARAS have phase propagation velocities between 500 m s)1 and 3500 m s)1, with a maximum
3. The propagation direction is typically westwards and centred about the L-shell direction.
4. The latitudinal extent of SARAS is comparable with the size of the SABRE ®eld of view.
The discussion of a possible generation mechanism for SARAS was undertaken to assess whether, in principle, it could reproduce any of the statistical results obtained for SARAS. The mechanism described re-quired the generation of an AlfveÂn layer and/or a modi®cation of the ionospheric conductivity (South-wood and Wolf, 1978; Andersonet al., 1993; Maynard, 1978). The location and separation of the related ionospheric boundaries described by the models has been investigated by employing DMSP statistical mod-els for the ion and electron precipitation boundaries. The results of this analysis suggest that from purely geometrical considerations, the location of the bound-aries and their separation with respect to the SABRE ®eld of view are in agreement with the observation that SARAS occur in the 1400 to 2200 MLT sector. A tentative association of SARAS events with a drifting magnetospheric ion population is discussed in order to describe the preferential westward L-shell aligned prop-agation of SARAS determined in the statistical results. Evidence of a convection signature observed by the DE 2 satellite more reminiscent of a SARAS in latitudinal extent is also presented. This signature is observed 98 minutes prior to that of a SAID and some 30 min after the substorm expansion phase adding weight to the suggestion that SARAS may be generated by a similar process although earlier in its evolution. The model does not describe in detail the statistical features of the SARAS signature, although, the occurrence statistics, results pertaining to the propagation velocity and direction, backscatter intensity reduction and latitudinal extent of SARAS have been discussed with reference to the generation model, and a satisfactory comparison achieved. In order to fully investigate the proposed production model, a more comprehensive study of the variation in the ionospheric convection and conductivity as a consequence of the substorm injection and the subsequent production of a shielding layer would be required. This could either be achieved by more detailed and exact measurements of all the parameters involved during the generation process over a large spatial area encompassing the SARAS/SAID events, or more likely, by extensive modelling of the magnetospheric/iono-spheric coupling system and the eects of the substorm process on ionospheric convection.
Acknowledgements. The authors would like to thank E. C. Thomas of the University of Leicester for the operation of the Wick site and the Max-Planck-Institut fuÈr Aeronomie for the operation of the Uppsala site of the SABRE radar system. B. A. Shand was supported by a studentship from the Science and Engineering Research Council, UK.
Topical Editor D. Alcayde thanks R. A. Homan for his help in evaluating this paper.
References
Akasofu, S.-I., D. S. Kimball, and Ching-I. Meng,The dynamics of the aurora-II Westward travelling surges,J. Atmos. Terr. Phys., 27,173±187, 1965.
Anderson, P. C., W. B. Hanson, and R. A. Heelis, The ionospheric signatures of rapid subauroral ion drifts,J. Geophys. Res.,96, 5785±5792, 1991.
Anderson, P. C., W. B. Hanson, R. A. Heelis, J. D. Craven, D. N. Baker, and L. A. Frank,A proposed production model of rapid subauroral ion drifts and their relationship to substorm evolution,J. Geophys. Res.,98,6069±6078, 1993.
Banks, P. M., and F. Yasuhara,Electric ®elds and conductivity in the nighttime E-region: a new magnetosphere-ionosphere-atmosphere coupling eect,Geophys. Res. Lett.,5,1047±1050, 1978.
Feldstein, Y. I., Some problems concerning the morphology of auroras and magnetic disturbances at high latitudes, Geomag. Aeron.,3,183±192, 1963.
Fejer, B. G., and M. C. Kelly, Ionospheric irregularities, Rev. Geophys. Space Phys.18,401±454, 1980.
Fejer, B. G., and J. F. Providakes, High latitude E-region irregularities: new results,Phys. Scripta,T18,167±178, 1987. Freeman, M. P., D. J. Southwood, M. Lester, T. K. Yeoman, and G.
D. Reeves, Substorm-associated radar auroral surges,J. Geo-phys. Res.,97,12173±12185, 1992.
Fuller-Rowell, T. J., and D. S. Evans,Height-integrated Pedersen and Hall conductivity patterns inferred from the NOAA/ TIROS satellite data,J. Geophys. Res.,92,7606±7618, 1987. Haldoupis, C., E. Nielsen, and K. Schlegel, Dependence of radar
scattering cross section of the ambient electron density and the destabilizing electric ®eld, Annales Geophysicae, 8, 195±212, 1990.
Hardy, D. A., M. S. Gussenhoven, R. Raistrick, and W. J. McNeil, Statistical and functional representation of the pattern of auroral energy ¯ux, number ¯ux, and conductivity,J. Geophys. Res.,92,12275±12294, 1987.
Hardy, D. A., W. McNeil, M. S. Gussenhoven, and D. Brautigam,A statistical model of auroral ion precipitation 2. Functional representation of the average patterns, J. Geophys. Res., 96, 5539±5547, 1991.
Holzworth, R. H. and C. -I. Meng,Mathematical representation of the auroral oval,Geophys. Res. Lett.,2,377±380, 1975. Maynard, N. C.,On large poleward-directed electric ®elds at
sub-auroral latitudes,Geophys. Res. Lett.,5,617±618, 1978. Morelli, J. P., R. J. Bunting, S. W. H. Cowley, C. J. Farrugia, M.
P. Freeman, E. Friis-Christensen, G. O. L. Jones, M. Lester, R. V. Lewis, H. LuÈhr, D. Orr, M. Pinnock, G. D. Reeves, P. J. S. Williams, and T. K. Yeoman, Radar observations of auroral zone ¯ows during a multiple-onset substorm,Annales Geophys-icae,13,1144±1163, 1995.
Nielsen, E., and K. Schlegel, Coherent radar doppler measurements and their relationship to the ionospheric electron drift velocity,
J. Geophys. Res.,90,3498±4003, 1985.
Nielsen, E., W. Guttler, E. C. Thomas, C. P. Stewart, T. B. Jones, and A. Hedburg, SABRE-a new radar auroral backscatter experiment.Nature,304,712, 1983a.
Nielsen E., J. D. Whitehead, L. A. Hedburg and T. B. Jones,A test of the cosine relationship using three-radar velocity measure-ments,Radio Sci.,18,55±59, 1983b.
Robinson, T. R.,Simulation of convection ¯ow estimation errors in VHF bistatic auroral radar systems,Annales Geophysicae, 11, 1033±1050, 1993.
Shand, B. A., M. Lester and T. K. Yeoman, The relationship between VHF radar auroral backscatter amplitude and Doppler velocity: a statistical study,Annales Geophysicae, 14,803±810, 1996.
Southwood, D. J., and R. A. Wolf,An assessment of the role of precipitation in magnetospheric convection,J. Geophys. Res., 83, 5227±5232, 1978.
Spiro,R. W., R. A. Heelis, and W. B. Hanson,Rapid subauroral ion drifts observed by Atomosphere Explorer C,Geophys. Res. Lett.,6, 657±660, 1979.
Szuszczewicz, E. P., P. Wilkinson, W. Swider, S. Pulinets, M. A. Abdu, E. Roelof, T. Fuller-Rowell, D. S. Evans, T. Bateman, P. Blanchard, G. Gustafsson, R. Hanbaba, J. Joselyn, T. Kikuchi, R. Leitinger, M. Lester, B. Reddy, M. Ruohoniemi, M. Sands, J.
Sobral, G. O. Walker, and V. Wickwar, Measurements and empirical comparisons of F-region characteristics and auroral oval boundaries during the solstitial SUNDIAL campaign of 1987,Annales Geophysicae,11,601±613, 1993.