Phosphorylation Using High-Throughput In-Cell Western
Assays: Comparison to Western Immunoblots
Hector N. Aguilar1, Barbara Zielnik2, Curtis N. Tracey1, Bryan F. Mitchell1,2*
1Department of Physiology, Faculty of Medicine and Dentistry, University of Alberta, Edmonton, Alberta, Canada,2Department of Obstetrics and Gynecology, Faculty of Medicine and Dentistry, University of Alberta, Edmonton, Alberta, Canada
Abstract
Background: Quantification of phospho-proteins (PPs) is crucial when studying cellular signaling pathways. Western immunoblotting (WB) is commonly used for the measurement of relative levels of signaling intermediates in experimental samples. However, WB is in general a labour-intensive and low-throughput technique. Because of variability in protein yield and phospho-signal preservation during protein harvesting, and potential loss of antigen during protein transfer, WB provides only semi-quantitative data. By comparison, the ‘‘in-cell western’’ (ICW) technique has high-throughput capacity and requires less extensive sample preparation. Thus, we compared the ICW technique to WB for measuring phosphorylated myosin regulatory light chain (PMLC20) in primary cultures of uterine myocytes to assess their relative specificity, sensitivity,
precision, and quantification of biologically relevant responses.
Methodology/Principal Findings:ICWs are cell-based microplate assays for quantification of protein targets in their cellular context. ICWs utilize a two-channel infrared (IR) scanner (OdysseyH) to quantify signals arising from near-infrared (NIR) fluorophores conjugated to secondary antibodies. One channel is dedicated to measuring the protein of interest and the second is used for data normalization of the signal in each well of the microplate. Using uterine myocytes, we assessed oxytocin (OT)-stimulated MLC20phosphorylation measured by ICW and WB, both using NIR fluorescence. ICW and WB data
were comparable regarding signal linearity, signal specificity, and time course of phosphorylation response to OT.
Conclusion/Significance: ICW and WB yield comparable biological data. The advantages of ICW over WB are its high-throughput capacity, improved precision, and reduced sample preparation requirements. ICW might provide better sensitivity and precision with low-quantity samples or for protocols requiring large numbers of samples. These features make the ICW technique an excellent tool for the study of phosphorylation endpoints. However, the drawbacks of ICW include the need for a cell culture format and the lack of utility where protein purification, concentration or stoichiometric analyses are required.
Citation:Aguilar HN, Zielnik B, Tracey CN, Mitchell BF (2010) Quantification of Rapid Myosin Regulatory Light Chain Phosphorylation Using High-Throughput In-Cell Western Assays: Comparison to Western Immunoblots. PLoS ONE 5(4): e9965. doi:10.1371/journal.pone.0009965
Editor:Alejandro Lucia, Universidad Europea de Madrid, Spain
ReceivedOctober 26, 2009;AcceptedFebruary 18, 2010;PublishedApril 1, 2010
Copyright:ß2010 Aguilar et al. This is an open-access article distributed under the terms of the Creative Commons Attribution License, which permits unrestricted use, distribution, and reproduction in any medium, provided the original author and source are credited.
Funding:The authors are grateful to the Canadian Institutes of Health Research (#MOP 81384, http://www.cihr-irsc.gc.ca/e/) and the Alberta Heritage Foundation for Medical Research (http://www.ahfmr.ab.ca/) for their financial support. The funders had no role in study design, data collection and analysis, decision to publish, or preparation of the manuscript.
Competing Interests:The authors have declared that no competing interests exist. * E-mail: [email protected]
Introduction
Western immunoblotting (WB) is widely utilized to study relative levels of signaling intermediates including a variety of phospho-proteins (PPs). The increasing availability of antibodies for specific PPs has enhanced the popularity of this relatively inexpensive technique. Recently, there has been increasing use of near-infrared (NIR) fluorophore–conjugated antibodies for the WB technique. Compared to chemiluminescent antigen detection, NIR fluorophores extended the linear range of detection and potentially improve WB sensitivity. [1,2] These two properties improve quantification of highly abundant or relatively scarce proteins in cell lysates. Currently available NIR scanners (OdysseyH) for this purpose have two separate channels. This enables simultaneous detection of two different proteins, providing
[actin, glyceraldehyde-3-phosphate-dehydrogenase [GAPDH], etc.], or total cell content) into one of the two detection channels. ICWs eliminate the need for protein harvesting, lysate preparation, electrophoretic separation and electrophoretic transfer steps. However, due to the absence of a protein separation step, ICWs require that primary antibodies be highly specific for the POIs in the context of microscopy. Currently, only a few reports contain data produced by ICWs, and none of these include thorough validations of the ICW technique beyond evaluating antibody specificity using WB. [5,6,7,8,9] In this work, we attempted a more thorough technical evaluation of ICWs using NIR fluorescence-based WBs as a reference standard, thus eliminating the signal detection methodology as a confounding factor in comparing the two techniques. Further, we evaluated the ability of both techniques to measure a phosphorylation event in response to a physiological stimulus. Our endpoint of choice was the phosphor-ylation of myosin regulatory light chain (MLC20) in cultured
human uterine myocytes. Phosphorylation of MLC20 at Ser19in
smooth muscle cells is a well characterized event that permits the myosin(II)-actin cross-bridging and is the hallmark biochemical event leading to tissue-level force production. We therefore monitored phospho(Ser19)-MLC20(PMLC20) formation in cultured
uterine myocytes stimulated with oxytocin (OT), the most potent biological stimulant for this cell type.
This work addressed two specific aims: 1) to assess and compare the linearity, specificity and precision of signals measurable by WB and ICW, and 2) to evaluate the ability of ICWs to yield comparable data to WB regarding concentration- and time-dependency of physiological phosphorylation events. Our broader goal was to determine the suitability of ICW as a technique that may be substituted for WB in signaling studies, particularly for high-throughput experimental protocols.
Results
Signal Linearity and Specificity for WB and ICW
We assessed the linearity of both phosphorylated (PMLC20) and
non-phosphorylated (GAPDH, total MLC20) signals via WBs
prepared using 2-fold serial dilutions of uterine myocyte lysates starting at 50mg total protein/lane. Preliminary experiments measuring GAPDH reached a lower limit of 0.19mg protein/lane and showed that WB could not discriminate between protein loads
#1.6mg/lane. Therefore 1.6mg/lane was selected as the lowest
load for subsequent experiments. Of four replicate membranes prepared simultaneously to measure GAPDH, three of these revealed a good ability to discriminate antigen signal intensities. However, the signals from the fourth membrane could not discriminate bands in lanes loaded with less than 12.5mg protein/
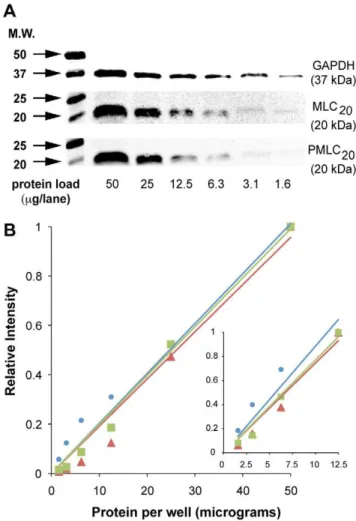
well. The data from representative membranes for signals from GAPDH, PMLC20and total MLC20ranging from 50 to 1.6mg/
lane are shown in Figure 1. Though all three proteins may be quantified above 50mg protein/lane (lane 1) in our experience, loading Tris-Glycine minigels with greater protein loads may decrease band resolution. The high correlation coefficients over this range for GAPDH, total MLC20, and PMLC20(0.97, 0.99, 0.97,
respectively: Figure 1B) support the conclusion that this technique can detect changes in specific protein concentrations. Even when the analysis is restricted to protein applications less than#12.5mg/ lane (Figure 1B inset), the correlation coefficients remain high for GAPDH (0.87) total MLC20(0.98) and PMLC20(0.96).
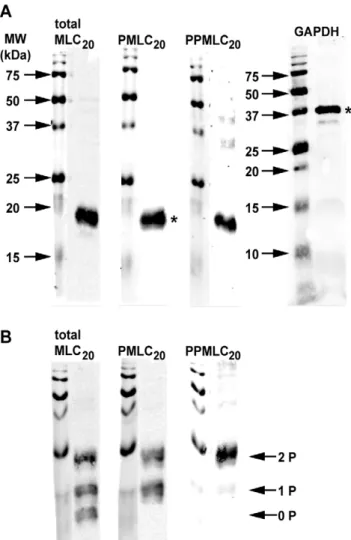
The specificity of the antibodies was assessed in Figure 2. The full length WB demonstrates the expected prominent bands relative to the molecular weight (MW) marker for each of the proteins (Figure 2A). Though bands of different sizes are detectable at several
other positions, their relative intensities compared to the predom-inant bands are considered quantitatively insignificant (,5% signal relative to the band of interest). Probing with anti-GAPDH and anti-PMLC20 antibodies simultaneously (as performed for
subse-quent concentration- and time-response experiments) revealed two clear and prominent bands at the correct MWs (not shown). Introduction of 30mM phos-tag into the polyacrylamide matrix markedly enhances separation of phosphorylated proteins by retarding their movement. [10] Our data (Figure 2B) demonstrate that the anti-PMLC20antibody recognizes only the phosphorylated
(mono- and di-) MLC20species, in contrast to the anti-total MLC20
antibody, which reveals the unphosphorylated form as well as the mono- and diphospho-MLC20(PPMLC20). For reference, the
anti-PPMLC20antibody identifies only the uppermost band in these last
three panels, which corresponds to PPMLC20. These results
confirm those in a previous study and indicate the highly specific nature of these antibodies. [11]
Figure 1. Signal linearity with western blots. A.Tris-Glycine-SDS
gels were loaded with total uterine myocyte lysate (2-fold dilutions from 50mg to 1.6mg). GAPDH, total MLC20, and phospho(Ser19)-MLC20 (Pphospho(Ser19)-MLC20) were detectable with 1.6mg total protein/lane.B. Quantification of bands shown in panel A. Normalized values are expressed as a fraction of the band intensity measured at 50mg/lane. Fit of a linear model through the origin showed excellent correlation for all three proteins (GAPDH:
N
; MLC20:&; PMLC20:m). The inset graph illustrates the correlation coefficient when only the lanes with#12.5mg protein are analyzed. Molecular weight markers (MW) are shown at the left.We assessed the linearity between signal intensity and cell number for ICWs using the antibody to PMLC20, and two
normalization references (Figure 3). The first normalization reference used an antibody toward GAPDH. The second utilized a combination of two cell dyes (DRAQ5 [12] and Sapphire700, referred to as ‘‘cell dyes’’ in this manuscript) that provide an estimate of the cell content of the well and is detected in a separate channel of the IR scanner. Uterine myocytes were seeded into 96-well plates (15 mm2/well) from 750 cells/well through to 15,000 cells/well, resulting in adherent monolayers corresponding to cell densities of 0, 50, 100, 200, 300, 400, 500, 600, 700, 800, 900, and 1000 cells/mm2 (Figure 3A). Signals were detectable
above background readings (empty wells) down to 750 cells/well. It was apparent that the relationship between cell numbers and concentrations of PMLC20 and GAPDH (Figure 3B) was
plateauing at cell numbers beyond 10,500/well (700 cells/mm2). Using only the cells with equal to or less than cell density 700 cells/mm2(inset), the correlation coefficients to a linear model for both GAPDH (0.99) and PMLC20 (0.96) were very high,
supporting the conclusion that this assay has precision to measure changes in protein concentrations with optimal performance using 1,000–10,500 cells/well, which corresponds to 0.3 to 4mg protein/well, based on average lysate yields for this cell type. Further, these data suggest that ICWs exhibit improved sensitivity compared to WB as we reliably measured GAPDH in ICWs below the lower limit of signal discrimination (1.6mg/lane) by WB.
Figure 2. Antibody specificity using western blots. A.Full length
western blots with single lanes loaded with 25mg of protein/lane demonstrating the relevant bands (*) used for quantification in other experiments. Antibodies against GAPDH, total MLC20, PMLC20 and diphospho-MLC20 (PPMLC20) each identified one prominent band, though faint ‘‘non-specific’’ bands appeared with the anti-GAPDH and anti-PPMLC20antibodies.B.Western blots performed as in panel A but with the addition of phos-tag (30mM) to the gel matrix to promote mobility shifts in phosphorylated proteins. Probing for total MLC20 reveals 3 bands corresponding to unphosphorylated (0 P), mono-phosphorylated (1 P), and dimono-phosphorylated (2 P) MLC20. The anti-PMLC20antibody reacts with mono- and diphosphorylated MLC20and fails to recognize the unphosphorylated species. The anti-PPMLC20 antibody recognizes primarily diphosphorylated MLC20 and demon-strates almost no cross-reactivity with the unphosphorylated or mono-phosphorylated MLC20. Molecular weight markers (MW) are shown to the left of each blot.
doi:10.1371/journal.pone.0009965.g002
Figure 3. Signal linearity with the in-cell western assay. A.
96-well microplates were loaded with an increasing number of cells/96-well. Signals from anti-GAPDH and anti-PMLC20antibodies appear as green fluorophores. Signals from cell dyes (cell number normalization) appear as red fluorophores.B. Quantification of signals shown in panel A. Normalized values are expressed as a fraction of the signal intensity of the wells containing 15,000 cells for GAPDH (
N
), PMLC20(m). The signal from the cell dyes also is shown (&). The GAPDH and PMLC20signals appear to plateau at the higher cell densities so the line of best fit has been calculated and illustrated by expressing the normalized values as a fraction of the intensity of the wells containing 10,500 cells (inset) for GAPDH (N
), and PMLC20(m).To evaluate antibody signal specificity for GAPDH, total MLC and PMLC20 in the ICW, we visualized the signals using
immunofluorescence microscopy (Figure 4). Slides for microscopy were prepared identically to ICW plates (see methods) to ensure that the microscopic visualizations were directly comparable to ICW measurements. The only difference in protocols was the use of secondary antibodies conjugated to Alexa-Fluor 488 for primary antibody detection for microscopy. Each slide was also stained with rhodamine-phalloidin to demonstrate filamentous actin (F-actin). In the absence of primary antibodies, there is no appreciable signal (Figure 4A panels i and ii). Using the antibody to GAPDH, there is diffuse cytosolic staining, in marked contrast to the filamentous appearance of F-actin (Figure 4A panels iii and iv). For total MLC20 (Figure 4A panels v and vi) the staining
pattern is similar to F-actin (and in contrast to GAPDH), in keeping with the molecular co-localization of these elements of the contractile apparatus. There is no appreciable signal after pre-adsorption of the PMLC20 antibody with a specific blocking
peptide containing phospho-Ser19of MLC20either in the resting
state (Figure 4B panels i and ii) or after stimulation with 100 nM OT (panels iii and iv). Similarly, in our preliminary ICWs, the signal from resting and stimulated cells was reduced to background levels when the antibody toward PMLC20was preadsorbed with
the same blocking peptide. In the absence of the blocking peptide, there is only a faint signal in resting cells (Figure 4B panels v and vi) but this signal is rapidly inducible (20-second stimulation) in response to OT. The subcellular distribution for PMLC20 is
identical to that of total MLC20and F-actin (panels Avi, Bvii).
Assay Precision for WB and ICW
To assess assay precision, we studied the intra-assay and inter-assay variability of each technique for GAPDH and PMLC20. We
also evaluated the variability of normalization of PMLC20 to a
‘‘housekeeping’’ protein such as GAPDH and compared this to normalization using the cell dye markers in the ICW technique. For WB, two SDS-PAGE mini-gels were loaded with 13 replicates of 20mg of protein/lane from the same lysate. The resultant blots (Figure 5A) were prepared simultaneously from the same electrophoresis and transfer tanks. By using secondary antibodies with distinct fluorophores, both proteins were assessed on each blot. The intra-assay variability in signal intensity across the lanes for GAPDH and PMLC20is presented in Figure 5B. The
intra-assay coefficients of variation (CV) for GAPDH and PMLC20were
0.21 and 0.20 in blot 1, respectively, and 0.16 and for both proteins in blot 2. Blot 1 particularly emphasizes that the pattern of signal variation across the lanes was not similar for the two proteins. Hence, when the ratio of one protein to the other was
Figure 4. Antibody specificity using the in-cell western assay.In
each pair of micrographs, the left panel illustrates filamentous actin (F-actin) stained with rhodamine-phalloidin (red). The corresponding right
panels are immunofluorescence micrographs stained with antibodies conjugated to Alexa-Fluor 488 (green). Nuclei are stained with DAPI (blue) in all panels. Images are shown at 4006and 2006magnification
in panels A and B, respectively. White bars represent 25 and 50 microns, respectively.A.Demonstration of GAPDH and total MLC20. Panels i and ii. The actin fibers stain in a filamentous pattern typical of uterine smooth muscle. There is no detectable signal with omission of the primary antibodies. Panels iii and iv. The GAPDH staining shows a diffuse cytosolic pattern in contrast to the fibrillar pattern of actin. Panels v and vi. Total MLC has a similar staining pattern to actin.B.
Demonstration of PMLC20. Panels i–iv. There is no detectable background fluorescence when the antibody has been preadsorbed with blocking peptide (BP) containing phospho-Ser19of MLC
20, either in the resting state (panel ii) or with stimulation using 100 nM OT (20 sec stimulus, panel iv). Only a small amount of PMLC20is detectable in the resting myocyte (panel vi) but this is markedly increased upon stimulation with OT (100 nM, 20 sec: panel viii).
calculated, the CV (0.27: Figure 5B ratio) was magnified. To determine the intra-assay CV for the ICW technique, 30 wells in each of two plates were prepared simultaneously and probed for PMLC20or GAPDH. The CV for signals obtained for PMLC20
(Plate 1), and GAPDH (Plate 2) were 0.10 and 0.07. The CV for the cell dye estimate of cell content for plates 1 and 2 were 0.05 and 0.15, respectively. When the concentrations of PMLC20 or
GAPDH were normalized to the cell dyes, the CV varied from 0.08 to 0.16. In summary, the intra-assay CVs for measurement of PMLC20and GAPDH alone are comparable between ICW and
WB but the ICW technique may have a slight advantage regarding the precision of the normalized data.
The inter-assay CVs were calculated from repeated measure-ment of the same samples at different times using different blots for WB or on several different plates for ICW. The inter-assay CV with the ICW technique was 0.08 for PMLC20 and 0.15 for the
ratio of PMLC20to the cell dyes. For the WB technique, the
inter-assay CV was 0.16 for PMLC20and 0.25 for the ratio PMLC20to
GAPDH.
Measurement of Myosin Light Chain Phosphorylation in Response to a Physiological Stimulus
ICWs were used to measure the effects of cell density, time course and concentration-responses for OT–induced PMLC20
formation. Visual inspection of myocyte cultures seeded at various densities revealed that they were nearing confluence in the range between 500–700 cells/mm2 (not shown). Subsequent experi-ments were aimed at determining the optimal cell density and time course for OT-induced PMLC20 formation. Stimulation with
increasing concentrations and incubation times of OT for cell densities of 500, 550, 600, and 650 cells/mm2demonstrated that the largest amplitude concentration-dependent rise in PMLC20
inducible by OT is achieved at a cell density of 600 cells/mm2 after treatment for 20 seconds (Figure 6). At a density of 650 cells/
Figure 5. Assessment of intra-assay variability in western blots
and ICW assays. A. WB membranes showing GAPDH and PMLC20
levels in 13 replicate samples in two western blots.B.In the panels on the left are the individual band intensities from WBs in A expressed as a proportion of the mean of the thirteen samples in each of the two blots. The data from blot 1 are shown in blue and from blot 2 in red. The data are provided for GAPDH and PMLC20 individually and for the ratio GAPDH/PMLC20. In the panels on the right are the intensities of the signals from wells distributed across ICW plates plotted as a proportion of the mean values for each of two plates (plate one in blue and plate 2 in red). The data are provided individually for GAPDH, PMLC20, and in the lowermost panel for the cell dyes used in data normalization. The ratios of GAPDH and PMLC20to the cell dyes are also shown in red and blue, respectively.
doi:10.1371/journal.pone.0009965.g005
Figure 6. Cell density optimization for the in-cell western
assay. Uterine myocytes were seeded at densities of 500 (darkest
histogram in each grouping), 550, 600 and 650 (lightest histogram in each grouping) cells/mm2. Cells were treated with increasing concen-trations of OT (10210
to 1027
M) for 20, 30, 45 or 60 seconds or 2 or 5 minutes (n = 4 at each time point at each concentration of OT). Concentrations of PMLC20were measured using the ICW assay. PMLC20 levels rose rapidly (20 sec), decayed significantly by 1 min, and returned to baseline levels by 5 min. The largest amplitude concentration-dependent change in PMLC20 levels was measured at 20 sec and 600 cells/mm2.
mm2and at time points beyond 20 seconds for all densities tested, the response to OT was diminished.
We next determined the time course of the concentration-response relationships of OT stimulation of uterine myocytes (at 600 cells/mm2) with respect to PMLC20 concentrations by WB
and ICW under identical conditions (Figure 7). Using the ICW technique, a brisk response is measurable as early as 20 seconds after stimulation, then decays significantly by 1 min and returns to baseline levels by 5 min (Figure 7A). Qualitatively, the responses obtained by WB were similar with increases in PMLC20formation
acutely (,1 min) and decay of PMLC20beyond 1 min. However,
there were differences between the techniques with respect to quantitative data. In the first WB experiments, wet-ice cooled PBS and a lysis buffer containing phosphatase and protease inhibitors (see methods) was used to extract the protein. The maximal response to OT was measured at 171626% of control values (Figure 7B) compared to the 329637% using the ICW technique (Figure 7A). Since the PBS/lysis buffer is a rather mild extraction technique, we repeated the experiments using the more stringent dry-ice-cooled TCA/Acetone/DTT extraction method. This enhanced the maximal response to OT to 321620% (Figure 7C) but the variability about the measurements appeared greater than with the ICW technique. In summary, the ICW and WB techniques yielded similar patterns of biological data with a suggestion that the ICW might have superior precision.
Physiological Validation of Myosin Light Chain Phosphorylation Measured by In-Cell Western Assays
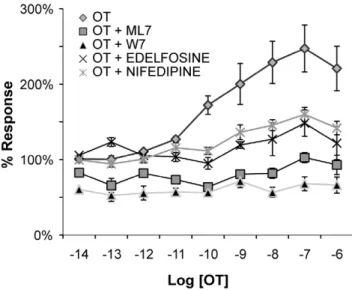
To reinforce the physiological validity of the responses measured by ICW, we performed experiments in the presence or absence of pharmacologic inhibitors known to perturb the biochemical pathways mediating phosphorylation of MLC20.
Uterine myocytes were seeded at 600 cells/mm2 and stimulated with OT (100 nM, 20 sec). Inhibition of MLC20Kinase (MLCK)
(ML7, 50mM), calmodulin (CaM) antagonism (W7, 50mM),
inhibition of phosphatidyl-inositol-specific phospholipase C (PLC) (edelfosine, 20mM), and inhibition of plasma membrane calcium (Ca2+)-channels (nifedipine, 20
mM) significantly attenuated the
OT-induced rise in PMLC20, as assessed by two-way ANOVA
(p,0.0001, Figure 8). These results indicate that the phosphor-ylation of MLC20 measured by ICW behaves as expected in
accordance with current knowledge of the biochemical pathways mediating physiological PMLC20responses in smooth muscle cells.
[13,14]
Discussion
Protein phosphorylation is the most commonly studied post-translational modification due to its central role in regulating cellular physiology. PP levels are dynamically regulated in
Figure 7. Comparison between WB and ICW for cell responses
to OT.For each of the figures, the top panel (i) presents the raw data
and the lower panel (ii) presents a graphical analysis of the normalized and quantified data (n = 2–4 for each histogram). For the ICW data,
PMLC20concentrations were normalized using the cell dyes and with the WB data, PMLC20 values were normalized to GAPDH. The normalized data are expressed as a percentage of the vehicle (V) controls.A.Data from the ICW assay. Background wells (B) had no primary antibody or cell dyes. Cells were plated at a density of 600 cells/ mm2and treated with vehicle or increasing concentrations of OT (10210 to 1027M). The time course varied from 20 sec (darkest histogram in each grouping) through 30, 45 and 60 sec or 2, 5 or 10 minutes (lightest histogram in each grouping).B.The treatment and time protocols were similar to figure 7A. The protein was extracted under mild (cold PBS/ Lysis Buffer) conditions and the proteins measured using western blots as indicated.C. Experimental protocol similar to B except that the protein extraction was performed using the more stringent (TCA/ Acetone/DTT) conditions.
response to a plethora of biological stimuli mediated by the opposing activities of protein kinases and phosphatases. [15] These enzymes encode external and internal signals through the complement of PPs that are produced in the cell interior. Using experimental manipulations rooted in knowledge of signaling pathways, scientists can decipher the role of phosphorylated intermediates in cellular responses provided they are quantifiable. The increasing commercial availability of PP-specific antibodies has enhanced the use of WB as a standard method for this purpose.
The WB technique is a relatively labour-intensive and technically demanding assay best suited for experimental ap-proaches that require low-throughput measurements. Our data demonstrate that the ICW technique provides signal linearity and specificity at least equal to WB. The ICW technique also provides biological response amplitudes similar to those attainable by the very robust protein collection method using dry-ice cooled TCA/ Acetone/DTT, demonstrating that formalin fixation is a useful and robust method for PP signal preservation. PMLC20 has
similarly been preserved and quantified reliably after cell fixation in other reports. [16] The ICW and WB techniques are qualitatively similar in terms of the concentration range of measurable stimulation (100 pM to 100 nM) and the time course for the rise and decay of the PMLC20. Both techniques were
capable of measuring PMLC20 formation as early as 20 seconds
post-stimulus. This rapid induction of PMLC20agrees with other
OT-response data in the literature. [17,18] The diminished responses measured by WB using the relatively mild cold PBS/ cold lysis buffer method could result from phospho-signal loss during cell lysis and harvesting, since the time necessary to
complete these steps exceeds the optimal treatment length (20 sec) for a maximal response in contrast to the nearly instantaneous quenching achievable by TCA/Acetone/DTT and formalin fixation. Because we have prepared both WBs and ICWs with identical blocking and antibody incubation solutions, it is unlikely that the diminished phospho-signal measured from cold PBS/cold lysis buffer samples by WB is explained by residual phosphatase activity present in the incubation buffers. [19]
The WB technique is considered by many to be a ‘‘semi-quantitative’’ assay because of the relative lack of precision of the measurements. Variability may arise from the protein extraction method employed or from application of the protein to the gel. Perhaps most problematic is the transfer of the separated proteins to the blotting membrane. Uneven distribution of proteins across blotting membranes may occur since protein movement out of the polyacrylamide gel matrix occurs at unequal rates and to different extents as influenced by protein MW and solubility in the transfer buffer. [3,4,20,21,22] In particular, transfer conditions optimized for smaller proteins may not be efficient for larger proteins, and vice-versa. [3,23] In addition, the choice of membrane, blocking and antibody solutions, and wash buffers may influence the amounts of protein retained on the membranes before antibody probing. [24,25] These factors introduce considerable inter-assay variability, limiting the precision of the technique and ultimately complicate protein quantification via WB.
The potentially improved precision of ICW compared to WBs might be attributable to minimizing sample handling through elimination of protein extraction, electrophoresis, and protein transfer steps. Use of a calibrated digital multichannel pipette further reduces assay variability by allowing rapid treatment and quenching of many samples nearly simultaneously. In addition, the ability to take duplicate or higher number replicate measurements may further enhance precision. Though replicate measurements are feasible in the setting of WB, this is an uncommon, but perhaps advisable, practice. [26] Further, our data demonstrate that WBs may have significant lane-to-lane variability in protein transfer evidenced by inconsistencies in protein signals within and between membranes. This variability is inconsistent between two protein signals (PMLC20, GAPDH) and this has the potential to magnify
the variability when the measurements of one protein are normalized to that of another protein. By comparison, with the ICW technique, the normalization of a protein to the cell content of the well using a combination of cell dyes appeared to give more precise normalization data (Figure 7).
In our evaluation of acute phosphorylation responses, data normalization was straightforward since protein levels were constant. However, where experiments concern longer treatment courses, it may be prudent to avoid data normalization to that of a reference protein and instead opt to use the cell dyes to avoid inaccurate interpretation of results due to changing reference protein levels. The potential for wavering levels of reference proteins has prompted others to suggest alternatives for data normalization in WBs. [26]
In the absence of purified antigen, it is impossible to obtain valid assessments of the sensitivity of assays such as WB or ICW. However, our data suggest that the ICW technique yields a precise measure of antigens down to 0.3mg protein/well. As noted in
Figure 3B, there is a high correlation with the linear plot down to 0.3mg protein/well for all three proteins. This is in contrast to WB where the lower limit of signal discrimination for band intensities for GAPDH was 1.6mg protein/lane. As GAPDH was the most
intense signal measurable in our WB experiments, it is unlikely that PMLC20 or total MLC20 would be quantifiable below this
level.
Figure 8. Assessment using the ICW technique of
pharmaco-logical manipulation of PMLC20.Uterine myocytes were seeded in
microplate wells at 600 cells/mm2and treated with OT (from 10214to 1026M) for 20 sec in the presence or absence of 15-minute pre-incubation with specific pharmacological agents (n = 7 separate cultures). The normalized data are expressed as a percentage of the vehicle controls. As expected, the cells demonstrated a brisk response to OT that was diminished in the presence of an inhibitor of MLCK (ML-7, 50mM), CaM (W7, 50mM), phosphatidyl inositol-PLC (Edelfosine, 20mM), and L-type Ca2+channels (Nifedipine, 20mM). Relative PMLC20 levels (normalized to cell content) are expressed as a percentage of vehicle control. All of the pharmacological agents significantly (p,0.0001) attenuated the concentration-dependent PMLC20increase induced by OT as determined by two-factor ANOVA.
As with WB, specificity of the antibody is of paramount importance in the ICW technique. It has been suggested that the antibodies proposed for evaluation of protein antigens in fixed cells should be tested for signal intensity and specificity by WB. [27] Reliance on WB for evaluation of antibody specificity (or rather, the level of non-specificity) for what is essentially a microscopy application in ICW, presupposes that the proteome is represented identically in both techniques. However, antigen preparation is achieved using different methods for WB (reduction and linearization with DTT or 2-mercaptoethanol, and SDS) and microscopy (organic denaturation and fixation by cross-linkages). Therefore, the complement of cellular antigens is presented to the antibody in a different configuration. Hence, validation of antibody specificity for ICW using WB may prove most useful where the antibody recognizes a continuous epitope that is fully unmasked during fixation. Whether the antibody will interact with epitopes in partially denatured proteins cannot be addressed by this approach. Logically then, WB data are less appropriate for validation of antibodies raised against discontinuous epitopes encompassing amino acid residues in close proximity on the surface of a protein but separated in space in the linear amino acid sequence. This may be a more significant consideration for antibodies raised against short peptides (both mono- and polyclonal), in contrast to those (polyclonals) raised against various parts of the immunizing protein. [23,28] One potentially less significant consideration here is that the proteome is unlikely to be represented in its entirety on a WB membrane since the gel polyacrylamide content (gel percentage) is selected so as to optimize resolution of the POI from other cellular proteins. This may result in exclusion of low MW proteins on the resultant WB if a low percentage gel is used, and may under-represent the complement of large MW proteins if a high gel percentage is selected due to their restricted mobility out of the gel during protein transfer. Thus, if one insists on WB validation of ICW antibodies, it may be useful to employ gradient gels to resolve a large MW range for this purpose. In any case, it is important to demonstrate that the antibody will detect the POI using microscopic techniques with appropriate negative controls to rule out non-specific signals. This is particularly crucial since ICWs lack the ability to separate protein signals in space as is done in WBs via SDS-PAGE.
The biggest advantages of the ICW assay compared to WB are the diminished preparation time and resource utilization as well as the potential for development of high-throughput assays with the capability to scan multiple microplates simultaneously. We also believe that the relatively small amount of cellular material in each well allows rapid quenching of treatments and preservation of the cell-interior by simple addition of fixing solution. This more uniform and exact termination of experimental treatments likely provides more precise information regarding dynamic reactions that occur in rapid time courses, exemplified by many phosphor-ylation reactions.
A principal prerequisite for performing ICWs is the availability of a culture method allowing for an even distribution of cells across the well surface. Cell cultures used for ICW can be adherent or non-adherent. However, if they are adherent, the cells must grow as a monolayer in culture, and, if non-adherent, must be prepared so they lie in a monolayer at the time of scanning. This will ensure a uniform signal from the well surface. In our studies, which used freshly seeded uterine myocytes, there was an optimal density of cells for a response to a physiological stimulus. The plateauing of PMLC20and GAPDH signals at higher cell densities in our linearity
assessment was unlikely to be due to exceeding the capabilities of the IR scanner, but rather to cell overcrowding, for two reasons. First,
there were no saturated pixels in the well signals. Second, in the time course assessment we detected higher signal intensities for PMLC20
at 600 cells/mm2in stimulated myocytes than those obtained by simply plating a higher density of cells. It is likely that the optimal density for a biological response is dependent on the cell type used, as well as other conditions, and this parameter should be assessed whenever a new cell type is studied.
Our data also demonstrate the validity of the ICW technique to monitor physiological events in a dynamic system. Phosphoryla-tion of MLC20at Ser19results from influx of Ca2+ions into the
myocyte cytosol whether derived from the extracellular space through plasma membrane channels, or from intracellular stores whose release is triggered by the generation of inositol-trispho-sphate by PLC. This Ca2+
influx results in activation of MLCK by the intermediary Ca2+
binding protein, CaM. [13,14] We have demonstrated that pharmacological manipulation of Ca2+ flux,
CaM activity or MLCK itself has the predicted effects on concentrations of PMLC20.
Clearly, there are significant limitations to the usefulness of the ICW technique. Its application is restricted to the study of proteins in cell cultures for which a specific antibody is available. It is not suitable for study of PPs or other proteins from whole tissues or in experimental situations where freshly isolated tissues are required for simultaneous measurement of physiological and biochemical endpoints. ICWs are also restricted to the study of proteins present in high enough levels to be detectable from the cellular material in a single well, as it is not possible to concentrate low-abundance proteins. In contrast, WBs can be preceded by a protein-concentrating or protein-purifying technique such as immunopre-cipitation. Another disadvantage of ICWs is that they do not allow determination of the stoichiometry of phosphorylation, such as can be obtained using urea/glycerol PAGE [29] or via phos-tag [10] SDS-PAGE. Further, unless one has access to an infrared microscope, ICWs do not permit routine identification of the proteins yielding the measured signal, which is verified in each WB membrane using the MW marker. Lastly, whereas WBs are routinely used to analyze samples that have been frozen in storage, ICWs are unlikely to be useful in the same way since ice crystals formed during freezing may damage the integrity of the cellular structures necessary to obtain reliable data by this method. Therefore, in our experience, ICWs should be used to analyze microplates that have been stored only briefly (a few days) at 4uC. We have not formally addressed the length of time that protein phosphorylation is preserved in ICWs, and for this reason we proceeded with the preparation of microplates immediately after cell fixation. Our general observations are that some phospho-antigens are stable over several days (perhaps weeks) after fixation and storage at 4uC in PBS, but others decay more rapidly. Thus the window of time for plate development must be determined empirically for each PP.
the technical capabilities of ICWs meet or exceed the standard set by NIR fluorescent WBs. Considering the technical aspects of the two procedures, we conclude that the benefits of ICWs are generalizable irrespective of the protein target of interest.
Materials and Methods
Ethics Statement
The protocol to obtain biopsies from the lower segment of the uterus at the time of cesarean section was reviewed and approved by the Human Ethics Review Board of the University of Alberta and the Ethics Review Board of Capital Health, the provider of health services in the region. A research nurse at the Royal Alexandra Hospital in Edmonton obtained informed and written consent from each patient.
Primary Myometrial Cell Cultures
Myometrial biopsies were obtained from the lower segment of the uterus from non-labouring patients at term (37–40 weeks) gestation during elective caesarean section. Biopsies were cut into small pieces with ethanol-sterilized tools in a sterile cell culture hood, then incubated in filter sterilized (0.22mm) Hanks Balanced salt solution (HBSS, Gibco, (Invitrogen, Carlsbad, CA)) containing 1% antimy-cotic/antibiotic (Gibco; 10,000 U/mL of penicillin, 10,000mg/mL
of streptomycin, 25mg/mL of amphotericin B), 2 mg/mL collage-nase (Sigma-Aldrich, St. Louis, MO), and 200 ng/mL DNase I (Roche, Laval, QC) in a 50 mL conical tube (Corning) in a total volume of 10 mL of the prepared HBSS. These tubes were incubated for 1 hr at 37uC with shaking. After 1 h, the debris was allowed to settle and the supernatant (containing fibroblasts) was discarded. The remaining tissue was incubated in another 10 mL of prepared HBSS at 37uC while shaking, for 4 hrs to overnight (O/ N). The dispersed cell mixture was filtered through a 100mm cell strainer, centrifuged at 20006gfor 5 min, and washed twice with
sterile phosphate buffered saline (PBS). Isolated uterine myocytes were grown in Dulbecco’s modified Eagle’s medium (DMEM, Gibco) supplemented with 10% fetal bovine serum (FBS, Gibco) and 1% antimycotic/antibiotic (Gibco) at 37uC in humidified 5% CO2/95% air. Cell cultures were grown to 80–100% confluence in
a single well of a 6-well plate post-isolation from tissue biopsies, then in T25 and T75 flasks (Ultident, St. Laurent, QC). Incubation at 37uC with trypsin (0.05%, Gibco) was used to free cells from the substrate. An excess of culturing medium was used to quench the trypsinization reaction. Cells were monodispersed by vigorous pipetting, counted using a hemocytometer and then plated at the desired cell density onto sterile black-walled 96 well (Greiner Bio-One, Monroe, NC) microplates for ICW, in sterile 6-well plates (Corning, Lowell, MA) for WB, or on 8-chamber slides (VWR Int., USA) for fluorescence microscopy experiments. Prior to experi-ments, the cells were washed once with pre-warmed DMEM containing no additives, and then placed into the incubator in DMEM without additives for 2–4 hrs. All stimulants, pharmaco-logic agents, and drug diluents (DMSO) were diluted in DMEM without additives to the final concentration prior to experiments. Oxytocin (OT), ML-7 (MLC20Kinase inhibitor), W7 (calmodulin
antagonist), edelfosine (phospholipase C inhibitor), and nifedipine (calcium channel blocker) were all acquired from Calbiochem.
Total Protein Extraction
For WB, total cellular protein was extracted by two methods. Method 1: cells were washed after treatment with ice-cold PBS followed by addition of ice-cold lysis buffer containing 50 mM Tris-HCl pH 8.0, 137 mM NaCl, 5 mM EDTA, 0.1% Triton X-100, 1 mM PMSF, 1X protease inhibitor cocktail (Sigma-Aldrich, Final
concentrations: 1.04 mM ASBSF, 0.8mM Aprotinin, 21mM
Leupeptin, 36mM Bestatin, 15mM Pepstatin A, 14mM E-64), and 1X phosphatase inhibitor cocktail (PhoSTOP, Roche) for detection of PPs. Cells were freed from the substrate using a cell scraper and collected into wet-ice-cooled microfuge tubes, then snap frozen in liquid nitrogen and stored at280uC for later use. Protein concentrations were determined by combining 1 part sample to 99 parts Precision RedTM advanced protein measurement reagent (ADV02, Cytoskeleton, Denver, CO, USA) according to the manufacturer’s instructions. Method 2: after treatment, cells were lysed in an acetone solution containing 10% trichloroacetate (TCA) 10 mM dithiothreitol (DTT), and protease inhibitors as indicated above. This solution was pre-cooled in a dry-ice methanol bath before addition to the culture plate. Cells were immediately scraped from the substrate as above, and then collected into wet-ice-cooled microfuge tubes. These tubes were centrifuged at 18,0006g for
30 min at 4uC, the supernatant was removed, and the pellet was resuspended by vortexing in acetone containing 10 mM DTT, and allowed to sit O/N. The next day, tubes were centrifuged at 18,0006gfor 15 min at 4uC. The washing solution was removed
and the pellets were allowed to air-dry for 20–30 min. The dried pellets were resuspended in 60mL of 1X SDS-PAGE loading buffer (see below) and incubated at 65uC for 10 min before storage or loading 17.5mL from each onto SDS-PAGE minigels.
SDS-PAGE and Protein Transfer
Total protein was prepared for electrophoresis by adding 5X loading buffer (Final concentrations: 10% glycerol, 3% SDS w/v, 85 mM Tris HCl pH 6.8, 85 mM dithiothreitol, 0.1% bromophe-nol blue) and boiling for 10 minutes. Approximately 25mg/lane of protein was loaded onto 15% or 18% Tris-Glycine-SDS minigels, or alternatively, onto 12% gels with or without 30mM phos-tag [10]
reagent (NARD Institute, Ltd., www.phos-tag.com) combined with 60mM MnCl2to demonstrate shifts in mobility for PPs. SDS-PAGE
was carried out in 1X SDS running buffer (10X Tris-Glycine-SDS buffer, BioRad, Hercules, CA, USA) using a constant current of 15 mA for the stacking (4.2% acrylamide, pH 6.8) gel and then a constant 25–30 mA for the separating (15% or 18% acrylamide, pH 8.8) gel in a Mini-PROTEAN 3 electrophoresis apparatus (BioRad), according to the Laemmli method. [30] Precision Plus Protein all blue standard (2.5mL/lane, BioRad) was loaded on each
gel for visualization in the 700-channel of the OdysseyHimager. The gel was transferred to nitrocellulose (Li-COR, Biosciences, Lincoln, NE, USA) at 4uC in a Mini-Trans-Blot cell (BioRad) apparatus using a buffer containing 20% MeOH and 1X Tris-Glycine (10X Tris-Glycine, Li-COR) for 1.5 hrs at 100 V. Gels containing phos-tag and MnCl2were incubated at room temperature (R/T) for 15–
20 min in transfer buffer of the same composition supplemented with 2 mM EDTA to chelate and remove Mn2+
ions, then allowed to equilibrate in transfer buffer without EDTA for an additional 15– 20 min prior to transfer.
Western Immunoblotting
After transfer, membranes were rinsed briefly in PBS. Nitrocel-lulose membranes were placed into OdysseyHblocking buffer (OBB, Li-COR) diluted 1:1 with PBS immediately and blocked for 1 hr at R/T. Primary antibodies were diluted in OBB combined 1:1 with PBS, containing 0.1% Tween-20, and incubated O/N at 4uC. The final antibody concentrations used were 1:1000 for GAPDH (mouse MAb, Santa Cruz), 1:500 for MLC20(Rabbit PAb, Cell Signaling),
1:200 for PMLC20 (rabbit PAb, Cell Signaling), and 1:200 for
PPMLC20(diphospho Thr 18
R/T on a bench top shaker. Secondary antibodies conjugated to IRDye 800CW (Li-COR) or Alexa Fluor 680 (Molecular Probes, Invitrogen) were diluted to 1:20,000 in OBB combined 1:1 with PBS, containing 0.1% Tween-20 and 0.01% SDS. Membranes were incubated with secondary antibody solutions for 1.5 hrs at R/ T and in the dark on a bench top shaker. After secondary antibody incubations, the membranes were washed 3X (10 min each) with PBS-T at R/T on a bench top shaker in the dark, then briefly rinsed in PBS before scanning. Membranes were scanned and analyzed using an OdysseyHIR scanner using OdysseyH imaging software 3.0. Scan settings were medium or high image quality, 169mm resolution, intensity 3.0–5.0 for both channels with no offset. Antibody signals were analyzed as integrated intensities of regions defined around the bands of interest in either channel.
In-Cell Westerns
Cells were plated in sterile black-walled 96 (half-area) (Greiner Bio-One, Monroe, NC) plates at the desired density then placed at R/T for 30–60 minutes before transfer to the incubator to reduce excessive settling at the well edges. [31] The plates were incubated O/N at 37uC as indicated above. Prior to treatment, all wells were washed with DMEM, and incubated in DMEM for 2–4 hours before beginning the experiments. Cell treatments were dispensed with a calibrated digital multichannel pipette with a repeater function to ensure accuracy in treatment timing. After treatment, cells were fixed immediately by adding concentrated formalin to a final concentration of 3.7% formaldehyde and incubating at R/T for 10 minutes. After fixation, the plates were washed with PBS then permeabilized by washing 3X (10 min each) on a bench top shaker with PBS containing 0.1% Triton-X-100, and then rinsed once with PBS. Cells were blocked using 20mL/well OBB for 1 hr at R/T. Primary antibodies were prepared as for WB and the plates were incubated O/N at 4uC using 20mL/well. The final antibody concentrations
used were 1:500 for GAPDH (mouse MAb, Santa Cruz) and 1:200 for PMLC20(Rabbit PAb, Cell Signaling). After primary antibody
incubations, plates were washed 3X (10 min each) with 100mL/well
PBS-T at R/T on a bench top shaker. Secondary antibodies were prepared as for WB with a few modifications: IRDye 800CW conjugates of Goat-anti-rabbit-IgG (Li-COR), goat-anti-mouse-IgG (Li-COR) were used at 1:1000 dilution for detection of antibody targets in the 800-channel (green pseudocolor). 800-channel antibody signals were normalized to the 700-channel (red pseudocolor) signals derived from Alexa-Fluor 680 conjugated goat-anti-mouse-IgG secondary at 1:1000 (Molecular Probes, Invitrogen), or DRAQ5 (Biostatus Ltd., Leicestershire, UK) combined with Sapphire700 (Li-COR) at 1:10,000 and 1:1000 respectively. Plates were incubated with 20mL/well secondary antibody solutions for 90 min at R/T in the dark. Background control wells were prepared by omitting primary antibodies, DRAQ5 and Sapphire700 (i.e. secondary only). After secondary antibody incubations, plates were washed 3X (10 min each) with PBS-T at R/T on a bench top shaker in the dark, and then filled with 50mL/well PBS to reduce surface
disturbances when scanning. Plates were scanned and analyzed using an OdysseyHIR scanner using OdysseyHimaging software 3.0. Scan settings were medium or high image quality, 169mm resolution, intensity 5.0 for the 700-channel, and 7.0 for the 800-channel with an offset of 4.0 mm. For signal quantification, antibody signals were analyzed as the average 800-channel integrated intensities from duplicate wells normalized to the 700-channel signal integrated intensity to correct for well-to-well variations in cell number. Results are expressed as percent relative responses (means6standard errors of the mean) compared to vehicle-treated controls.
Microscopy
8-chamber sterile culture slides (BD Falcon) were seeded, cultured, treated, fixed, and prepared for fluorescence or brightfield micros-copy exactly as culture plates for ICWs, with the exception of utilizing a lower dilution of primary antibodies (1:50 MLC20(Rabbit PAb,
Cell Signaling), 1:50 PMLC20(Rabbit PAb, Cell Signaling), 1:200
GAPDH) and DyLight 488-conjugated goat-anti-rabbit-IgG (Cell Signaling) and goat-anti-mouse-IgG (Cell Signaling) antibodies at a dilution of 1:100. After secondary antibody application, cells were rinsed 3X in PBS-T and then incubated with 50 nM rhodamine-phalloidin (Cytoskeleton, Denver, CO, USA) for 10 min at R/T to reveal F-actin fiber distribution. Slides were rinsed 3X in PBS then mounted in VECTASHIELD (Vector Laboratories, Burlington, ON, Canada) mounting medium containing DAPI to detect nuclei. Slides were allowed to rest for 60 min in the dark and stored at 4uC if necessary before visualizing under an Olympus IX81 fluorescent microscope (Carson Scientific Imaging Group; Ontario, Canada) using Slidebook 2D, 3D Timelapse Imaging Software (Intelligent Imaging Innovations Inc.; CO, U.S.A.).
Statistical Analysis
The results were expressed using means (6S.E.M.). Statistical analysis was performed using One-way ANOVA to compare the means of 3 or more groups at a time in OT-induced MLC20
phosphorylation time course studies. Two-factor ANOVA was used to determine if pharmacologic inhibitors had an effect on the OT-induced MLC20phosphorylation. A P-value of 0.05 was used
to establish statistical significance.
Acknowledgments
We thank the research nurses at the Royal Alexandra Hospital in Edmonton, Alberta, for their help in tissue collection for preparation of cell cultures. We also thank the support staff at Li-COR Biosciences for providing technical guidance on establishing and optimizing the In-Cell Western technique.
Author Contributions
Conceived and designed the experiments: HNA BFM. Performed the experiments: HNA CNT BZ. Analyzed the data: HNA. Contributed reagents/materials/analysis tools: BFM. Wrote the paper: HNA BFM.
References
1. Weldon S, Ambroz K, Schutz-Geschwender A, Olive DM (2008) Near-infrared fluorescence detection permits accurate imaging of loading controls for Western blot analysis. Anal Biochem 375: 156–158.
2. Wang YV, Wade M, Wong E, Li YC, Rodewald LW, et al. (2007) Quantitative analyses reveal the importance of regulated Hdmx degradation for p53 activation. Proc Natl Acad Sci U S A 104: 12365–12370.
3. Jungblut P, Eckerskorn C, Lottspeich F, Klose J (1990) Blotting efficiency investigated by using two-dimensional electrophoresis, hydrophobic membranes and proteins from different sources. Electrophoresis 11: 581–588.
4. Tovey ER, Baldo BA (1987) Comparison of semi-dry and conventional tank-buffer electrotransfer of proteins from polyacrylamide gels to nitrocellulose membranes. Electrophoresis 8: 384–387.
5. Selkirk JV, Nottebaum LM, Ford IC, Santos M, Malany S, et al. (2006) A novel cell-based assay for G-protein-coupled receptor-mediated cyclic adenosine monophosphate response element binding protein phosphorylation. J Biomol Screen 11: 351–358.
6. Kumar N, Afeyan R, Kim HD, Lauffenburger DA (2008) Multipathway model enables prediction of kinase inhibitor cross-talk effects on migration of Her2-overexpressing mammary epithelial cells. Mol Pharmacol 73: 1668–1678. 7. Coevoets R, Arican S, Hoogeveen-Westerveld M, Simons E, van den
Ouweland A, et al. (2009) A reliable cell-based assay for testing unclassified TSC2 gene variants. Eur J Hum Genet 17: 301–310.
9. Schroter T, Griffin E, Weiser A, Feng Y, LoGrasso P (2008) Detection of myosin light chain phosphorylation–a cell-based assay for screening Rho-kinase inhibitors. Biochem Biophys Res Commun 374: 356–360.
10. Kinoshita E, Kinoshita-Kikuta E, Takiyama K, Koike T (2006) Phosphate-binding tag, a new tool to visualize phosphorylated proteins. Mol Cell Proteomics 5: 749–757.
11. Takeya K, Loutzenhiser K, Shiraishi M, Loutzenhiser R, Walsh MP (2008) A highly sensitive technique to measure myosin regulatory light chain phosphor-ylation: the first quantification in renal arterioles. Am J Physiol Renal Physiol 294: F1487–1492.
12. Smith PJ, Wiltshire M, Davies S, Patterson LH, Hoy T (1999) A novel cell permeant and far red-fluorescing DNA probe, DRAQ5, for blood cell discrimination by flow cytometry. J Immunol Methods 229: 131–139. 13. Kim HR, Appel S, Vetterkind S, Gangopadhyay SS, Morgan KG (2008)
Smooth muscle signalling pathways in health and disease. J Cell Mol Med 12: 2165–2180.
14. Takashima S (2009) Phosphorylation of myosin regulatory light chain by myosin light chain kinase, and muscle contraction. Circ J 73: 208–213.
15. Hunter T (1995) Protein kinases and phosphatases: the yin and yang of protein phosphorylation and signaling. Cell 80: 225–236.
16. Bhadriraju K, Elliott JT, Nguyen M, Plant AL (2007) Quantifying myosin light chain phosphorylation in single adherent cells with automated fluorescence microscopy. BMC Cell Biol 8: 43.
17. Word RA, Stull JT, Casey ML, Kamm KE (1993) Contractile elements and myosin light chain phosphorylation in myometrial tissue from nonpregnant and pregnant women. J Clin Invest 92: 29–37.
18. Zhou XB, Lutz S, Steffens F, Korth M, Wieland T (2007) Oxytocin receptors differentially signal via Gq and Gi proteins in pregnant and nonpregnant rat uterine myocytes: implications for myometrial contractility. Mol Endocrinol 21: 740–752.
19. Sharma SK, Carew TJ (2002) Inclusion of phosphatase inhibitors during Western blotting enhances signal detection with phospho-specific antibodies. Anal Biochem 307: 187–189.
20. Abeyrathne PD, Lam JS (2007) Conditions that allow for effective transfer of membrane proteins onto nitrocellulose membrane in Western blots. Can J Microbiol 53: 526–532.
21. Towbin H, Staehelin T, Gordon J (1979) Electrophoretic transfer of proteins from polyacrylamide gels to nitrocellulose sheets: procedure and some applications. Proc Natl Acad Sci U S A 76: 4350–4354.
22. Bolt MW, Mahoney PA (1997) High-efficiency blotting of proteins of diverse sizes following sodium dodecyl sulfate-polyacrylamide gel electrophoresis. Anal Biochem 247: 185–192.
23. Egger D, Bienz K (1994) Protein (western) blotting. Mol Biotechnol 1: 289–305. 24. DenHollander N, Befus D (1989) Loss of antigens from immunoblotting
membranes. J Immunol Methods 122: 129–135.
25. Tovey ER, Baldo BA (1989) Protein binding to nitrocellulose, nylon and PVDF membranes in immunoassays and electroblotting. J Biochem Biophys Methods 19: 169–183.
26. Aldridge GM, Podrebarac DM, Greenough WT, Weiler IJ (2008) The use of total protein stains as loading controls: an alternative to high-abundance single-protein controls in semi-quantitative immunoblotting. J Neurosci Methods 172: 250–254.
27. Mandell JW (2003) Phosphorylation state-specific antibodies: applications in investigative and diagnostic pathology. Am J Pathol 163: 1687–1698. 28. Arnon R, Van Regenmortel MH (1992) Structural basis of antigenic specificity
and design of new vaccines. FASEB J 6: 3265–3274.
29. Weber LP, Van Lierop JE, Walsh MP (1999) Ca2+-independent phosphory-lation of myosin in rat caudal artery and chicken gizzard myofilaments. J Physiol 516 (Pt 3): 805–824.
30. Laemmli UK (1970) Cleavage of structural proteins during the assembly of the head of bacteriophage T4. Nature 227: 680–685.