www.hydrol-earth-syst-sci.net/20/347/2016/ doi:10.5194/hess-20-347-2016
© Author(s) 2016. CC Attribution 3.0 License.
High-frequency monitoring of water fluxes and nutrient loads to
assess the effects of controlled drainage on water storage and
nutrient transport
J. C. Rozemeijer1, A. Visser2, W. Borren1, M. Winegram3, Y. van der Velde4, J. Klein1, and H. P. Broers5
1Deltares, P.O. Box 85467, 3508 AL Utrecht, the Netherlands
2Lawrence Livermore National Lab, P.O. Box 808, Livermore, CA 94551-0808, USA 3Allseas Engineering, Poortweg 12, 2612 PA Delft, the Netherlands
4Department of Earth Sciences, VU University Amsterdam, Boelelaan 1085, 1081 HV Amsterdam, the Netherlands 5TNO Geological Survey of the Netherlands, P.O. Box 80015, 3508 TA Utrecht, the Netherlands
Correspondence to:([email protected])
Received: 1 May 2015 – Published in Hydrol. Earth Syst. Sci. Discuss.: 30 June 2015 Revised: 29 October 2015 – Accepted: 14 December 2015 – Published: 19 January 2016
Abstract.High nitrogen (N) and phosphorus (P) fluxes from upstream agriculture threaten aquatic ecosystems in surface waters and estuaries, especially in areas characterized by high agricultural N and P inputs and densely drained catch-ments like the Netherlands. Controlled drainage has been recognized as an effective option to optimize soil moisture conditions for agriculture and to reduce unnecessary losses of fresh water and nutrients. This is achieved by introduc-ing control structures with adjustable overflow levels into subsurface tube drain systems. A small-scale (1 ha) field ex-periment was designed to investigate the hydrological and chemical changes after introducing controlled drainage. Pre-cipitation rates and the response of water tables and drain fluxes were measured in the periods before the introduc-tion of controlled drainage (2007–2008) and after (2009– 2011). For the N and P concentration measurements, auto-analyzers for continuous records were combined with pas-sive samplers for time-averaged concentrations at individual drain outlets. The experimental setup enabled the quantifi-cation of changes in the water and solute balance after in-troducing controlled drainage. The results showed that intro-ducing controlled drainage reduced the drain discharge and increased the groundwater storage in the field. To achieve this, the overflow levels have to be elevated in early spring, before the drain discharge stops due to dryer conditions and falling groundwater levels. The groundwater storage in the field would have been larger if the water levels in the
adja-cent ditch were controlled as well by an adjustable weir. The N concentrations and loads increased, which was largely re-lated to elevated concentrations in one of the three monitored tube drains. The P loads via the tube drains reduced due to the reduction in discharge after introducing controlled drainage. However, this may be counteracted by the higher groundwa-ter levels and the larger contribution of N- and P-rich shallow groundwater and overland flow to the surface water.
1 Introduction
long as agricultural productivity is not threatened by wet con-ditions. This is achieved by control structures with adjustable overflow levels in subsurface tube drain systems. Several pi-lot studies (e.g., Evans et al., 1995; Wesström and Messing, 2007; Jaynes, 2012, Helmers et al., 2012) reported signifi-cant reductions in discharge of water via tube drains (−16 up to −89 %). Although the nitrogen concentrations in the drain effluent did not change in most cases, the reduced wa-ter discharge also reduced the nitrogen export via tube drains (−18 up to−82 %).
None of the reported studies quantified the changes of nu-trient export via other flow routes, such as shallow ground-water flow and overland flow. Therefore, the fate of the re-duced water and nutrient exports often remains unknown (Woli et al., 2011). Ideally, the conserved water and nutrients enhance crop production. However, the reported effects of controlled drainage on crop production vary between no sig-nificant change up to an increase of 19 % at individual fields (Wesström and Messing, 2007; Ghane et al., 2012). Consid-ering the limited increase in water and nutrient uptake by crops, the possibility comes up that water and nutrients are still exported towards the surface water via enhanced over-land or shallow groundwater flow.
This study aimed to quantify the effects of controlled drainage on water and nutrient exports from an agricultural field to the surface-water system. A small-scale (1 ha) field experiment was designed to investigate the changes in flow route contributions towards surface water after introducing controlled drainage. Precipitation rates and the response of water tables and drain fluxes were measured in the period be-fore the introduction of controlled drainage (2007–2008) and after (2009–2011). For the N and P concentration measure-ments, auto-analyzers for continuous records were combined with passive samplers for time-averaged concentrations at in-dividual drain outlets. This setup enabled us to quantify the changes in the field water and solute balance after introduc-ing controlled drainage.
2 Methods 2.1 Study area
The experimental setup was installed in the Hupsel catch-ment (6.64 km2) in the eastern part of the Netherlands (Fig. 1; 52◦
04′ 01.5′′
N, 6◦ 39′
29.0′′
E). The surface elevations
Figure 1.Location of the Hupsel catchment and the experimental field. The field sketch shows the three measured tube drains, the location of the in-stream reservoirs, and the locations of the con-tinuous groundwater level recording in transects at 5 m from the ditch (B1–B7) and at 80 m from the ditch (D1–D7).
in the catchment range from 22 to 36 m above sea level (a.s.l.) and the land use is predominantly agricultural with maize and grassland. At depths ranging from 0.5 to 20 m a 20–30 m thick impermeable marine clay layer of Miocene age is found of which the top is carved by glacial erosion. This clay layer forms a natural lower boundary for the unconfined ground-water flow (Van Ommen et al., 1989; Van der Velde et al., 2010, 2011). The unconfined aquifer consists of Pleistocene eolian sands with occasional layers of clay, peat, and gravel. Wösten et al. (1985) classified the main soil type of the ment as sandy, siliceous, mesic Typic Haplaquads. The catch-ment is drained by a dense network of artificial ditches and subsurface tube drains. The spacing between the ditches av-erages 300 m and tube drainage is installed in more than 50 % of the area; see Van der Velde et al. (2010) for a more detailed description of the Hupsel catchment.
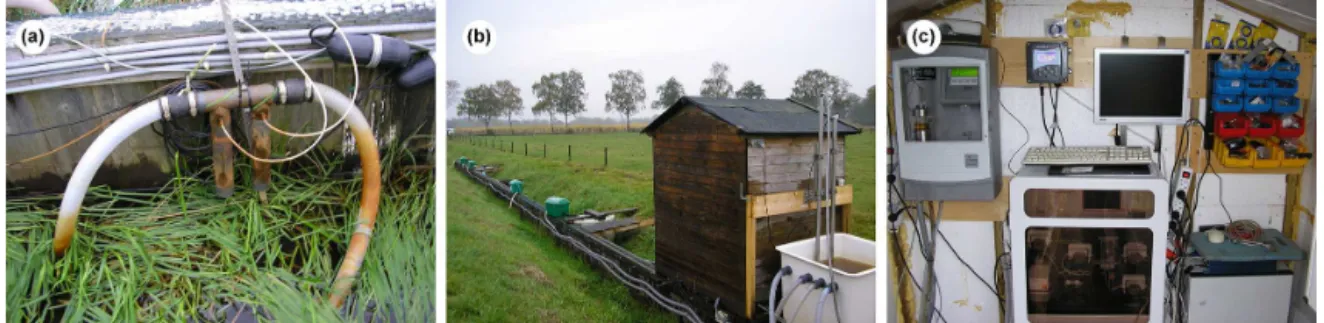
Figure 2. Picture of the complete setup with collector vessels for drain discharge, pumps, and water-flux meters. The shed in the back houses the data acquisition and control equipment.
2.2 Experimental setup reference period
The water and nutrient fluxes at the experimental field were monitored for the reference situation with conventional drainage from May 2007 to December 2008. During the sum-mer of 2009, the setup was extended and controlled drainage was introduced. This approach enabled us to study the hy-drological and chemical changes after introducing controlled drainage. A reference field without controlled drainage was not included in the experimental setup. The large spatial vari-ability in hydrology and nutrient concentrations (see also Rozemeijer et al., 2010c) would not allow for an appropri-ate comparison between a pilot and a reference field. This was also concluded by Heinen et al. (2012), who studied the field-scale effects of buffer strips at a nearby experimental field.
The monitoring for the controlled drainage period was from November 2009 to September 2011. The farmer’s land management did not change during this period. During both periods, the field was used for grass harvesting and cattle grazing. Manure was applied at the experimental field up to the maximum allowed 170 kg N ha−1yr−1 during both the
reference and the controlled drainage period.
The experimental setup for the reference period is de-scribed in detail by Van der Velde et al. (2010). The tube drain effluent was physically separated from the groundwa-ter and overland flow routes towards a 43.5 m long section of the ditch (Fig. 1). To separate the fluxes toward the ditch via different routes, three adjacent sheet pile reservoirs were built (Fig. 2). These in-stream reservoirs were constructed around the outlets of drains 1, 2, and 3 and captured overland flow, interflow, direct precipitation, and groundwater inflow from the thin aquifer above the Miocene clay. Excess water was pumped from the in-stream reservoirs into the ditch and
the pumped volumes were recorded with digital flux meters with an accuracy of 2 %.
The effluent from the tube drains was separated from the other flow routes by connecting each drain outlet to a 500 L vessel using a flexible tube (Fig. 2). In an undisturbed situ-ation, the surface-water pressure would affect the tube drain flow rates when the drain outlets are submerged. To imitate this effect, floaters were attached to the flexible tubes that connected the drains to the collection vessels. Thus, water leaving the drain had to flow up to the ditch water level be-fore being discharged into the vessel (Van der Velde et al., 2010). After reaching a maximum water level in the vessel, the water was pumped into the ditch and the flux was mea-sured with digital water-flux meters. On an average day dur-ing the drainage season, the vessels filled and emptied every 2 h.
In addition to the discharge measurements, phreatic groundwater levels were measured weekly on 14 locations in transects at 5 m from the ditch and at 80 m from the ditch (Fig. 1). The meteorological data were derived from the Royal Dutch Meteorological Institute (KNMI) weather station adjacent to the experimental field (Fig. 1).
During the reference period, water quality samples were taken weekly from the three in-stream reservoirs and from the three drain effluent vessels. The samples were taken us-ing a peristaltic pump and filtered in situ (0.45 µm). Electri-cal conductivity and the pH of the samples were measured directly in the field. Sub-samples for ICP (inductively cou-pled plasma) analysis were directly acidified with HNO3. All
samples were transported and stored at 4◦C. The samples were analyzed within 48 h using IC (NO3–N, SO4, Cl),
ICP-AES (inductively coupled plasma atomic emission spectrom-etry) (Na, K, Ca, Fe, Mg, Si), ICP-MS (inductively coupled plasma mass spectrometry) (P, Al, Ni, Cu, Zn, Cd, Pb), AA (NH4). HCO3was measured by titration. Samples with
devi-ating results for ions measured by more than one analytical method as well as samples with an ionic unbalance larger than 10 % were reanalyzed.
In addition to the grab sampling, SorbiCell samplers (De Jonge and Rothenberg, 2005) were used for monthly time-averaged NO3–N concentration measurements of tube drain
effluent. The SorbiCell samplers were applied to measure av-erage NO3–N concentrations for individual drains. An
eval-uation of SorbiCells based on duplicate analyses and com-parison to conventional grab sampling and continuous mea-surements was published by Rozemeijer et al. (2010c). The SorbiCells proved to be capable of reproducing the NO3
con-centration levels and the seasonal patterns that were observed with weekly conventional grab sampling and continuous wa-ter quality measurements.
2.3 Experimental setup controlled drainage period
Figure 3.Pictures of the controlled drainage period setup:(a)the drainage overflow levels were adjusted by attaching the flexible connection tube (with a SorbiCell socket between the black fasteners) at the desired level;(b)the tube drain effluent was pumped to a collection vessel to enable continuous monitoring of NO3–N and total-P concentrations using a Nitratax-UV sensor and a Phosphax auto-analyzer(c).
Figure 4.Drainage overflow level management schedule. The over-flow levels were elevated most of the time, but were lowered in early spring and, if needed, in autumn to accommodate manure applica-tion and harvest.
focus more on the tube drains. The monitoring of the ground-water and overland flow contributions towards the in-stream reservoirs was stopped. The overflow levels of the drains were controlled by attaching the flexible connection tubes between the drain outlets and the collection vessels at the desired level (Fig. 3a). In the reference setup, the connection tubes were kept just below the water table in the reservoir us-ing floaters. The excess water from the three drainage efflu-ent vessels was collected in a combined reservoir (Fig. 3b). This enabled continuous registration of NO3–N and total-P
concentrations of the combined drain effluent, for which a Nitratax-UV sensor and a Phosphax auto-analyzer were used (both Hach, Germany; Fig. 3c). More details on these tech-nologies are provided by Van der Grift et al. (2015). Phreatic groundwater levels were monitored continuously using pres-sure sensors in all 14 piezometers in transects B and D. The high-resolution measurements enabled us to measure the di-rect responses of groundwater levels, drain discharges, and drain effluent nutrient concentrations after changing the over-flow levels of the drains.
The overflow levels of the drains were adjusted follow-ing the scheme in Fig. 4. The exact adjustment moments are shown in the results section. To conserve as much water as possible, the overflow levels were elevated during most of the year. However, the field had to be dry enough for manure spreading after the end of the winter ban on manure spread-ing on 15 February. Like many farmers, the land owner has a limited storage capacity for manure, which forces him to ap-ply manure as early as possible after 15 February. To enable
manure spreading, the overflow levels were lowered to the original drain outlet levels during February and March. In the case of wet conditions at the end of the summer (grass har-vest, manure spreading), the overflow levels were also low-ered in consultation with the land owner.
3 Results
3.1 Water levels, flows, and water balances
The most important quantitative hydrological monitoring re-sults are summarized in Fig. 5. The overflow levels of the drain outlets were elevated for the first time in Novem-ber 2009. Initially, the overflow level was raised up to 20 cm above the drain outlet levels. Starting in mid-December 2009, the overflow levels were raised up to+50 cm. In early spring 2010, the overflow levels were lowered to+35 cm to en-able the first manure application. In the wet autumn 2010 pe-riod, and in early spring 2011, the overflow levels were low-ered down to the original drain outlet level. During the sec-ond drainage season with controlled drainage (2010–2011) we elevated and lowered the overflow levels with 50 cm on each occasion in order to bring about more distinct changes in groundwater levels, drain discharges, and nutrient losses compared to the first season (2009–2010).
The groundwater levels were above the tube drain level during the winter drainage period (Fig. 5). The differences between the individual piezometers in each transect were low, which indicates a minor groundwater level curvature be-tween the drains. The winter groundwater levels were higher during the controlled drainage period compared to the refer-ence period, especially in piezometers of transect D at 80 m from the ditch. The total amount of precipitation was higher in the reference drainage season compared to the controlled drainage period (see also Table 1). This indicates that the higher groundwater levels during the controlled drainage pe-riod could not have been caused by weather conditions, but rather by the elevated overflow level of the drains.
Figure 5.Combined results of hydrological measurements. The time series shown are (1) the overflow level of the drains (fixed at 27.5 in reference period, variable in controlled drainage period) in black, (2) the groundwater levels of the two transects B and D, and (3) in the lower part the drainage flux (grey) and precipitation (blue). The surface elevations at the lowest and highest groundwater monitoring locations of transects B and D are shown in colored horizontal lines.
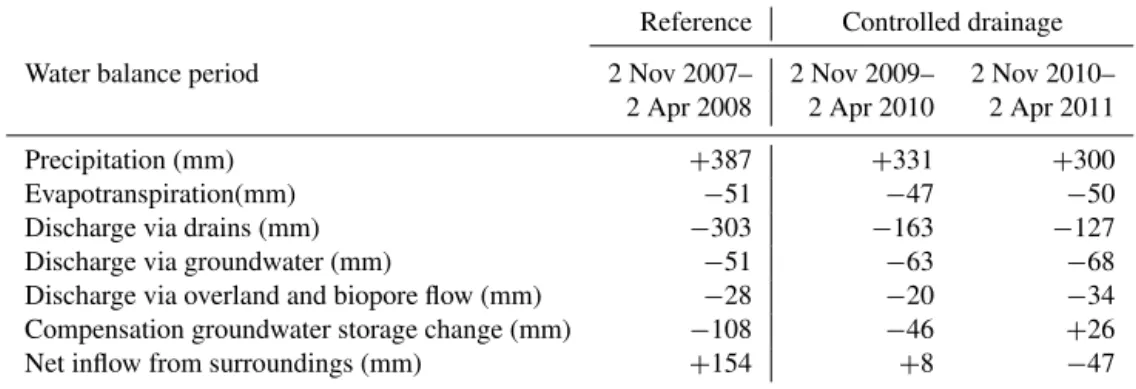
Table 1.Water balances for a reference drainage season (2007–2008) and two controlled drainage seasons (2009–2010 and 2010–2011).
Reference Controlled drainage
Water balance period 2 Nov 2007– 2 Nov 2009– 2 Nov 2010– 2 Apr 2008 2 Apr 2010 2 Apr 2011
Precipitation (mm) +387 +331 +300
Evapotranspiration(mm) −51 −47 −50
Discharge via drains (mm) −303 −163 −127
Discharge via groundwater (mm) −51 −63 −68
Discharge via overland and biopore flow (mm) −28 −20 −34 Compensation groundwater storage change (mm) −108 −46 +26
Net inflow from surroundings (mm) +154 +8 −47
longer periods, which indicates that ponding and overland flow became more important. Ponding and overland flow at the experimental field, as well as its relation with the ground-water levels, have been observed and reported by Van der Velde et al. (2010).
The groundwater levels at 5 m from the ditch in transect B were less affected by controlled drainage than the groundwa-ter levels at 80 m from the ditch in transect D. The most ev-ident difference between the responses of transects B and D was in November 2010, when the overflow levels were raised to+50 cm. Before this, the groundwater level difference be-tween transects B and D averaged 15 cm. After elevating the overflow levels, the difference increased up to ca. 50 cm.
The tube drain fluxes were clearly affected by the changes in overflow levels during the controlled drainage period. Dur-ing the reference period, the drains were active for several periods during the summer period of 2009. In the controlled drainage period, the tube drainage flow stopped after raising
the overflow levels in spring 2010 and 2011. No drainage flow was registered during the subsequent summer periods. However, the drainage flow was immediately re-activated af-ter lowering the overflow levels. This effect was most promi-nent in the 2010–2011 drainage period, when the overflow levels were lowered by 50 cm on two occasions, resulting in an immediate re-activation of the tube drain discharge.
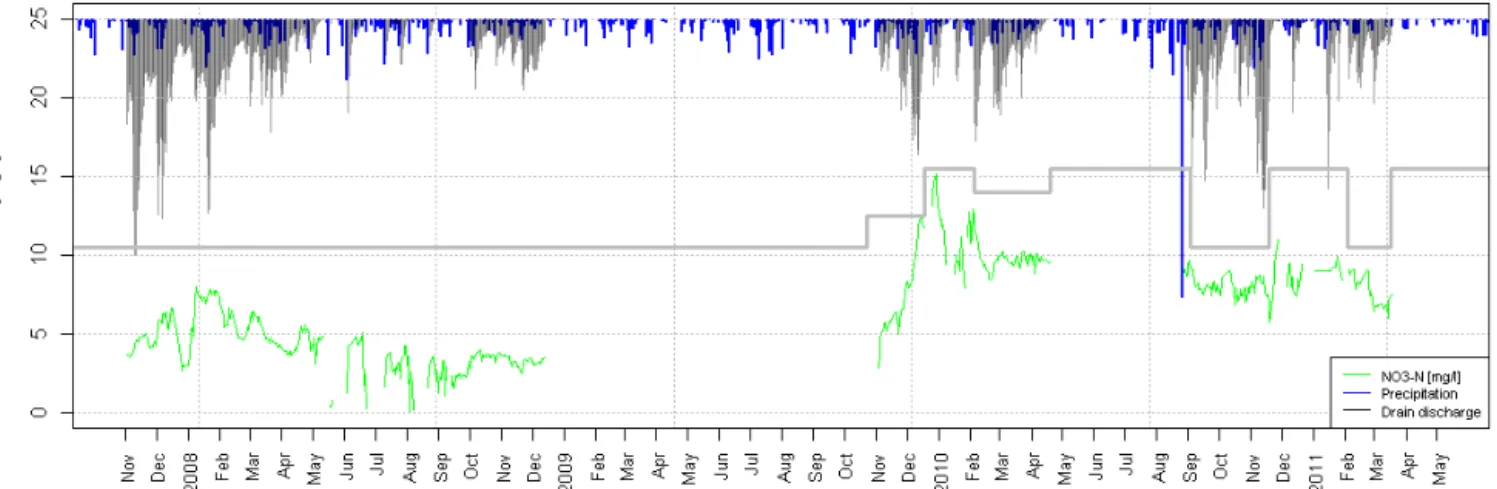
Figure 6.Measured nutrient concentrations in drain effluent. Precipitation (blue), drain discharge (grey), and the overflow levels are also plotted.
der Velde et al., 2010). Winegram (2012) used the measured groundwater discharges and groundwater level gradients to estimate the average saturated conductivity (k). This con-ductivity, together with the groundwater level gradients mea-sured during the reference period, was used to estimate the groundwater discharge during the controlled drainage period. A similar approach was used to estimate the overland and biopore flow volumes during the controlled drainage period. In this case, Winegram (2012) related the measured overland and biopore flow during the reference period to the amount of precipitation that fell on ponded parts of the field. The stor-age change in the water balance was derived from the differ-ence in groundwater levels between the start and the end of the water balance periods. The net influx (or outflux) from the surrounding fields via regional groundwater flow cannot be measured, but was likely to occur and was needed to close the water balance for which the other fluxes were accurately
measured (Van der Velde et al., 2010). More details on the water balance for the reference period were reported in Van der Velde et al. (2010) and for the controlled drainage period in Winegram (2012) and Rozemeijer et al. (2012).
When comparing the water balances for the reference period with the controlled drainage period, the differences in precipitation input and the groundwater storage change should be considered. The reference period was wetter than both controlled drainage periods, which may explain part of the differences in the discharges via groundwater, tube drains, and overland flow in the water balances. In addition, the groundwater levels rose during the reference water bal-ance period. This change in groundwater storage during the reference period is compensated with a negative water vol-ume (−108 mm), indicated as “compensation groundwater
Figure 7.Results of the SorbiCell average NO3–N concentration measurements for the individual drains.
levels was measured. During the second controlled drainage period the groundwater levels dropped slightly, which is compensated for in the water balance with a positive volume (+26 mm).
The discharge via the tube drains was significantly lower in the controlled drainage periods compared to the refer-ence period:−46 % in 2009–2010 and−58 % in 2010–2011. The discharge via groundwater increased slightly. Overland flow was slightly less in 2009–2010 and more in 2010–2011. However, these small changes in groundwater discharge and overland flow cannot compensate for the large reduction in discharge via drains. This compensation mainly comes from the net inflow of water from the surrounding fields. During the reference period, the field received a substantial influx of water from the surroundings (+154 mm). This influx was
almost absent (+8 mm) during the first controlled drainage period. During the second controlled drainage period, a net outflux (−47 mm) from the field towards the surroundings was found. The change from a net influx to a net outflux is related to the elevated groundwater levels at the experimental field in the controlled drainage period.
3.2 Nutrient concentrations and loads
The measured nutrient concentrations (NO3–N, Ptot, PO4)
in tube drain effluent for the reference period and the con-trolled drainage period are shown in Fig. 6. During the ref-erence period, the NO3–N concentrations varied between ca.
6 mg N L−1in winter and 3 mg N L−1in summer. During the
controlled drainage period, higher NO3–N concentrations of
8–10 mg N L−1were recorded. The concentrations were well
above the surface-water quality standard of 2.3 mg N L−1
(Van der Molen et al., 2012). The NO3–N concentrations did
not directly respond to changes in the overflow levels of the drains. However, the NO3–N concentrations increased upon
the rewetting of the field and the increase of groundwater levels during November and December 2008. Although this increase in groundwater levels and NO3–N concentrations is
a common seasonal pattern, elevating the overflow levels of the tube drains further increased both the groundwater levels and NO3–N concentrations. The increase of NO3–N
concen-trations is related to the activation of near-surface NO3
–N-rich groundwater flow routes towards the tube drains. The
described autumn rewetting pattern is less clear in 2010, when a large precipitation event in August caused an imme-diate rewetting of the field and activation of NO3-rich tube
drainage.
For P, low concentrations were measured, both before and after the introduction of controlled drainage. Unlike NO3–N,
the P concentrations did not increase during rewetting in au-tumn. The low Ptotconcentrations are related to the P
immo-bilization in the tube drains due to adsorption to iron oxides (Van der Grift et al., 2014). During the 2010–2011 drainage season, the Ptotconcentrations did increase after lowering the
overflow levels with 50 cm and thereby increasing the drain effluent flow velocities. This caused uptake and transport of the P-rich iron oxides and higher P concentrations in the tube drain effluent.
The results of the SorbiCell average concentration mea-surements for the individual drains are shown in Fig. 7. The data show that the largest increase in NO3–N concentrations
occurred in drain 3. During the reference period, the efflu-ent from this drain showed NO3–N concentrations close to
zero. In the controlled drainage period, however, the NO3–N
concentrations were between the concentrations measured in drain 1 and 2.
Cumulative plots of the nutrient loads from the three drains are shown in Fig. 8, together with the cumulative precipita-tion and drain discharge. The NO3–N and P loads for
dis-tinct periods are given in Table 2. The first three periods in Table 2 give the loads for periods of a total year. Compar-ing both controlled drainage years (periods 2 and 3) with the reference (period 1) shows that the P loads were reduced af-ter introducing controlled drainage. The P-load/precipitation ratios were also lower for the controlled drainage periods 2 and 3 than for the reference period. For NO3–N; however, the
yearly NO3–N loads were higher in the controlled drainage
periods. This is related to the higher NO3–N concentrations
in drain effluent after the introduction of controlled drainage, especially in period 2.
Figure 8.Cumulative precipitation, drain discharge, and drain NO3–N and Ptotloads.
Table 2.Comparison of NO3–N and P loads in the combined discharge of three drains between distinct periods. Precipitation and the ratios
between loads and precipitation are also shown. The first three periods cover total years; the others compare shorter periods within the drainage season.
Period Drainage level Start End Precipitation NO3–N NO3–N load/ P load P load/
(mm) load Precipitation (g) Precipitation (kg) (kg mm−1) (g mm−1)
1 Reference 2 Nov 2007 2 Nov 2008 812 17.6 0.022 284 0.35
2 Controlled (+0–50 cm) 2 Nov 2009 2 Nov 2010 896 24.3 0.027 134 0.15
3 Controlled (+0–50 cm) 21 Apr 2010 21 Apr 2011 861 18.2 0.021 127 0.15
4 Reference 3 Dec 2007 12 Feb 2008 175 15.1 0.086 240 1.37
5 Controlled (+0–50 cm) 2 Dec 2009 12 Feb 2010 161 26.7 0.166 147 0.91
6 Reference 3 Sep 2008 19 Nov 2008 122 1.2 0.010 19 0.16
7 Controlled (+0 cm) 3 Sep 2010 17 Nov 2010 228 11.3 0.050 88 0.39
8 Reference 19 Nov 2007 1 Feb 2008 191 8.9 0.047 129 0.68
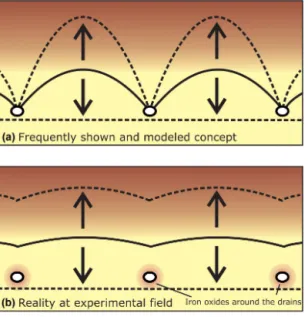
Figure 9.Comparison of (a)the common drainage concept with groundwater tables at the drain elevations and a large groundwa-ter curvature between individual drains and(b)the situation at the experimental field with groundwater tables above the drains and a small groundwater curvature between the drains.
period 9 in Table 2. Lowering the overflow levels, however, induced higher drainage flow and higher loads. For example, the nutrient loads were relatively high during a controlled drainage period with lowered overflow levels (period 7). In Fig. 8, the cumulative discharge and load rates of change be-come steeper after lowering the overflow levels.
4 Discussion
The monitoring results produced valuable insights in the hy-drological and hydrochemical effects of controlled drainage and in some practical issues for implementing controlled drainage and optimizing its effects in agricultural practice. First, the groundwater level monitoring revealed that on the pilot field (1) the groundwater levels were well above the drain levels during the winter drainage periods and (2) the groundwater curvature between the individual drains was limited (2–3 cm). In Fig. 9, the common drainage concept (e.g., De Vos et al., 2000) is compared with the situation at the experimental field. It is suggested that the ground-water discharge through the drains is limited due to an in-creased entrance resistance caused by the clogging of iron oxide around the drains. The formation of iron oxides around the water table and in tube drains is a known problem among farmers in the area and is related to reduced, iron-rich groundwater that is mixed with nitrate- and oxygen-containing infiltrating water. The kinetics of this iron oxida-tion process and its effect on P immobilizaoxida-tion were studied for the same pilot site by Van der Grift et al. (2014).
Figure 10.Transect-sketch of the effects of controlled drainage on groundwater levels in the experimental field.
From the groundwater level monitoring, a large difference was observed in the effect of controlled drainage between the piezometer transect at 5 m and at 80 m from the ditch. The less significant response of transect B is related to the dom-inant effect of direct drainage towards the ditch at 5 m dis-tance. For the area further away from the ditch, drainage via tube drains is dominant and the effects of elevating the over-flow levels are more significant. This concept, where most extra groundwater storage is realized further away from the ditch, is sketched in Fig. 10. Controlling the discharge and water levels in the ditch using a flexible weir would enhance the utilization of the groundwater storage capacity close to the ditch. Especially in areas with a dense network of open ditches, a combination of controlling both tube drain and open ditch discharges and water levels should be considered to increase the effectiveness of controlled drainage systems.
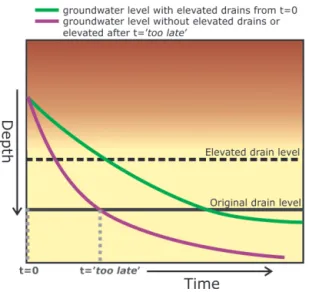
ma-Figure 11.The crucial timing of elevating the overflow levels of controlled drainage at the end of the drainage season. Water can be conserved when the drain outlets are elevated before the groundwa-ter levels are below the drains and the discharge has stopped.
nure spreading on 15 February, many livestock farmers are at or close to the maximum of their manure storage capacity. This forces them to apply manure in February and March, which may still be hampered by wet conditions, especially when the drainage is reduced by elevated overflow levels. A larger manure storage capacity could reduce the pressure for early manure applications and improve the effective use of controlled drainage systems to conserve water.
The introduction of controlled drainage did not reduce the NO3–N and P concentrations in the drain effluent. The NO3–
N concentrations even increased, although this was largely caused by elevated concentrations in one of the drains, which may or may not be related to controlled drainage. Due to the increased concentrations, the NO3–N loads increased after
introducing controlled drainage. The P loads reduced, which is related to the reduced drain discharge. However, the com-parison of water balances indicated that the reduced drain discharge is compensated by more overland flow and shallow groundwater flow, both to the surrounding fields and directly to the ditch. The increased contribution of these flow routes may increase the NO3–N and P loads to surface water. For
P, an average concentration of 0.65 mg L−1was observed in
overland flow in the Hupsel catchment (Rozemeijer and Van der Velde, 2014).
At the experimental field, the tube drains contributed 80 % of the total yearly water discharge to the surface water and 90 % of the total yearly NO3–N and P export (Rozemeijer
et al., 2010a). This relatively large contribution is related to poor natural drainage through the comparatively thin uncon-fined aquifer. The relative importance of the tube drain dis-charge for water and nutrient transport also results in a rela-tively large impact of the introduction of controlled drainage. In areas with lower contributions of tube drain discharge, the
surements enabled us to report detailed tube drain load pat-terns that could not have been measured by low-frequency grab sampling (see also Rozemeijer et al., 2010d). In addi-tion, the direct responses of discharge and nutrient concen-trations to the changes in overflow levels of the drains were measured. These responses would not have been captured by conventional grab sampling. The SorbiCell samplers were applied to measure average NO3–N concentrations for
indi-vidual drains. This information became important to under-stand the increase of the combined effluent NO3–N
concen-trations after introducing controlled drainage. This increase could largely be explained by the increased concentrations of effluent from one of the three drains and is not necessarily re-lated to the introduction of controlled drainage. The strategy of combining continuous water quality monitoring and pas-sive samplers for individual sources is applicable for other monitoring studies as well.
5 Conclusions
The experimental setup produced valuable insights in the hy-drological and hydrochemical effects of controlled drainage and in options to optimize the effects in agricultural practice. The introduction of controlled drainage effectively reduced the drain discharge and increased the groundwater storage in the studied field site. To achieve this, the overflow levels have to be elevated in early spring, before the drain discharge stops due to dryer conditions. The groundwater storage in the field would have been larger when the water levels in the adjacent ditch would have been controlled as well. The comparison of water balances before and after the introduction showed that the reduced drain discharge was partly compensated by more overland flow and shallow groundwater flow, both to the surrounding fields and directly to the ditch. Controlled drainage did not have clear positive effects for nutrient losses to surface water. The tube drains NO3–N concentrations and
pres-sure on manure application on dry fields directly after the end of the winter ban on manure spreading limits the optimal use of controlled drainage systems to conserve water in early spring.
Acknowledgements. The authors would like to thank Water Authority Rijn en IJssel for partially funding this study and especially Laurens Gerner, Annemarie Kramer and Bob van IJzen-doorn are acknowledged for their cooperation. We also thank land owner Wim Kimmels for allowing our experiments on his farmland.
Edited by: B. Kronvang
References
De Jonge, H. and Rothenberg, G.: New device and method for flux-proportional sampling of mobile solutes in soil and groundwater, Environ. Sci. Technol., 39, 274–282, 2005.
De Vos, J. A., Hesterberg, D., and Raats, P. A. C.: Nitrate leaching in a tile-drained silt loam soil, Am. J. Soil Sci. Soc., 64, 517–527, 2000.
Díaz, R. J. and Rosenberg, R.: Introduction to environmental and economic consequences of hypoxia, Int. J. Water Resour. D., 27, 71–82, 2011.
Evans, R. O., Skaggs, R. W., and Gilliam, J. W.: Controlled versus conventional drainage effects on water quality, J. Irrig. Drain. E.-ASCE, 121, 271–276, 1995.
Foley, J. A., DeFries, R., Asner, G. P., Barford, C., Bonan, G., Car-penter, S. R., Chapin, F. S., Coe, M. T., Daily, G. C., Gibbs, H. K., Helkowski, J. H., Holloway, T., Howard, E. A., Kucharik, C. J., Monfreda, C., Patz, J. A., Prentice, I. C., Ramankutty, N., and Snyder, P. K.: Global consequences of land use, Science, 309, 570–574, 2005.
Ghane, E., Fausey, N. R., Shedekar, V. S., Piepho, H. P., Shang, Y., and Brown, L. C.: Crop yield evaluation under controlled drainage in Ohio, United States, J. Soil Water Conserv., 67, 465– 473, 2012.
Heinen, M., Noij, I. G. A. M., Heesmans, H. I. M., Van Groenigen, J. W., Groenendijk, P., and Thissen J. T. N. M.: A Novel Method to Determine Buffer Strip Effectiveness on Deep Soils, J. Envi-ron. Qual., 41, 334–347, 2012.
Helmers, M., Christianson, R., Brenneman, G., Lockett, D., and Pederson, C.: Water table, drainage, and yield response to drainage water management in southeast Iowa, J. Soil Water Conserv., 67, 495–501, 2012.
Howarth, R. W.: Coastal nitrogen pollution: A review of sources and trends globally and regionally, Harmful Algae 8, 14–20, 2008. Jaynes, D. B.: Changes in yield and nitrate losses from using
drainage water management in central Iowa, United States, J. Soil Water Conserv., 67, 485–494, 2012.
Makarewicz, J. C., D’Aiuto, P. E., and Bosch, I.: Elevated nutrient levels from agriculturally dominated watersheds stimulate meta-phyton growth, J. Great Lakes Res., 33, 437–448, 2007. Rozemeijer, J. C. and Van der Velde, Y.: Temporal variability in
groundwater and surface water quality in humid agricultural catchments; driving processes and consequences for regional
water quality monitoring, Fund. Appl. Limnol., 184, 195–209, 2014.
Rozemeijer, J. C., Van der Velde, Y., Van Geer, F. C., Bierkens, M. F. P., and Broers, H. P.: Direct measurements of the tile drain and groundwater flow route contributions to surface water contamination: From field-scale concentration patterns in groundwater to catchment-scale surface water quality, Environ. Pollut., 158, 3571–3579, 2010a.
Rozemeijer, J. C., Van Der Velde, Y., McLaren, R. G., Van Geer, F. C., Broers, H. P., and Bierkens, M. F. P.: Integrated mod-eling of groundwater-surface water interactions in a tile-drained agricultural field: the importance of directly measured flow route contributions directly measured flow route contributions, Water Resour. Res., 46, W11537, doi:10.1029/2010WR009155, 2010b. Rozemeijer, J. C., Van der Velde, Y., De Jonge, H., Van Geer, F. C., Broers, H. P., and Bierkens, M. F. P.: Application and evalua-tion of a new passive sampler for measuring average solute con-centrations in a catchment-scale water quality monitoring study, Environ. Sci. Technol., 44, 1353–1359, 2010c.
Rozemeijer, J. C., Van der Velde, Y., Van Geer, F. C., De Rooij, G. H., Torfs, P., and Broers, H. P.: Improving load estimates for NO3and P in surface waters by characterizing the concentration
response to rainfall events, Env. Sci. Technol., 44, 6305–6312, 2010d.
Rozemeijer, J. C., Broers, H. P., Visser, A., Winegram, M., Bor-ren, W., Gerner, L., Van IJzendoorn, B., and Kramer, A.,: Vel-donderzoek naar de effecten van peilgestuurde drainage op grondwaterstanden, drainafvoeren en waterkwaliteit op het Oost-Nederlands Plateau, Deltares-report 1201979-000-BGS-0001, Utrecht, the Netherlands, Deltares, Utrecht, the Netherlands, 2012 (in Dutch).
Statham, P. J.: Nutrients in estuaries – an overview and the potential impacts of climate change, Sci. Total Environ., 434, 213–227, 2012.
Seitzinger, S. P., Mayorga, E., Bouwman, A. F., Kroeze, C., Beusen, A. H. W., Billen, G., Van Drecht, G., Dumont, E., Fekete, B. M., Garnier, J., and Harrison, J. A.: Global river nutri-ent export: a scenario analysis of past and future trends, Global Biogeochem. Cy., 24, GB0A08, doi:10.1029/2009GB003587, 2010.
Van der Grift, B., Rozemeijer, J. C., Griffioen, J., and van der Velde, Y.: Iron oxidation kinetics and phosphate immobi-lization along the flow-path from groundwater into surface water, Hydrol. Earth Syst. Sci., 18, 4687–4702, doi:10.5194/hess-18-4687-2014, 2014.
Van der Grift, B., Broers, H. P., Berendrecht, W. L., Rozemeijer, J. C., Osté, L. A., and Griffioen, J.: High-frequency monitoring re-veals nutrient sources and transport processes in an agriculture-dominated lowland water system, Hydrol. Earth Syst. Sci. Dis-cuss., 12, 8337–8380, doi:10.5194/hessd-12-8337-2015, 2015. Van der Molen, D. T., Pot, R., Evers, C. H. M., and Van
Nieuwer-burgh, L. L. J.: Referenties en maatlatten voor natuurlijke water-typen voor de Kaderrichtlijn Water 2015–2021, STOWA rapport-nummer 2012-31, STOWA, Amersfoort, the Netherlands, 2012 (in Dutch).
Quantifying the effect of catchment land use and water nutri-ent concnutri-entrations on freshwater river and stream biodiversity, Aquat. Conserv., 19, 104–112, 2009.
Wesström, I, and Messing, I.: Effects of controlled drainage on N and P losses and N dynamics in a loamy sand with spring crops, Agr. Water Manage., 87, 229–240, 2007.
Winegram, M.: Effects of controlled drainage in an agricultural watershed on water storage andnutrient transport by using time series analysis, MSc Thesis, VU Amsterdam, the Netherlands, 2012.
Woli, K. P., David, M. B., Cooke, R. A., McIsaac, G. F., and Mitchell, C. A.: Nitrogen balance in and export from agricultural fields associated with controlled drainage systems and denitrify-ing bioreactors, Ecol. Eng., 36, 1558–1566, 2010.