The Expression of Bone Morphogenetic
Protein 2 and Matrix Metalloproteinase 2
through Retinoic Acid Receptor Beta Induced
by All-Trans Retinoic Acid in Cultured
ARPE-19 Cells
Zhenya Gao1, Lijun Huo2, Dongmei Cui1, Xiao Yang1, Junwen Zeng1*
1State Key Laboratory of Ophthalmology, Zhongshan Ophthalmic Center, SunYat-sen University, No.54 South Xianlie Road, Guangzhou, 510060, P. R. China,2The First Affiliated Hospital, Sun Yat-sen University, No.58 Zhong Shan Er Road, Guangzhou 510080, P. R. China
*cier72@163.com
Abstract
Purpose
All-trans retinoic acid (ATRA) plays an important role in ocular development. Previous stud-ies found that retinoic acid could influence the metabolism of scleral remodeling by promot-ing retinal pigment epithelium (RPE) cells to secrete secondary signalpromot-ing factors. The purpose of this study was to investigate whether retinoic acid affected secretion of bone morphogenetic protein 2 (BMP-2) and matrix metalloproteinase 2 (MMP-2) and to explore the signaling pathway of retinoic acid in cultured acute retinal pigment epithelial 19 (ARPE-19) cells.
Methods
The effects of ATRA (concentrations from 10−9to 10−5mol/l) on the expression of retinoic acid receptors (RARs) in ARPE-19 cells were examined at the mRNA and protein levels using reverse transcription-polymerase chain reaction (RT-PCR) and western blot assay, respectively. The effects of treating ARPE-19 cells with ATRA concentrations ranging from 10−9to 10−5mol/l for 24 h and 48 h or with 10-6mol/l ATRA at different times ranging from 6h to 72h were assessed using real-time quantitative PCR (qPCR) and enzyme-linked immu-nosorbent assay (ELISA). The contribution of RARβ-induced activation of ARPE-19 cells was confirmed using LE135, an antagonist of RARβ.
Results
RARβmRNA levels significantly increased in the ARPE-19 cells treated with ATRA for 24h and 48h. These increases in RARβmRNA levels were dose dependent (at concentrations of 10−9to 10−5mol/l) with a maximum effect observed at 10−6mol/l. There were no signifi-cant changes in the mRNA levels of RARαand RARγ. Western blot assay revealed that OPEN ACCESS
Citation:Gao Z, Huo L, Cui D, Yang X, Zeng J (2016) The Expression of Bone Morphogenetic Protein 2 and Matrix Metalloproteinase 2 through Retinoic Acid Receptor Beta Induced by All-Trans Retinoic Acid in Cultured ARPE-19 Cells. PLoS ONE 11(3): e0150831. doi:10.1371/journal.pone.0150831
Editor:Alfred S Lewin, University of Florida, UNITED STATES
Received:November 19, 2015
Accepted:February 19, 2016
Published:March 11, 2016
Copyright:© 2016 Gao et al. This is an open access article distributed under the terms of theCreative Commons Attribution License, which permits unrestricted use, distribution, and reproduction in any medium, provided the original author and source are credited.
Data Availability Statement:All relevant data are within the paper.
Funding:This study was supported by National Natural Science Foundation of China (81170872 and 81200716),http://www.nsfc.gov.cn/. The funders had no role in study design, data collection and analysis, decision to publish, or preparation of the manuscript.
Competing Interests:The authors have declared
RARβprotein levels were increased significantly in a time-dependent manner in ARPE-19 cells treated with 10−6mol/l ATRA from 12 h to 72 h, with a marked increase observed at 24 h and 48 h. The upregulation of RARβand the ATRA-induced secretion in ARPE-19 cells could be inhibited by the RARβantagonist LE135.
Conclusion
ATRA induced upregulation of RARβin ARPE-19 cells and stimulated these cells to secrete BMP-2 and MMP-2.
Introduction
Myopia has become a major public health problem worldwide, with a prevalence ranging from 20–30% in North American and European populations to 80–90% in East Asian populations [1–4]. Recent studies have shown that retinoic acid (RA) can be synthesized and secreted by the retina and choroid and function as a biochemical signal [5], that plays an important role in the development and progression of axial myopia [6,7].
RA is a metabolic product of retinol, the active from of vitamin A, and interacts with two distinct types of intracellular proteins. In the cytoplasm, RA interacts with cellular retinoic-acid-binding proteins (CRABPs), which are primarily involved in the storage, intracellular transport and metabolism of RA [8]. In the nucleus, RA interacts mainly with two families of nuclear retinoid receptor proteins: retinoic acid receptors (RARs) and retinoid“X”receptors (RXRs). Both RARs and RXRs haveα,βandγsubtypes with different expression patterns in different cells and tissues [9]. RA exerts its biological functions primarily by binding to and activating specific nuclear receptors [10,11].
In our previous studies, we proved that ATRA and the retinoid signaling pathway contrib-ute to inhibition of human sclera fibroblast (HSF) proliferation through RARβ[12]. An increasing number of studies have found that RA can influence the scleral extracellular matrix and subsequently increase the size of the eye by stimulating retinal pigment epithelium (RPE) cells to secrete secondary signaling factors that signal the direction of ocular growth [6,7,13]. The purpose of the present study was to investigate whether RA affected secretion of bone mor-phogenetic protein 2 (BMP-2) and matrix metalloproteinase 2 (MMP-2) and to explore the sig-naling pathway of RA in cultured acute retinal pigment epithelial 19 (ARPE-19) cells
Materials and Methods
Ethics statement
No animal or protected plants were involved in this study, and the ecosystem was not compro-mised by the collection of experimental samples. This study did not harm the natural environ-ment or the health of humans.
Cell Culture and Cell Treatment
ml) (Invitrogen, Carlsbad, CA). Then, cells were incubated at 37°C in a humidified incubator containing 5% CO2. The medium was changed every two to three days. The cells were trypsi-nized for 2 minutes in an incubator with 0.25% trypsin /EDTA (Gibco) solution and subcul-tured at a split ratio of 1:4–6 in a 25-mm2plastic bottle (Corning Ltd., Lowell, MA) to achieve a heavy primary monolayer. The cells were cultured in 60-mm dishes (Corning) to 70–80% con-fluence for extracting proteins for western blot analysis, Cells were cultured in six-well plates (Corning) for RT-PCR or real-time PCR analysis.
ATRA (Sigma-Aldrich, USA) and LE135 (Tocris Bioscience, UK) were dissolved in dimethyl sulfoxide (DMSO, Sigma-Aldrich, USA) to a stock concentration of 10 mmol/l. ATRA was further diluted to the working concentration with DMEM/F12, before immediate use or until frozen in aliquots at -20°C, avoiding light. The cells preincubated with DMEM/F12 without FBS for 24 hours or were pretreated with 10−6mol/l LE135 for 24 hours. The medium
was then changed to ATRA, and the cells were incubated for the appropriate treatment time (0, 6, 12, 24, 48, 72 h) and concentration (0, 10−9, 10−8, 10−7, 10−6, 10−5mol/l). The cell culture
supernatants were collected and used for ELISA.
Cell Counting Kit-8 (CCK8) Assay
ARPE-19 cells were plated in 96-well plates at a density of 5,000 cells per well with 100μl of
complete culture medium. After preincubation for 24 hours in DMEM/F12 with 0.1% FBS, the cells were transfected with 10μl of ATRA at various concentrations (0, 10−9, 10−8, 10−7, 10−6,
10−5mol/l). Wells containing only culture medium served as blanks. After the plates were
incu-bated for 24 or 48 h, the supernatant was removed, and 100μl of DMEM /F12 containing 10μl
of CCK8 (Dojindo, Kumamoto, Japan) was added to each well. The plates were then incubated for another 1–4 hours at 37°C. The absorbance was measured at 450 nm using a microplate reader (PowerWave XS Microplate Spectrophotometer, Bio-Tek, USA). All experiments were repeated independently at least five times.
Total RNA Isolation, Reverse Transcription, and Real-Time PCR
Total RNA was isolated using a PureLinkTM RNA Mini Kit (Invitrogen, USA) according to the manufacturer’s instructions. The quantity and concentration of total RNA were assessed at 260 and 280 nm using Synergy H1 Hybrid Reader (BioTek, USA). Total RNA was stored at -80°C. A 1μg sample of total RNA was subsequently reverse transcribed for first-strand cDNA
synthesis using the PrimeScript RT Master Mix Perfect Real Time kit (TaKaRa, Japan) under following the conditions: 37°C for 15 min, immediately at 85°C for 5 sec, and then maintained at 4°C. The cDNA was diluted 1:1 and then subjected to RT-PCR and real-time PCR.
The oligonucleotide primer sequences used in RT-PCR to investigate transcript expression are listed inTable 1. The primers were designed using NCBI Pick Primers and were synthesized by InvitrogenTMCustom DNA Oligos (Life Technologies, USA). Each PCR was performed in a 25μl solution containing 1μl (10μmol /L) of each forward and reverse primer, 12.5μl of
Pre-mix Ex Taq DNA polymerase (TaKaRa, Japan), and 1μl of reverse transcription reaction
The primer pairs used in real-time PCR assays to investigated transcript expression are listed inTable 2. Real-time PCR was performed using a LightCycler 480 SYBR Green I Master and Roche LightCycler 480 real-time system. The real-time PCR reaction mixtures contained a total volume of 20μl, which included 12.5μl of SYBR Green I Master Mix, 1μl of forward and
reverse primers (10μmol/l), 2μl cDNA, and 6μl ddH2O. The real-time PCR programs were as follows: one cycle of 95°C for 5 min, followed by 45 cycles of 95°C for 10 s, annealing at 60°C for 10 s, and 72°C for 10 s. To complete the protocol, a melting curve was constructed using the following program: 95°C for 5 s, 65°C for 60 s, and 97°C while continuously collecting fluores-cence signals. Three independent experiments were performed for each sample. The relative gene expression levels were determined using the 2-ΔΔCt method.
Western Blot Analysis
Cells were washed three times with PBS at 4°C and then lysed in 150μl cold 1X RIPA lysis
buffer (CST, USA) supplemented with protease inhibitor cocktail tablets (Roche, Germany). The protein concentration was determined using a BCA Protein Assay Kit (Thermo Scientific, USA). Protein extracts were separated using 10% sodium dodecyl sulfate-polyacrylamide gels (SDS-PAGE), blotted on polyvinylidene difluoride (PVDF) membranes (Roche) and blocked with Tris-buffered saline with 0.05% Tween 20 (TBST) containing 5% nonfat milk. The mem-branes were then exposed to the following primary antibodies: rabbit polyclonal RARβ(Santa Cruz, USA) (1:700), rabbit polyclonal GAPDH (Proteintech, USA) (1:4000). Primary antibod-ies were diluted in TBST with 5% nonfat milk, and incubated overnight at 4°C. The membranes were washed in TBST, and then incubated with a secondary goat anti-rabbit lgG antibody (CST) conjugated with horseradish peroxidase at 1:3000 for one hour at room temperature. Finally, chemoluminescence signals were visualized with an ECL (Millipore, USA) imager, and analyzed using BIO-RAD Quantity One Imaging software (Bio-Rad, USA).
Enzyme-linked immunosorbent assay (ELISA)
ELISA kits for BMP-2 and MMP-2 were purchased from RayBiotech (Atlanta, USA). ELISAs were performed according to the manufacturer’s instructions. Experiments were performed in triplicate for concordant results.
Table 1. Primer sequences used in RT-PCR.
Gene GenBank number Primer sequences Product size(bp)
RARα NM_001024809.3 Forward: 5’-CTGCCAGTACTGCCGACTGC-3’Reverse: 5’-ACGTTGTTCTGAGCTGTTGTTCGTA-3’ 235
RARβ NM_016152 Forward: 5’-CAGGACCTTGACCAACCGACAA-3’Reverse: 5’-GAGAGGTAGCATTGATCCAGGA-3’ 210
RARγ NM_001042728.1 Forward: 5’-CTGCCAGTACTGCCGGCTAC-3’Reverse: 5’-TCTGCACTGGAGTTCGTGGTATACT-3’ 228
RXRα NM_002957 Forward: 5’-GGATCCCACACTTCTCAG-3’Reverse: 5’-GAGTCAGGGTTAAAGAGGAC-3’ 286
RXRβ NM_021976 Forward:5’-AGTACTGCCGCTATCAGAA-3’Reverse: 5’-GTTAGTCACAGGGTCATTTG-3’ 242
RXRγ NM_006917 Forward: 5’-CTACAGATACCCCAGTGA-3’Reverse: 5’-GGGTAGTTCATGTTTCCAAT-3’ 249
GAPDH1 NM_002046.3 Forward: 5’-GCTCAGACATGGGGAAGGT-3’Reverse: 5’-GTGGTGCAGGAGGCATTGCTGA-3’ 474
doi:10.1371/journal.pone.0150831.t001
Table 2. Primer sequences used in qRT-PCR.
Gene GenBank number Primer sequences Product size(bp)
RARβ NM_016152 Forward: 5’- CGTGGAGTTTGCTAAACGTCT-3’Reverse: 5’-TGGTGTCTTGTTCT GGGGTAT-3’ 134
BMP-2 NM_001200.2 Forward: 5’- CCCGACACTGAGACGCTGTTC-3’Reverse: 5’- GGGGAAGCAGCAACGCTAGAA-3’ 243
MMP-2 NM_004530.4 Forward: 5’- AGATCTTCTTCTTCAAGGACCGGT -3’Reverse: 5’- GGCTGGTCAGTGGCTTGGGGTA -3’ 225
GAPDH2 NM_002046.3 Forward: 5’- GATTCCACCCATGGCAAATT-3’Reverse: 5’- TCTCGCTCCTGGAAGATGGT-3’ 94
Statistical analysis
The quantitative data are expressed as the mean ± SD. The statistical significance of inter-group differences was determined with one-way analysis of variance (ANOVA) followed by Bonferro-ni’s multiple comparison test. Bartlett’s test was used to determine the homogeneity of variance. P values less than 0.05 were considered statistically significant (P<0.05,P<0.001).
Results
Effect of ATRA on the survival of ARPE-19 cells
ARPE-19 cells were treated with increasing concentrations of ATRA, from 10−9to 10−5mol/l,
to determine whether ATRA affected their survival. We found that ATRA caused a low level of apoptosis (<10%) at concentrations between 10−9and 10-6mol/l, whereas the cell morphology
remained normal. The cells were inhibited at 10-5mol/l, the highest concentration of ATRA tested (Fig 1A). Then, the effect of ATRA on ARPE-19 cells survival was evaluated by incubat-ing them with different concentrations of ATRA for 24h and 48 h usincubat-ing a CCK-8 (Fig 1B). At both 24 h and 48 h, ATRA inhibited cell survival in a dose- dependent manner. A small reduc-tion (<10%) in cell number also occurred with ATRA concentrations less than 10−6mol/l, but
the changes were not statistically significant (P>0.05). The cell survival rate was less than 50%
at both time points when the concentration of ATRA was 10-5mol/l.
Effect of ATRA on the expression of RAR
β
mRNA and protein
First, the expression of RARs and RXRs in ARPE-19 cells was detected at the genetic level using RT-PCR. We found that RARs were strongly expressed in ARPE-19 cells, whereas RXRs expression was not detected (Fig 2A and 2B). Next, ARPE-19 cells were treated with different concentration of ATRA (from 10−9to 10−5mol/l) for 24 hours identify the RA receptor
through which ATRA activated the signaling pathway in ARPE-19 cells. In the treated group, RARβmRNA levels increased after incubation with ATRA, when compared with the control group, and this increase was dose dependent with a maximal effect at 10−5mol/l. In contrast,
there were no significant changes in the RARαand RARγmRNA levels (Fig 2C and 2D). Finally, to quantify RARβexpression over time, RARβmRNA and protein were isolated at 6, 12, 24, and 48 h with 10−6mol/l ATRA. A significant increase in the RARβband intensity was
detected after the addition of ATRA at 24 h and 48 h (Fig 3).
Up-regulation of BMP-2 and MMP-2 expression in ARPE-19 cells
treated with ATRA
BMP-2 and MMP-2 expression were detected in ARPE-19 cells after treatment with 10-6mol/l ATRA for 6, 12, 24, 48, and 72 h using real-time PCR, western blot and ELISA. ATRA at 10−6
mol/l upregulated expression of BMP-2 mRNA and protein in ARPE-19 cells in time-depen-dent manner. There were no significant changes in BMP-2 mRNA in ARPE-19 cells after incu-bation with ATRA for 12 h (P>0.05), but BMP-2 mRNA levels were significantly increased
after incubation with 10−6mol/l ATRA for 48 h and 72 h (p<0.001) (Fig 4A). However, the
marked expression of MMP-2 mRNA was upregulated after being incubated with ATRA for 6 h, and peaked at 12 h and 24 h (P<0.001), but was downregulated to normal levels at 72h
10−6mol/l ATRA for 48 h and 72 h (p<0.05) (Fig 4C). The levels of MMP-2 protein and
mRNA was similar, and were significantly increased at 12 h (P<0.05) (Fig 4D).
ATRA-induced BMP-2 and MMP-2 expression are inhibited by the RAR
β
antagonist LE135
The correlation among BMP-2, MMP-2 and RARβin ARPE-19 cells treated with ATRA prompted us to investigate whether the increased expression of BMP-2 and MMP-2 might be secondary to an increased expression of RARβ. Therefore, we pre-treated the ARPE-19 cells with the RARβantagonist LE135 before ATRA treatment. As shown inFig 5, compared to the control, LE135 almost completely blocked the increased RARβexpression induced by ATRA
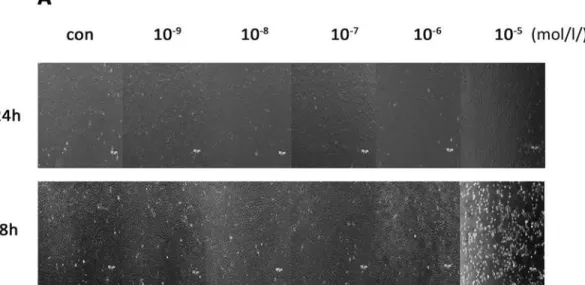
Fig 1. The Effect of ATRA on survival in ARPE-19 cells.ATRA caused a low level of apoptosis (<10%) at concentrations from 10−9to 10−6mol/l, but the cell morphology remained normal. The cells were inhibited at the highest concentration of ATRA treatment 10−5mol/l (Fig 1A). At both 24 h and 48 h, the cell proliferation was inhibited by ATRA in a dose-dependent manner. A small reduction (<10%) in the number of cells also occurred with a lower ATRA concentration of 10−6mol/l, but these changes were not statistically significant (P>0.05). When the ATRA concentration was 10−5mol/l, the cell survival rate was below 50% at both time points (Fig 1B).
both in the mRNA level and the protein level at 48h. The ATRA-induced increases in BMP-2 and MMP-2 expression were blocked by pre-treatment with LE135 (Fig 6).
Discussion
In the present study, ATRA caused a low level of apoptosis (<10%) at concentrations from
10−9to10-6mol/l, but cell morphology remained normal. These findings might be explained by
the low concentrations of ATRA we used in this study. We found that the survival of ARPE-19 cells was inhibited by ATRA in a dose-dependent manner, especially with an ATRA concentra-tion of 10−5mol/l and when the cells exposed to ATRA exhibited characteristic morphological
changes. This result is consistent with those in our previous report [14]. We then further inves-tigated the expression of RARs and RXRs in the 19 cells, which revealed that the ARPE-19 cells specifically expressed RARs mRNA; RXRs mRNA expression was not detected. Expo-sure to ATRA appeared to increase RARβmRNA levels in a dose-dependent manner, with a maximum effect at 10−6mol/l, and this increase was consistently matched with the increase in
RARβprotein levels. After treatment with ATRA, up-regulation of RARβprotein levels could be detected at 6 h, were significantly increased after 24 h (P<0.05), and showed the largest
increase at 72 h (P<0.001). Our finding that ATRA exposure led to an up-regulation of RARβ is in line with the results of previous experiments that investigated other cell types [15]. RA exerted its influence on mammalian cells by binding to and activating the transcriptional
Fig 2. RARs and RXRs expressions in ARPE-19 cells.RARs mRNA was strongly expressed in ARPE-19 cells, whereas RXRs expression was not detected (Fig 2A and 2B). RARβmRNA levels was increased after ATRA treatment when compared with controls. Expression of RARβmRNA was dose dependent with a maximal effect observed with 10−5mol/l ATRA. In contrast, there were no significant changes in the mRNA levels of RARαand RARγ (P>0.05) (Fig 2C and Fig 2D).
activity of specific nuclear receptors [9,16]. Furthermore, evidence from several studies indi-cates that RARβcan play a central role in regulating cell proliferation [10,17,18].
Previous studies clarified that ATRA could inhibit the growth of some cells by blocking at the G1 phase of the cell cycle, and ATRA exerted these effects primarily by modulating the expression of genes involved in G1-checkpoint regulation [19,20]. Those studies are in accord with our previous findings in HSF cells exposed to RA [21]. Many studies had shown that RA might contribute to the occurrence and progression of axial myopia. Endogenous levels of reti-nal-RA and choroidal/scleral-RA were clearly increased in form-deprivation myopia (FDM) in the chick and guinea pig [13,22]. Furthermore, intravitreal injection of disulfiram, an inhibitor of RA synthesis, reduced the degree of FDM [13]. Visual deprivation also produced an up-reg-ulation of the expression of RARβin the sclera of chicks [23] and retina of guinea pigs [24]. When the eyeball is rapidly elongated, as occurs in FD, the scleral thickness decreases [13]. However, previous studies indicated that factors originating in the retina that are related to the occurrence of axial myopia could not pass through the RPE-choroid without interruption to influence the sclera directly [25,26]. Thus, the RPE, which is interposed between the retina and the choroid, is likely critical in relaying retinal growth signals to the choroid and sclera. The
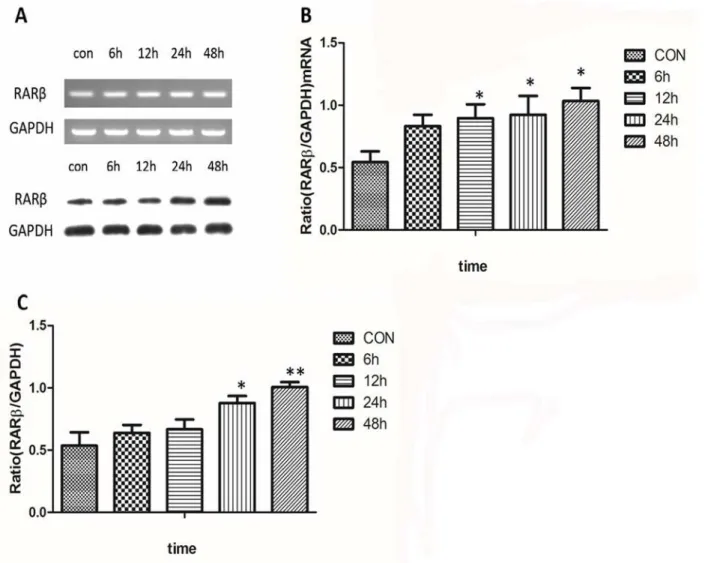
Fig 3. Time-related changes in expression of RARβmRNA and protein.A significant increase in the RARβband intensity was detected for both mRNA (Fig 3A and 3B) and protein (Fig 3A and 3C) at 24 h and 48 h after treatment with 10−6mol/l ATRA (P<0.05).
“local control theory of the retina”theory states that these retinal factors (such as RA) activate RPE cells and stimulate their release of secondary signaling factors (such as TGF-β, BMP-2, MMP-2) that regulate ocular growth and subsequently lead to axial myopia [27]. Thus, RPE cells may play a crucial role between the sclera and messengers from the retina.
In this study, we observed that the mRNA and protein levels of BMP-2 and MMP-2 in ARPE-19 cells were upregulated after treatment with 10−6mol/l ATRA, and this upregulation
could be blocked by LE135, a specific antagonist of RARβ. These results would confirm the the-ory described above.
The outer coating of the eyeball, the human sclera, consists of several types of collagens (e.g., type I, type III, type V), aggrecan and scleral fibroblast cells. As axial myopia progresses, the biomechanical properties of the sclera are altered, especially the posterior sclera. In the pos-terior sclera remodeling, it was characterized by changing the scleral extracellular matrix
Fig 4. BMP-2 and MMP-2 expression in ARPE-19 cells at different times points following ATRA treatment.ATRA at 10−6mol/l upregulated the expression of BMP-2 mRNA in ARPE-19 cells, and this effect was time dependent. There were no significant changes in BMP-2 mRNA in ARPE-19 cells after incubation with ATRA for 12 h, but the mRNA levels of BMP-2 were significantly increased after treatment with 10−6mol/l ATRA for 48 h and 72 h (p<0.001) (Fig 4A). However, the marked expression of MMP-2 mRNA was upregulated in ARPE-19 cells after incubation with ATRA at 10−6mol/l for 6 h, peaked at 12 h and 24 h (P<0.001), but was then down regulated to normal levels at 72 h (P>0.05) (Fig 4B). The expression levels of BMP-2 and MMP-2 protein were similar to the levels of those mRNA in ARPE-19 cells (Fig 4A and 4B). Cell supernatant from the cells treated with ATRA concentrations of 10−6 mol/l were analyzed by ELISA and compared with controls (medium with 0.1% DMSO). ATRA also upregulated the BMP-2 protein level in a time dependent manner. BMP-2 protein expression was significantly increased after the cells were treated with 10−6mol/l ATRA at both 48 h and 72 h (p<0.05) (Fig 4C). The MMP-2 protein level was similar to its mRNA level and was significantly increased at 12 h (P<0.05) (Fig 4D).
(ECM), such as decreasing collagen I, increasing levels of MMP-2 [28]. In previous studies, BMP-2, which belongs to the TGF-βsuperfamily, was detected in the human and guinea pig sclera. In addition, BMP-2 was reduced in the posterior sclera of FDM guinea pigs, which fur-ther indicates that BMP-2 influenced ECM and scleral reconstruction in progress of human myopia [29,30]. Scleral tissue is degraded during remodeling, which is partially regulated by MMPs and TIMPs [31]. MMP-2, an important member of the MMPs family, is a protein that is initially secreted as an inactive proenzyme and became an active enzyme by self-cleavage. MMP-2 expression was confirmed in the human sclera, and it was increased in the sclera of eyes with deprivation-induced axial myopia when compared with the control eyes in chicks and tree shrews [32,33]. In our previous study, we also found that HSF cells showed a
decreased 2 expression after incubation with BMP-2 [29]. Therefore, BMP-2 and MMP-2 are both important growth factors that influence HSF cells and are possibly involved in remodeling the sclera. Our findings also suggested that BMP-2 might play a key role in scleral remodeling during the progress of axial myopia. BMP-2 promoted the proliferation of HSF cells and altered expression of MMP-2 and TIMP-2[34].
Although we cannot concluded from the current findings that ATRA directly affects RPE cells, our observations certainly support the plausible hypothesis that ATRA was increased in ret-ina in axial myopia, where it activates RPE cells, and promotes their release of scleral remodeling factors (such BMP-2, MMP-2). These changes would subsequently disequilibrate sclera
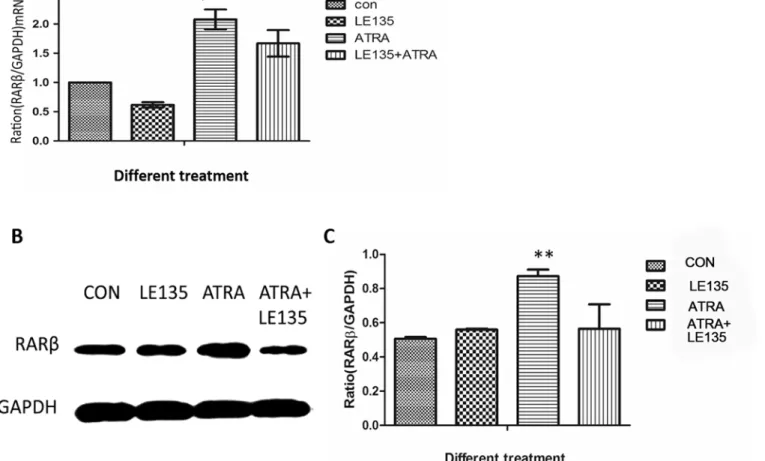
Fig 5. LE135 could block the pathway of RARβin ARPE-19 cells.Compared to the control, LE135 (10-6mol/l) could block the ATRA-induced increase in
RARβexpression at either the mRNA (P<0.05) (Fig 5A) or the protein level (P<0.001) (Fig 5B and 5C) at 48 h.
remodeling. As a result, the vitreous chamber would become elongated excessively and enable the progression of axial myopia. Previous studies revealed that ARPE-19 cells are similar to native RPE cells, but not identical [35,36], so we will confirm the results in native RPE cells in the future.
The findings of this study suggested that ATRA can promote BMP-2 and MMP-2 expres-sion in ARPE-19 cells through RARβ. This signaling pathway may play a critical role in the progression of axial myopia and is a potential candidate for myopia management.
Acknowledgments
This study was supported by National Natural Science Foundation of China (81170872 and 81200716)
Author Contributions
Conceived and designed the experiments: ZG LH DC JZ. Performed the experiments: ZG LH. Analyzed the data: ZG XY. Contributed reagents/materials/analysis tools: XY. Wrote the paper: ZG JZ. Obtained permission for use of cell line: JZ.
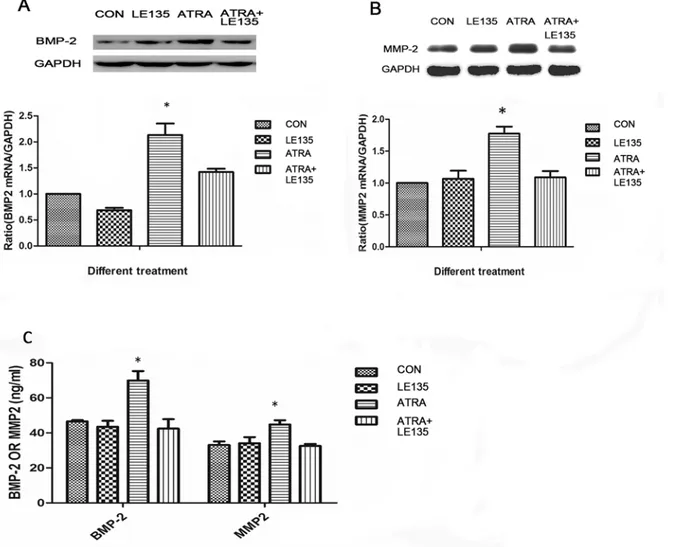
Fig 6. ATRA-induced BMP-2 and MMP-2 expression were inhibited by RARβ.The increased expression of BMP-2 and MMP-2 induced by ATRA were almost completely blocked by pre-treatment of the ARPE19 cells with LE135. ATRA at 10−6mol/l upregulated the expression of BMP-2 and MMP-2 on both mRNA and protein levels in ARPE-19 cells (P<0.05), but there were no significant changes after incubation with LE135 (10-6mol/l) or ATRA (10-6mol/l) added
to LE135 (10-6mol/l) (Fig 6A, 6B and 6C).
References
1. Morgan I., Rose K., How genetic is school myopia? Prog Retin Eye Res, 2005. 24(1): p. 1–38. doi:10. 1016/j.preteyeres.2004.06.004PMID:15555525.
2. Vitale S., Sperduto R.D., Ferris F.R., Increased prevalence of myopia in the United States between 1971–1972 and 1999–2004. Arch Ophthalmol, 2009. 127(12): p. 1632–9. doi:10.1001/
archophthalmol.2009.303PMID:20008719.
3. Lin L.L., Shih Y F, Hsiao C K, Chen C J., Prevalence of myopia in Taiwanese schoolchildren: 1983 to 2000. Ann Acad Med Singapore, 2004. 33(1): p. 27–33. PMID:15008558.
4. Pan C.W., Ramamurthy D., Saw S.M., Worldwide prevalence and risk factors for myopia. Ophthalmic Physiol Opt, 2012. 32(1): p. 3–16. doi:10.1111/j.1475-1313.2011.00884.xPMID:22150586.
5. Mertz J.R., Wallman J., Choroidal retinoic acid synthesis: a possible mediator between refractive error and compensatory eye growth. Exp Eye Res, 2000. 70(4): p. 519–27. doi:10.1006/exer.1999.0813 PMID:10866000
6. McFadden S.A., Howlett M H, Mertz J R, Wallman J., Acute effects of dietary retinoic acid on ocular components in the growing chick. Exp Eye Res, 2006. 83(4): p. 949–61. doi:10.1016/j.exer.2006.05. 002PMID:16797531.
7. Troilo D., Nickla D L, Mertz J R, Summers, Rada JA., Change in the synthesis rates of ocular retinoic acid and scleral glycosaminoglycan during experimentally altered eye growth in marmosets. Invest Ophthalmol Vis Sci, 2006. 47(5): p. 1768–77. doi:10.1167/iovs.05-0298PMID:16638980.
8. Si S.P., Tsou H C., Lee X., Peacocke M., Effect of cellular senescence and retinoic acid on the expres-sion of cellular retinoic acid binding proteins in skin fibroblasts. Exp Cell Res, 1995. 219(1): p. 243–8. doi:10.1006/excr.1995.1224PMID:7628539.
9. Chambon P., A decade of molecular biology of retinoic acid receptors. FASEB J, 1996. 10(9): p. 940–
54. PMID:8801176.
10. Geisen C., Denk C., Gremm B., Baust C., Karger A. Bollag W., et al., High-level expression of the reti-noic acid receptor beta gene in normal cells of the uterine cervix is regulated by the retireti-noic acid recep-tor alpha and is abnormally down-regulated in cervical carcinoma cells. Cancer Res, 1997. 57(8): p. 1460–7. PMID:9108446.
11. Pavan B., Biondi C., Dalpiaz A., Nuclear retinoic acid receptor beta as a tool in chemoprevention trials. Curr Med Chem, 2006. 13(29): p. 3553–63. PMID:17168722.
12. Huo L., Cui D., Yang X., Gao Z., Trier K., Zeng J., All-trans retinoic acid modulates mitogen-activated protein kinase pathway activation in human scleral fibroblasts through retinoic acid receptor beta. Mol Vis, 2013. 19: p. 1795–803. PMID:23946634.
13. McFadden S.A., Howlett M.H. and Mertz J.R., Retinoic acid signals the direction of ocular elongation in the guinea pig eye. Vision Res, 2004. 44(7): p. 643–53. PMID:14751549.
14. Li C., McFadden S.A., Morgan I., Cui D., Hu J., Wan W., et al, All-trans retinoic acid regulates the expression of the extracellular matrix protein fibulin-1 in the guinea pig sclera and human scleral fibro-blasts. Mol Vis, 2010. 16: p. 689–97. PMID:20405022.
15. Xu X.C., Liu X., Tahara E., Lippman S M., Lotan R., Expression and up-regulation of retinoic acid recep-tor-beta is associated with retinoid sensitivity and colony formation in esophageal cancer cell lines. Cancer Res, 1999. 59(10): p. 2477–83. PMID:10344761.
16. Mangelsdorf D.J., Evans R.M., The RXR heterodimers and orphan receptors. Cell, 1995. 83(6): p. 841–50. PMID:8521508.
17. Ju J., Wang N, Wang X, Chen F., A novel all-trans retinoic acid derivative inhibits proliferation and induces differentiation of human gastric carcinoma xenografts via up-regulating retinoic acid receptor beta. Am J Transl Res, 2015. 7(5): p. 856–65. PMID:26175847.
18. Cheung B., Hocker J. E., Smith S. A., Norris M. D., Haber M., Marshall G. M., Favorable prognostic sig-nificance of high-level retinoic acid receptor beta expression in neuroblastoma mediated by effects on cell cycle regulation. Oncogene, 1998. 17(6): p. 751–9. doi:10.1038/sj.onc.1201982PMID:9715277.
19. Qiao J., Paul P., Lee S., Qiao L., Josifi E., Tiao J. R., et al., PI3K/AKT and ERK regulate retinoic acid-induced neuroblastoma cellular differentiation. Biochem Biophys Res Commun, 2012. 424(3): p. 421–
6. doi:10.1016/j.bbrc.2012.06.125PMID:22766505.
20. Hu X.T., Zuckerman K.S., Role of cell cycle regulatory molecules in retinoic acid- and vitamin D3-induced differentiation of acute myeloid leukaemia cells. Cell Prolif, 2014. doi:10.1111/cpr.12100 PMID:24646031.
after carcinogen administration. Carcinogenesis, 2012. 33(2): p. 268–74. doi:10.1093/carcin/bgr275 PMID:22116467.
22. Seko Y., Shimokawa H., Tokoro T., In vivo and in vitro association of retinoic acid with form-deprivation myopia in the chick. Exp Eye Res, 1996. 63(4): p. 443–52. doi:10.1006/exer.1996.0134PMID: 8944551.
23. Bitzer M., Feldkaemper M., Schaeffel F., Visually induced changes in components of the retinoic acid system in fundal layers of the chick. Exp Eye Res, 2000. 70(1): p. 97–106. doi:10.1006/exer.1999. 0762PMID:10644425.
24. Huang J., Qu X.M., Chu R.Y., Research on retinoic acid signals in retina of guinea pig eyes with differ-ent monochromatic illumination. Zhonghua Yan Ke Za Zhi, 2011. 47(10): p. 938–43. PMID:22321506.
25. Rymer J., Wildsoet C.F., The role of the retinal pigment epithelium in eye growth regulation and myopia: a review. Vis Neurosci, 2005. 22(3): p. 251–61. doi:10.1017/S0952523805223015PMID:16079001.
26. Mao J.F., Liu S.Z., Dou X.Q., Retinoic acid metabolic change in retina and choroid of the guinea pig with lens-induced myopia. Int J Ophthalmol, 2012. 5(6): p. 670–4. doi:10.3980/j.issn.2222-3959.2012. 06.04PMID:23275899.
27. Heberlein U., Moses K., Mechanisms of Drosophila retinal morphogenesis: the virtues of being progres-sive. Cell, 1995. 81(7): p. 987–90. PMID:7600585.
28. McBrien N.A., Gentle A., Role of the sclera in the development and pathological complications of myo-pia. Prog Retin Eye Res, 2003. 22(3): p. 307–38. PMID:12852489.
29. Hu J., Cui D., Yang X., Wang S., Hu S., Li C., et al., Bone morphogenetic protein-2: a potential regulator in scleral remodeling. Mol Vis, 2008. 14: p. 2373–80. PMID:19098993.
30. Wang Q., Zhao G., Xing S., Zhang L., Yang X., Role of bone morphogenetic proteins in form-depriva-tion myopia sclera. Mol Vis, 2011. 17: p. 647–57. PMID:21403850.
31. Shelton L., Rada J.S., Effects of cyclic mechanical stretch on extracellular matrix synthesis by human scleral fibroblasts. Exp Eye Res, 2007. 84(2): p. 314–22. doi:10.1016/j.exer.2006.10.004PMID: 17123515.
32. Guggenheim J.A., McBrien N.A., Form-deprivation myopia induces activation of scleral matrix metallo-proteinase-2 in tree shrew. Invest Ophthalmol Vis Sci, 1996. 37(7): p. 1380–95. PMID:8641841.
33. Rada J.A., Brenza H.L., Increased latent gelatinase activity in the sclera of visually deprived chicks. Invest Ophthalmol Vis Sci, 1995. 36(8): p. 1555–65. PMID:7601636.
34. Gao Z.Y., Huo L.J., Cui D.M., Yang X., Wan W.J., Zeng J.W., Distribution of bone morphogenetic pro-tein receptors in human scleral fibroblasts cultured in vitro and human sclera. Int J Ophthalmol, 2012. 5 (6): p. 661–6. doi:10.3980/j.issn.2222-3959.2012.06.02PMID:23275897.
35. Ablonczy Z., Dahrouj M., Tang P.H., Liu Y., Sambamurti K., Marmorstein A.D., et al., Human retinal pig-ment epithelium cells as functional models for the RPE in vivo. Invest Ophthalmol Vis Sci, 2011. 52 (12): p. 8614–20. doi:10.1167/iovs.11-8021PMID:21960553.
36. Strunnikova N.V., Maminishkis A., Barb J.J., Wang F., Zhi C., Sergeev Y., et al., Transcriptome analysis and molecular signature of human retinal pigment epithelium. Hum Mol Genet, 2010. 19(12): p. 2468–