Abstract—The integration of communication technologies such as radio frequency identification (RFID), global positioning system (GPS), general packet radio system (GPRS), and geographic information system (GIS) with a camera are constructed for solid waste monitoring system. The aim is to improve the way of responding to customer’s inquiry and emergency cases and estimate the solid waste amount without any involvement of the truck driver. The proposed system consists of RFID tag mounted on the bin, RFID reader as in truck, GPRS/GSM as web-server, GIS as map server, database server and control server. The tracking devices mounted in the trucks collect location information in real-time via the GPS. This information is transferred continuously through GPRS to a central database. The users are able to view the current location of each truck in the collection stage via a web-based application, and thereby manage the fleet. The trucks positions and trash bin information are displayed on a digital map, which is made available by a map server. Thus, the solid waste of the bin and the truck are being monitored using the developed system.
Index Terms— Solid waste monitoring and management · GPS · RFID · GIS ·
I. INTRODUCTION
Generally, the solid waste is defined from household’s refusal and non-hazardous wastes. The non-hazardous solid wastes are from industrial, commercial and institutional establishments such as hospitals, market waste, yard waste and street sweepings [5]. However, all these types of solid waste are a problem worldwide. Specially, in the developing countries, waste management is becoming an acute problem for their urbanization and economic development.
Thus, solid waste management and monitoring requires immediate attention especially in countries such as China, South Korea and Malaysia which have been categorized as emerging industrialized countries [4].
In Malaysia, solid waste problem is one of the most severe
Maher Arebey · M A Hannan (⌂)· Huda Abdullah
Department of Electrical, Electronic and Systems Engineering Universiti Kebangsaan Malaysia,
Bangi ,43600, Selangor, Malaysia e-mail: [email protected]
Hassan Basri
Department of Civil and Structural Engineering Universiti Kebangsaan Malaysia,
Bangi ,43600, Selangor, Malaysia
R A Begum
Institute of Environment and Development Universiti Kebangsaan Malaysia,
Bangi ,43600, Selangor, MalaysiaManuscript received May 9, 2010.
environmental issues [6]. Other issues that have received extensive public attention are the haze and air emissions. These anthropogenic sources are generated from indiscriminate dumping of toxic and hazardous wastes, which being raised the sensitive issues both in terms of quantity and quality [20]. So to know details of the solid waste that affected Malaysian environmental and related issues, the solid waste planner, monitor and management requires comprehensive, reliable data and information’s on solid waste. However, the solid waste database in Malaysia is limited to manage the data by individual local authorities or waste contractors [10]. In order to deal with this great demand on data management, the advanced information technologies solutions such as RFID, GPRS, GPS and GPS must be utilized.
Solid waste management companies have been focusing for high technologies to solve some problems related to solid waste collection. For example, truck’s drivers may make a mistake or leave out some information due to few factors such as driver’s attitude and fatigue. The main problems of the existing solid waste collection process and management system are summaries as follows [3],[6],[15],[18].
Lack of the information about the collecting time and area.
Lack of the proper system for monitoring, tracking the trucks and trash bin that have been collected in real time.
There is no estimation to the amount of solid waste inside the bin and the surrounding area due to the scattering of waste.
There is no quick response to urgent cases like truck accident, breakdown, longtime idling.
There is no quick way to response to client's complaints about uncollected waste.
To solve the problems, RFID, GPRS and GPS, technologies could be used to reduce driver’s workload and confirm the position of the trucks [7]. The data of bin is recorded by the RFID tag. The recorded data is transmitted to the RFID reader, mounted on the truck. Thus, the system could realize whether the truck arrived to the bin location or not. Similar types of GPS based on bin system have been developed for identifying the bin and automatically reported to the control station server. This types of technologies used in the navigation system are matured, which ensures the system is practical, universal and with perfect function [17]. Moreover, with the existing system, it is hard to get all the facilities in time. Solid waste monitoring and management need accurate information to make good decision. To stimulate all these facilities, an effective and robust system is needed.
RFID and Integrated Technologies for Solid
Waste Bin
Monitoring System
Many companies in Malaysia paid attentions on remote sensing system. For example, Alam Flora has already started the truck monitoring and tracking system [1]. Truck monitoring and tracking requires real time truck location analysis to control solid waste collection process and improve truck efficiency [13]. To achieve the above requirements, this design has chosen the appropriate RFID and communication system modules on station reporting system. The entire system is used RFID system, GPS module, GPRS network and camera module to the IP-fixed control centre in the internet. The software in control server is able to analysis location of the trucks and estimates the waste in the bin and its surrounding area. The proposed system would be able to solve the mentioned problems with robust solution.
II.INTEGRATED TECHNOLOGIES
A.Radio Frequency Identification
RFID is a generic term that is designed to enable readers to capture data on tags and transmit it to a computer system without any physical connection. The auto-ID technologies have been used to reduce the amount of time and labor needed to input data manually and to improve data accuracy unlike conventional inventory systems. RFID technology is used in a wide range of applications worldwide including automotive, contactless payments, laundry, library, livestock, pharmaceutical, retail supply chain management and ticketing [11], [14]. With extensive research and development, RFID process system takes a step further by adding a new application category. RFID with integrated technologies, the proposed system would provide real time truck tracking and bin monitoring system.
B.Global Position System
GPS is a satellite-based navigation system formed by satellites placed into the orbit to record locations on the earth. The satellites periodically emit radio signal to GPS receivers to calculate distance and to compute two-dimensional or three-dimensional position. Today, GPS is extensively being used in motor vehicle for providing emergency road side assistance, determining the vehicle’s position on an electronic map display and helping drivers to keep track of their position. Modern systems automatically create a route and give turn-by-turn directions to designated locations [9]. GPS in this intelligent solid waste system is used for tracking the position of the truck and bin location.
C.GSM/GPRS Technology
GPRS is developed from the existing GSM system and can be associated with the INTERNET. It provides a link between mobile users and data network as well as high-speed wireless IP. GPRS used packet switching technology that can take up a number of wireless channels to transfer data at a rate up to 160 Kbps. Using GPRS technology; users can be always on line and pay the bill by flow. GPRS network has a wide coverage and can truly achieve real-time sending and receiving [8].
D.Geographic Information System
GIS integrates software and hardware for collecting, managing, analyzing the data and showing all forms of geographically information in a computer-based system. It
helps to analyze data visually and look patterns, trends, and relationships that might not be visible in tabular or written form. A GIS is different from other information systems, because it integrates common database operations such as query and statistical analysis with the advantages of visual and geographic analysis through maps [2],[12],[19]. Thus, GIS with the aid of control server, solid waste bin can be detect and monitors.
III. AUTOMATED TRUCK AND BIN FOR SOLID WASTE MONITORING SYSTEM
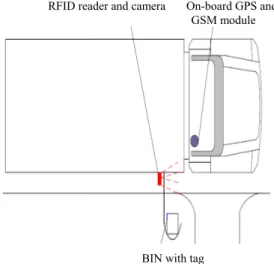
Typically, recording the collection process and estimating the area condition are a manual operation which is the responsibility of the truck driver. Although some of solid waste companies have involved GPS system to capture the time spent but they can not get the accurate bin information. However, manual operations can be misread, misreported, mistyped or left blank altogether. Furthermore, asking drivers to manually collect the data is a significant distraction to their main responsibility of driving. Figure 1 shows the tag attached with bin and RFID reader and camera associated with on-board GPS and GSM module are attached with truck for solid waste bin monitoring system.
RFID data and images can be automatically uploaded from the truck to the designated server via GPRS wireless connectivity. The upload process is automatically initiated when the truck comes within range of the RFID system and snapping the first image. The complete process is fully automated and requiring no action from the driver.
RFID reader and camera On-board GPS and GSM module
BIN with tag
Figure 1:The truck attached with RFID reader, GPS receiver and GSM module and the recycling bin attached with tag
IV. METHODS AND SYSTEM
to each bin in order to monitor and track the bin during the collection process. Low cost camera attached to the truck in order to get images. Once the truck enters within the bin area, the camera takes images before and after the bin collection, to estimate the waste of the bin and its surrounding area. The system is developed to be as compact, robust, energetically efficient and reliable as possible. Data from the truck network are recorded and forwarded to a control server through GPS GPRS system. The control server monitors the information and optimizes truck routes and bins location according to the waste estimation.
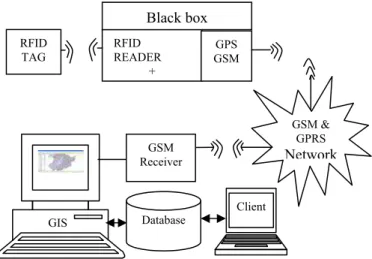
The proposed system is based on web-access architecture of a network for distributed bin and trucks. Three main layers of the proposed system are as RFID system and camera, the geographical information storage and the database management system and the control station for controlling the information access for making decision. The main role of the proposed system is to acquire data in real time from the truck and the camera to provide solid waste status of the bin and the truck position.
Figure 2: Architecture of solid waste monitoring and management system
Passive LF RFID tag is mounted on 120 L and 240 L bin, in order to the gather the serial number of the bin. LF RFID provides resistance to environmental influences. For example, Otsu's method is chosen the threshold to minimize the intra-class variance of the threshold black and white pixels. To make each cluster as tight as possible and minimizing the overlap. Obviously, the distribution cannot be changed, but the separation (the threshold) can be adjusted. As we adjust the threshold one way, we increase the spread of one and decrease the spread of the other. The goal then is to select the threshold that minimizes the combined spread. We can define the within-class variance as the weighted sum of the variances of each cluster. RFID reader and camera are mounted in the truck to capture the serial number of the truck and bin as well as image of the bin and forwarded to the control sever via GSM/GPRS network. When the truck comes closer to the bin RFID reader communicates with the RFID tag to capture the tags ID and other information about of the bin and sends it to the control server to ensure proper collection and management of waste. When the control server received the serial number, the system would to
receive the first image and compared it with the reference image that stored in database. After the collection process is done, the camera captures the second image. In this way, the actual content of the bin and its surrounding area can be estimated with high precision. The camera interfaced with RFID reader and placed on the top of the truck, can provide the shape and the area of the objects. Regarding the camera, a low resolution RGB camera mounted on top of the truck in position that can cover 3 m2 around the bin.
V.IMAGE ESTIMATION
The image estimation can be made to predict the quantity, the volume of the waste presented in the bin and the 3 m2 surrounding the bin [16]. Matlab is used to run the application enabling ports and interfaces to obtain process images. The image processing is based on motion detection methodology, which compares the reference image of the bin with receiving one in order to examine the status of the bin and measure the current waste that has been thrown around bin. Figure 3 shows RGB images of four bin statuses in which empty bin is considered as reference status of the bin.
Figure 3:RGB images of four bin status
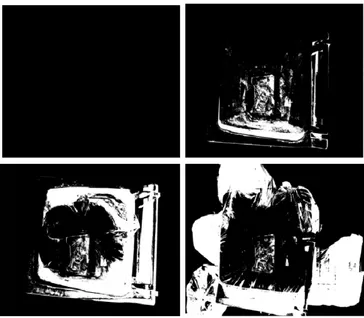
This RGB images are converted into grayscale images to make a comparison as shown in Figure 4. Then the RGB and gray scale images are subtracted in order to obtain the image of the differences between the two images. The image differences are then converted into a binary black/white image for further processing. The threshold for this procedure is calculated using the Otsu methodology. The Otsu’s methodology computes a global threshold level that can be used to convert an intensity image to a binary image as shown in Fig. 5. Level is a normalized intensity value that lies in the range (0, 1). The detail Otsu’s model are as follows;
) 1 ( ) ( ) ( ) ( ) ( )
( 2 2
2
T T n T T n T
within B B O O
Where
1
0 ) ( )
( T
i
B T p i
n
1 ( ) )
( N
T i
O T p i
n
GSM & GPRS Network RFID
READER +
GPS GSM Black box
GIS RFID TAG
GSM Receiver
nB (T) and nO (T) are the summation of image pixels p(i)
within the intensity level (0, T-1) and (T, N-1), respectively. σ2
B (T) and σ2O (T) are the variance of pixels in below threshold and above threshold, respectively.
For easy computation, between-class variance is used by subtracting the within-class variance from the total variance of combined distribution.
] ) ( )[ ( ] ) ( )[ (
) 2 ( )
( )
( 2 2
2
T T n T
T n
T within T
between
O O B
B
Where σ2 is the combined variance and μ is the combined mean. Notice that the between-class variance is simply the weighted variance of the cluster means around the overall mean. Substituting μ = nB(T)μB(T)+nO(T)μO(T) and simplifying equation (2);
) 3 ( )] ( ) ( )[ ( ) ( )
( 2
2
T T
T n T n T
between B O B O
Thus, for each potential threshold of T, the followings are needed to be considered.
Separate the pixels into two clusters according to the threshold.
Find the mean of each cluster.
Square the difference between the means.
Multiply by the number of pixels in one cluster times the number in the other.
Under the assumption and rationales about the development of the bin monitoring system, the data collected from the bin in different status are analyzed in order to address the information processing issue. The amount of waste is given by the intensity of gray image (0 to 255) that represents the difference between RGB and grayscale images. The collected data is affected by the position of camera and the truck stopping area because the reference image is taken in fixed position. Therefore, the second image must be taken in the same position to have accurate result. The subtraction process treats the same objects that exist in the reference image and received image but not in the same position as new objects. The amount of waste can be estimated and the result can be shown in the graphical user interface.
Figure 4:Grayscale images of four bin statuses
Figure 5:Binary images in four bin statuses
VI. RESULTS AND DISCUSSION
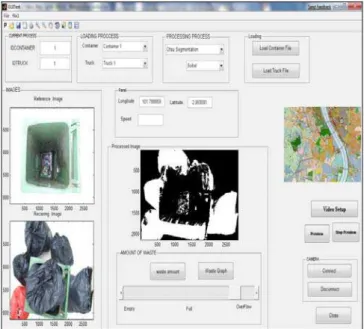
In this section, the image acquisition, the waste estimation and image analysis are discussed. The camera snapped the images and acquired in RGB format. The acquired data is then sent to the control server via GPRS wireless. All converting process carried out in the control server through graphical user interface (GUI) as shown in Figure 6. Figure 6 shows that estimation of bin status such as amount of waste, physical views of bin including truck position and timing is successfully achieved through GUI. Thus, operator can monitor the status of bin and stored it in database for future planning use. The waste estimation is analyzed from both gray and binary images.
Gray scale image represents an image as a matrix of bright and dark the pixels. There are two ways to represent the number of the brightness of the pixel such as double class and unit8. The double class assigns a floating number between 0 and 1 to each pixel presenting black and white pixels, respectively. On the other hand, unit8 class assigns an integer between 0 and 255 to represent the brightness of a pixel as shown in Fig. 7. The value 0 corresponds to black indicates no waste appears and 255 corresponds to white indicates full of waste. Computation of the class uint8 is faster compared to double, because unit8 requires roughly 1/8 of the storage than that of class double. Figure 7 shows that the intensity levels are varied from one image to another. For example, in default status i.e. empty bin, the whole image is represented by black pixel and no appearance to white pixels. Again, as the waste increased the number of black pixel decreased and intensity increased as shown in half, full and overflow bin status curve. The drop in the curves are noticeable between the full and overflow bin status. Thus, it can be concluded that the higher the intensity, higher the waste and lower the intensity, lower the waste. Thus, the image analysis of the developed system provided the status of the bin for monitoring and management.
second image must be taken in the same position to have accurate result. The subtraction process treats the same objects that exist in the reference image and received image. However, not in the same position as new object.
Figure 6:Estimation of bin status, amount of waste and truck position and timing in GUI
Intensity level
Figure 7:Analysis of grayscale images in three statuses of bin VII. CONCLUSION
In this paper, a new solution that integrates passive RFID, GPS tracking and low cost camera to enhance solid waste collection efficiency. The developed system provides improved performance on real-time bin status, estimation of solid waste amount and time and location of the truck service. The implementation of the system with graphical user interface is contributed to provide data about the trucks and the bin. The system is also contributed to reallocate the location of the bin from solid waste amount that have been thrown daily. Hence, the control server of the system can plan for better bin distribution cooperating with GIS and solid waste amount that can detected from the system. Thus, solid wastes bin, its status and truck timing and position can be manage and monitor using the developed system.
ACKNOWLEDGMENT
The authors are acknowledged this work for the financial support under the grant ukm-pts-003-2009.
REFERENCES
[1] Alam Flora. (2009).Towards a clean environment: A proposal on sustainable and integrated solid waste management system for universiti Kebangsaan Malaysia. Report from Alam Flora.
[2] Bin, W., Qingchao, A., Qulin, W. T. & Shonglin, Y. (2004). Integration of GIS, GPS and GSM for the Qinghai-Tibet Railway Information Management Planning. Proceedings of the Youth Forum on ISPRS Congress Istanbu, pp. 71-74.
[3] Chandravathani, S. ( 2006). Waste Reduction: No Longer An Option But A Necessity. Bernama,
http://www.bernama.com/bernama/v3/news lite.php?id=179384. [4] Fadel, A. A. (2006). Study to improve policies for municipal solid
waste in Malaysia. M. S. thesis, Department of Civil & Structural Engineering, Universiti Kebangsaan Malasyia.
[5] GAIA. (2003). Global Meeting Malaysia. Available http://www.noburn. org/ggm/gmcrep-my.html
[6] Hassan, M. N. Chong, T. L., & Rahman. M. M. (2005). Solid Waste Management-What’s The Malaysian Position. Seminar Waste to Energy, Universiti Putra Malaysia.
[7] Johansson, O. M. (2006). The effect of dynamic scheduling and routing in a solid waste management system. Waste Management, 26, 875–885.
[8] Kia, Q., Jianping, X., Gang, C., Linjian, W., & Jie, Q. (2008). The design of intelligent bus movement monitoring and station reporting system. IEEE International Conference on Automation and Logistics, pp. 209-216.
[9] Kumar, S. & Kevin, B. (2002). The Evolution of Global Positioning System (GPS) Technology. Journal of Science Education and Technology, 11, 59-80.
[10] Latifah, A., Mohd, A. A., & NurIlyana, M. (2009) . Municipal solid waste management in Malaysia: Practices and challenges. Waste Management, 29,2902-2906.
[11] Lee, C. M. & Chan, T. (2009). Development of RFID-based Reverse Logistics System. Expert Systems with Applications. 36, 9299-9307. [12] Ma, J. H., Zhang, Z. Y., Ren, Y., & Sun, M. C. (2002). Safety
application on radio frequency identification and communication based train control system in Qinghai-Tibet railway. Progress in Safety Science and Technology, Part A, 3, 772-777.
[13] Maher, A., Hannan, M. A., & Hassan. A. (2009). Solid Waste Monitoring and Management using RFID, GIS and GSM. Proceedings of 2009 Student Conference on Research and Development (SCOReD 2009), 16-18 Nov. 2009, UPM Serdang, Malaysia.
[14] Micro Invention Project. (2006). RFID and GPS Approach to effective estate operations: A Guide to effective manuring process. Available: http://micro.com.my/v1/product/RFID Solutions in Estate Operation 1.pdf.
[15] Ping, L. I., & Yang, S, H. (2006). Integrating GIS with the GeoEnviron Database System as a Robust Tool for Integrated Solid Waste Management in Malaysia. Available: http://www.gisdevelopment.net/ application/urban/products/ma08. html
[16] Rovetta, A., Fan , X., Vicentini, F., Zhu, M., Giusti, A., & He,Q. (2009), Early detection and evaluation of waste through sensorized containers for a collection monitoring application. Waste Management, 29, 2939-2949.
[17] Thomas, V. M. (2003). Product Self- Management: Evolution in Recycling and Reuse. Environmental Science and Technology, 37, 5297-5302.
[18] Vicentini, F. Giusti, A., Rovetta, A., Fan, X., He, Q., Zhu, M., & Liu, B. (2008). Sensorized waste collection container for content estimation and collection optimization. Waste Management.29, 1467-1472. [19] Wang, J. F., Zhang, Y., Cheng, Y. H., & Wang, H. S. (2002). Research
on the radio based cab signal system used for Qinghai-Tibet railway. Journal of the China Railway Society, 24(3), 112-117.
[20]World Bank. (1993). Malaysia – Managing Costs of Urban Pollution. Washington DC. World Bank Report, 11764-MA.