ACPD
15, 17945–17966, 2015Cold smoke
N. P. Lareau and C. B. Clements
Title Page
Abstract Introduction
Conclusions References
Tables Figures
◭ ◮
◭ ◮
Back Close
Full Screen / Esc
Printer-friendly Version Interactive Discussion
Discussion
P
a
per
|
Discussion
P
a
per
|
Discussion
P
a
per
|
Discussion
P
a
per
Atmos. Chem. Phys. Discuss., 15, 17945–17966, 2015 www.atmos-chem-phys-discuss.net/15/17945/2015/ doi:10.5194/acpd-15-17945-2015
© Author(s) 2015. CC Attribution 3.0 License.
This discussion paper is/has been under review for the journal Atmospheric Chemistry and Physics (ACP). Please refer to the corresponding final paper in ACP if available.
Cold smoke: smoke-induced density
currents cause unexpected smoke
transport near large wildfires
N. P. Lareau and C. B. Clements
Fire Weather Research Laboratory, San Jose State University, San Jose, California, USA Received: 13 April 2015 – Accepted: 02 June 2015 – Published: 02 July 2015
Correspondence to: N. P. Lareau ([email protected])
ACPD
15, 17945–17966, 2015Cold smoke
N. P. Lareau and C. B. Clements
Title Page
Abstract Introduction
Conclusions References
Tables Figures
◭ ◮
◭ ◮
Back Close
Full Screen / Esc
Printer-friendly Version Interactive Discussion
Discussion
P
a
per
|
Discussion
P
a
per
|
Discussion
P
a
per
|
Discussion
P
a
per
|
Abstract
First observations of smoke-induced density currents originating from large wildfires are presented. Using a novel mobile Doppler LiDAR and additional in situ measure-ments we document a deep (∼2 km) smoke-filled density current that propagates more
than 25 km at speeds up to 4.5 m s−1 near a large forest fire in northern California.
5
Based on these observations we show that the dynamics governing the spread of the smoke layer result from differential solar heating between the filled and smoke-free portions of the atmospheric boundary layer. A calculation of the theoretical density current speed agrees well with the observed propagation speed. Additional LiDAR and photographic documentation of other smoke-filled density currents demonstrate that
10
these previously unknown phenomena are relatively common near large wildfires and can cause severe and unexpected smoke inundation of populated areas.
1 Introduction
Smoke from forest fires adversely affects human health (Johnston et al., 2012), re-duces visibility, and alters the earth’s radiative energy balance (Penner et al., 1992).
15
The multi-scale atmospheric dynamics affecting smoke dispersion cause these smoke impacts to occur both close to, and far from, large wildfires. For example, when smoke becomes trapped in mountain valleys it can recirculate for many days (Robock, 1988, 1991), whereas when injected aloft it can cause downwind impacts 1000s of km away (Pahlow et al., 2005; Fromm et al., 2010). Despite advances in multi-scale smoke
trans-20
port modeling, forecasts for smoke dispersion continue to suffer from uncertainties in fire emissions, smoke injection depth, and the physics of fire-atmosphere interactions (Larkin et al., 2009; Goodrick et al., 2012). For example, numerical models struggle to predict smoke concentrations during complex synoptic-scale and topographic flow in-teractions, especially in narrow mountain valleys (Strand et al., 2012). Moreover, many
25
ACPD
15, 17945–17966, 2015Cold smoke
N. P. Lareau and C. B. Clements
Title Page
Abstract Introduction
Conclusions References
Tables Figures
◭ ◮
◭ ◮
Back Close
Full Screen / Esc
Printer-friendly Version Interactive Discussion
Discussion
P
a
per
|
Discussion
P
a
per
|
Discussion
P
a
per
|
Discussion
P
a
per
in smoke dispersion forecasts due to unresolved feedbacks between smoke and atmo-spheric circulations. These shortcomings are compounded by the lack of observational studies examining the physical processes and feedbacks that contribute to smoke dis-persion, especially in complex terrain.
A key component of fire-atmosphere interaction is smoke modification of the earth’s
5
radiative energy balance due to the scattering and absorption of solar and terrestrial radiation (Penner et al., 1992; Hobbs et al., 1997). For smoke of sufficient optical depth the reduction in downwelling short wave radiation causes a substantive decrease in daytime temperature, suppressed convective boundary layer growth, or even persistent near-surface temperature inversions (Robock et al., 1988; Segal et al., 1989; Garrett
10
et al., 1990). These effects are collectively known as smoke shading. Furthermore, since smoke minimally affects nocturnal infrared cooling, a strong positive feedback between nocturnal inversion duration and suppressed smoke dispersion can contribute to multi-week persistent inversions in mountain valleys (Robock, 1988, 1991). These inversions can subject communities to prolonged exposure to hazardous levels of small
15
particulate matter (e.g., PM2.5), which has been linked to a host of deleterious health
affects (e.g., Delfino et al., 2009; Wegesser et al., 2009; Holstius et al., 2012).
Smoke shading is also a hypothesized, but heretofore unobserved, mechanism for thermally-driven mesoscale circulations, which can strongly affect smoke dispersion (Segal and Arritt, 1992). These circulations are dynamically similar to sea breezes and
20
develop from spatial gradients in surface sensible heat flux (Segal and Arritt, 1992). The resulting difference in near surface air temperature induces thermally direct flow, the leading edge of which is often delineated by a mesoscale front. The propagation of these “mesofronts” is well described by density current theory (Simpson and Britter, 1980). Mesoscale circulations of this sort have been observed due to heterogeneous
25
inter-ACPD
15, 17945–17966, 2015Cold smoke
N. P. Lareau and C. B. Clements
Title Page
Abstract Introduction
Conclusions References
Tables Figures
◭ ◮
◭ ◮
Back Close
Full Screen / Esc
Printer-friendly Version Interactive Discussion
Discussion
P
a
per
|
Discussion
P
a
per
|
Discussion
P
a
per
|
Discussion
P
a
per
|
est because their flow characteristics are highly non-linear and can cause dispersion against the mean wind (Simpson, 1997).
In this paper we present first observations and analyses of smoke-induced den-sity currents,which are previously undocumented processes affecting smoke transport near large wildfires. Using a novel truck-mounted Doppler LiDAR, radiosonde system,
5
and automatic weather station (Clements and Oliphant, 2014) we show that these den-sity currents form due to differential solar heating between filled and smoke-free portions of the atmospheric boundary layer and can unexpectedly spread smoke counter to the ambient wind and over large distances (∼30 km). Based on these
obser-vations and additional photographic evidence, we propose that smoke-induced density
10
currents are relatively common near wildfires and must be considered for improved smoke dispersion forecasts and managing smoke impacts on communities.
2 The Bald and Eiler Fires
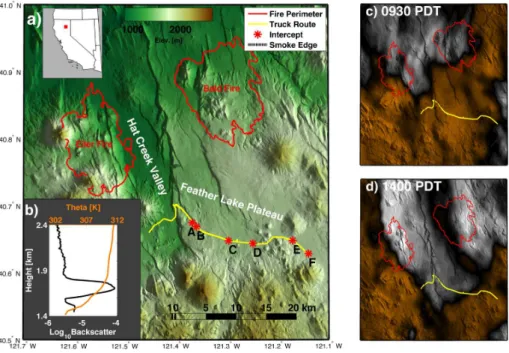
The primary focus of this study is a smoke-induced density current originating from the Bald and Eiler Fires, which burned in close proximity in northern California from
15
30 July–12 August 2014 (Fig. 1a). Both fires were started by lightning and grew quickly, producing towering convective plumes reaching depths in excess of 9 km. At night, when fire behavior moderated, smoke pooled in nocturnal temperature inversions form-ing within the broad, flat-bottomed Hat Creek Valley (Fig. 1a). For example, on the morning of 3 August, radiosonde and LiDAR data show thick smoke confined within
20
a 400 m, 7 K surface-based temperature inversion (Fig. 1b). Meanwhile, satellite im-ages indicate that the adjacent Feather Lake Plateau remained smoke free throughout the morning (Fig. 1c), allowing for significant differential solar heating between the two locales.
By midday this smoke-induced thermal contrast initiated a propagating density
cur-25
smoke-ACPD
15, 17945–17966, 2015Cold smoke
N. P. Lareau and C. B. Clements
Title Page
Abstract Introduction
Conclusions References
Tables Figures
◭ ◮
◭ ◮
Back Close
Full Screen / Esc
Printer-friendly Version Interactive Discussion
Discussion
P
a
per
|
Discussion
P
a
per
|
Discussion
P
a
per
|
Discussion
P
a
per
filled mesofront are traced from visible satellite images and in situ observations (dashed lines, Fig. 1a). Between local noon and 15:00 PDT the smoke spread more than 25 km, inundating a large area with optically thick smoke (Fig. 1d). Notably, the direction of smoke propagation was counter to the prevailing southerly flow aloft, which was as strong as 12.5 m s−1.
5
3 Observations of the density current
During its southeastward excursion across the Feather Lake Plateau the leading edge of the smoke-induced density current was intercepted 6 times with the truck-mounted Doppler LiDAR and instrumentation. The vertically pointed 1.5 µm LiDAR samples at
∼1 Hz using a range gate resolution of 18 m and a total range of 9.6 km. The LiDAR 10
backscatter is sensitive to aerosol in the size range of a few microns, e.g. PM2.5, and
thus provides high values of backscatter for forest fire smoke. The LiDAR also sam-ples the line-of-sight velocity at a resolution of∼1 cm s−1. A unique aspect of the truck
mounted LiDAR is the ability to sample in motion, thereby providing spatially and tem-porally resolved profiles of the atmospheric boundary layer, or in this case the structure
15
of a smoke-filled density current as it moved across the landscape. Further details of the observation platform, including the radiosonde system, are available in Clements and Oliphant (2014).
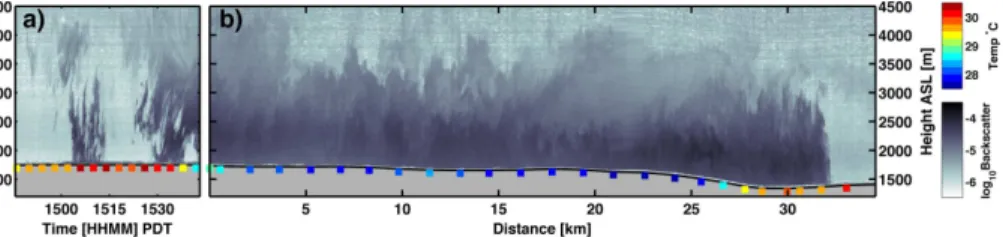
The density current intercept locations and corresponding LiDAR backscatter are shown in Figs. 1a, 2 and 3, respectively. Common to each intercept are the
canon-20
ical features of an atmospheric density current including a sharp frontal zone, ele-vated head, substantive temperature contrast, shallower following flow, and interfacial wave mixing (Britter and Simpson, 1978, 1979; Simpson and Britter, 1980; Simpson, 1997). For example, the near surface air temperature (colored squares, Fig. 2) sub-stantively decreases across the leading edge of the density current, which is defined
25
smoke-ACPD
15, 17945–17966, 2015Cold smoke
N. P. Lareau and C. B. Clements
Title Page
Abstract Introduction
Conclusions References
Tables Figures
◭ ◮
◭ ◮
Back Close
Full Screen / Esc
Printer-friendly Version Interactive Discussion
Discussion
P
a
per
|
Discussion
P
a
per
|
Discussion
P
a
per
|
Discussion
P
a
per
|
free boundary-layer. The backscatter in the clear air is nearly zero due to pristine con-ditions outside of the fire-modified environment.
The intercept sequence also reveals changes in the density current structure be-tween the onset, maturation, and eventual decay of the circulation. At the onset, the leading edge of the circulation is marked by an isolated smoke-filled updraft followed by
5
shallow near-surface flow (Fig. 2a and b). The density current circulation subsequently deepens as the smoke layer advances to the east-southeast. For example, at intercept C the head region is observed to broaden and deepen (Fig. 2c) and the Doppler veloc-ity data show increased vertical mixing (not shown). The increased mixing contributes to a more homogenous density current at intercept D (Fig. 2d), where the isolated
10
plume at the leading is no longer apparent and the following flow is deeper and better mixed.
Intercepts E (Fig. 2e) and F (Fig. 3a) reflect the slowing and eventual decay of the density current circulation. For example, at intercept E the leading edge of the density current develops an elevated nose wherein the foremost smoke is found aloft.
Labo-15
ratory experiments indicate that the height of the nose depends on comparative mag-nitude of the density current speed and surface frictional effects (Britter and Simpson, 1978; Simpson and Britter, 1979). In this case the density current advance is slowing, perhaps due to flow-topography interaction or a decrease in the negative buoyancy. The backscatter at intercept E also indicate an embedded front within the following
20
flow, suggesting that cleft and lobe instabilities cause portions of the front to laterally fold over on itself (Simpson, 1997; Mayor, 2011).
Finally, intercept F (Fig. 3a) corresponds with the foremost advance of the smoke layer, consistent with the satellite observations and the frontal isochrones in Fig. 1a. At that time the leading edge of the smoke layer was diffuse and ragged and as it drifted
25
multi-ACPD
15, 17945–17966, 2015Cold smoke
N. P. Lareau and C. B. Clements
Title Page
Abstract Introduction
Conclusions References
Tables Figures
◭ ◮
◭ ◮
Back Close
Full Screen / Esc
Printer-friendly Version Interactive Discussion
Discussion
P
a
per
|
Discussion
P
a
per
|
Discussion
P
a
per
|
Discussion
P
a
per
layered structure are noted and the truck temperature sensor indicates suppressed near surface temperatures throughout the smoke layer, with the coldest temperatures corresponding to the regions of the highest aerosol backscatter, indicative of smoke shading. The western edge of the smoke layer, and a corresponding increase in near surface temperature, was subsequently observed within the Hat Creek Valley.
5
3.1 Density current dynamics
In this section, the dynamics governing the advance of the smoke-induced density cur-rent are examined using additional LiDAR wind profiles and radiosonde data during the fourth intercept (Fig. 4). These data were obtained as the density current passed over the truck-mounted instrumentation, which had been parked in advance of the
propagat-10
ing smoke front. The wind profiles were collected every three minutes using a Doppler beam swinging technique (Lane et al., 2013). As we show below, these observations, when compared with laboratory experiments and theory, support our hypothesis that the observed smoke propagation is “self-induced” due to the thermal contrast resulting from smoke shading of the boundary layer.
15
3.1.1 Thermal structure
At the surface, the warmest air (29.3◦C) immediately precedes the leading edge of
the density current while the coldest air (26.4◦C) follows about 4 km (
∼17 min) behind
(colored squares, Fig. 4a). From the equation of state we compute that the observed temperature difference is equivalent to a ∼1 % increase in air density within the cold
20
smoke-filled layer. The source of the temperature contrast is the differential solar heat-ing between the smoke-free Feather Lake Plateau and the smoke-filled nocturnal in-version in the Hat Creek Valley. Similar cross-front temperature (i.e., density) gradients were observed during the first 4 intercepts, but decreased thereafter as the density current slowed and then came to rest.
ACPD
15, 17945–17966, 2015Cold smoke
N. P. Lareau and C. B. Clements
Title Page
Abstract Introduction
Conclusions References
Tables Figures
◭ ◮
◭ ◮
Back Close
Full Screen / Esc
Printer-friendly Version Interactive Discussion
Discussion
P
a
per
|
Discussion
P
a
per
|
Discussion
P
a
per
|
Discussion
P
a
per
|
Above the surface, the density current potential temperature profile exhibits a multi-layered stably-stratified structure (red line, Fig. 4a). The lowest 850 m of the flow is composed of cold, undiluted, smoke-filled air emanating from the Hat Creek Valley. The mean potential temperature deficit is∼2 K, indicating that the layer averaged density
contrast is somewhat less than that determined from the surface temperatures alone.
5
This result suggests that a shallow super-adiabatic layer preceding the arrival of the density current influences the near surface temperature gradient.
The second layer, which is ∼500 m deep, is linearly stratified and contains
inter-mediate smoke concentrations. The linear stratification and diluted smoke are due to wave-generated mixing of the scalar properties of the lowest layer with the warmer,
10
smoke-free air ahead of the advancing front. This wave-driven entrainment is visually apparent in the backscatter data during each of the intercepts and contributes to in-creasing smoke depth throughout the evolution of the density current.
The layer above the density current comprises smoke-free, neutrally stratified, and potentially warmer air in the ambient convective boundary layer. The density current
un-15
dercuts this layer as it spreads to the southeast. As is typical, the convective boundary layer is capped by a temperature inversion, which in this case acts as a semi-rigid lid on the system, making our environmental observations comparable to idealized labora-tory experiments of density currents propagating into neutrally stratified environments (Simpson and Britter, 1980).
20
3.1.2 Kinematic structure
The multi-layered structure of the density current is also observed in the front relative wind (vectors, Fig. 4a), which is computed by subtracting the mean motion of the front from the wind profiles. In the front relative reference frame, the lowest layer (i.e., the undiluted core) exhibits a coherent overtaking flow that exceeds the speed of the front.
25
The ratio of the overtaking speed to the front speed is∼1.3, reflecting a 6 m s−1flow
ACPD
15, 17945–17966, 2015Cold smoke
N. P. Lareau and C. B. Clements
Title Page
Abstract Introduction
Conclusions References
Tables Figures
◭ ◮
◭ ◮
Back Close
Full Screen / Esc
Printer-friendly Version Interactive Discussion
Discussion
P
a
per
|
Discussion
P
a
per
|
Discussion
P
a
per
|
Discussion
P
a
per
An opposing front-relative wind of ∼6 m s−1 is observed ahead of and above the
density current. In absolute terms, the near-surface flow is∼2 m s−1from the southeast
whereas the flow aloft is∼12.5 m s−1from the south. As such, it is clear that the smoke
layer moves in opposition to the ambient wind near the surface and at an approximately right angle to the flow aloft. This motion constitutes an unexpected spread of the smoke,
5
which is typically assumed to advect with the ambient wind.
The adjustment between the ambient flow in the undisturbed convective boundary layer and the flow within the density current occurs within the intermediary layer, which exhibits a sharply sheared wind profile and is dominated by front-relative rearward flow. This flow sweeps diluted smoke generated from wave-driven entrainment towards the
10
northwest and contributes to the deepening of the density current overtime.
The entrainment and mixing is most substantial in the density current head. There, the strong convergence between the overtaking flow and the opposing flow produces a 1 km long, 2 km deep, rearward sloping updraft (Fig. 4b). The maximum vertical veloc-ity is 8 m s−1, significantly exceeding typical vertical velocities in the convective
bound-15
ary layer and reflecting a major pathway for vertical mixing of smoke.
3.1.3 Speed of the front
The speed of the front is initially estimated from the location and timing of adjacent smoke front intercepts with the truck mounted instruments (Fig. 1a). For example, us-ing geometric considerations we determine that the front moved at an average speed
20
of∼4.6 m s−1 between intercepts C and D, but then slowed substantially as it passed
through intercept E, and eventually came to rest at intercept F, which marks the fore-most extend of the smoke layer near 15:00 PDT (Fig. 1a).
To test the hypothesis that the observed spread of the smoke layer results from the differential heating across the smoke front we compare the observed front speed
25
ACPD
15, 17945–17966, 2015Cold smoke
N. P. Lareau and C. B. Clements
Title Page
Abstract Introduction
Conclusions References
Tables Figures
◭ ◮
◭ ◮
Back Close
Full Screen / Esc
Printer-friendly Version Interactive Discussion
Discussion
P
a
per
|
Discussion
P
a
per
|
Discussion
P
a
per
|
Discussion
P
a
per
|
Mayor, 2011) given by
Vfront=C s
θ s−θa
θa
gH4−0.62·Vwind (1)
In Eq. (1) C is the internal Froude number (0.82), θs is the mean potential tempera-ture of the undiluted smoke layer (∼314 K), θa is the ambient potential temperature
(∼316 K), g is gravity,H4 is the depth of the undiluted layer (850 m), andVwind is the
5
ambient wind component opposing the frontal motion near the surface (2 m s−1). With
these values, the computed frontal speed is 4.7 m s−1, which closely matches the
esti-mated speed determined from the frontal displacement.
This important result demonstrates that the propagation of the smoke layer is at-tributable to the thermal contrast resulting from smoke shading and confirms the
10
hypothesis of Segal and Arritt (1992) that thick smoke can induce “non-classical” mesoscale circulations. As a corollary, we also conclude that unlike sediment driven density currents in other geophysical flows (e.g., turbidity currents, powder avalanches, etc.) (Simpson, 1997) the increase in density due to the mass of suspended smoke is minimally important to this circulation. This conclusion is reinforced by considering the
15
contributions to the negative buoyancy (B) of an air parcel, which, following Markowski and Richardson (2010), is given by
B≈
" θ
s−θa θa
+ R
Cp−
1
! P′
P − rs
#
g (2)
where the first term in the brackets is the thermal anomaly as in Eq. (1), the sec-ond term is the pressure perturbation, and the third term is the mixing ratio of
sus-20
pended particulates, in this case smoke (rs). From Eq. (2) it can be shown that
smoke loading of ∼10 g kg−1 is necessary to produce a density perturbation
ACPD
15, 17945–17966, 2015Cold smoke
N. P. Lareau and C. B. Clements
Title Page
Abstract Introduction
Conclusions References
Tables Figures
◭ ◮
◭ ◮
Back Close
Full Screen / Esc
Printer-friendly Version Interactive Discussion
Discussion
P
a
per
|
Discussion
P
a
per
|
Discussion
P
a
per
|
Discussion
P
a
per
Since, smoke concentrations are unlikely to significantly exceed 1000 µg kg−1
out-side of vigorous fire-generated updrafts (http://www.arb.ca.gov/smp/progdev/pubeduc/ smphfs0702.pdf; Trentmen et al., 2006), the suspended smoke is likely only important for its radiative effects and not its direct contribution to negative buoyancy.
4 Discussion
5
In this section we present additional observations of smoke-induced density currents near large wildfires. These data indicate that smoke-induced density currents are a sur-prisingly common feature of large multi-day forest fires. We also discuss the interaction of these density currents with other thermally-driven flows in complex terrain.
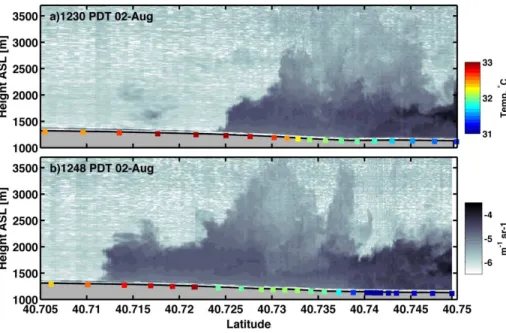
Figure 5 presents additional mobile LiDAR backscatter and truck air temperature
ob-10
servations obtained adjacent to the Eiler Fire on 2 August, the day before the density current examined in Sect. 3. These data show a north-to-south propagating filled layer accompanied by a 2 K thermal contrast between the free and smoke-filled portions of the boundary layer. Compared to the observations in Sect. 3, this smoke-layer possesses fewer distinct density current characteristics and propagates
15
over a more limited geographic extent. Nevertheless these data provide additional evi-dence for smoke shading as a mechanism to produce substantive horizontal gradients in the near surface temperature capable of driving mesoscale circulations that affect smoke transport.
Further, it is interesting to note that the density current timing on both 2 and 3 August
20
is similar (e.g., near noon), and we speculate that these density currents may superim-pose on thermally driven flow reversals from down valley to up valley winds. While we lack sufficient observations preceding the Bald and Eiler Fires to assess how smoke alters the strength and timing of these terrain driven flows, it stands to reason that the up valley afternoon flow will be enhanced due to the differential smoke shading
su-25
ACPD
15, 17945–17966, 2015Cold smoke
N. P. Lareau and C. B. Clements
Title Page
Abstract Introduction
Conclusions References
Tables Figures
◭ ◮
◭ ◮
Back Close
Full Screen / Esc
Printer-friendly Version Interactive Discussion
Discussion
P
a
per
|
Discussion
P
a
per
|
Discussion
P
a
per
|
Discussion
P
a
per
|
embedded in upslope flows in coastal topography, a superposition which is known to produce a stronger circulation than either processes acting independently (Mahrer and Peilke, 1977).
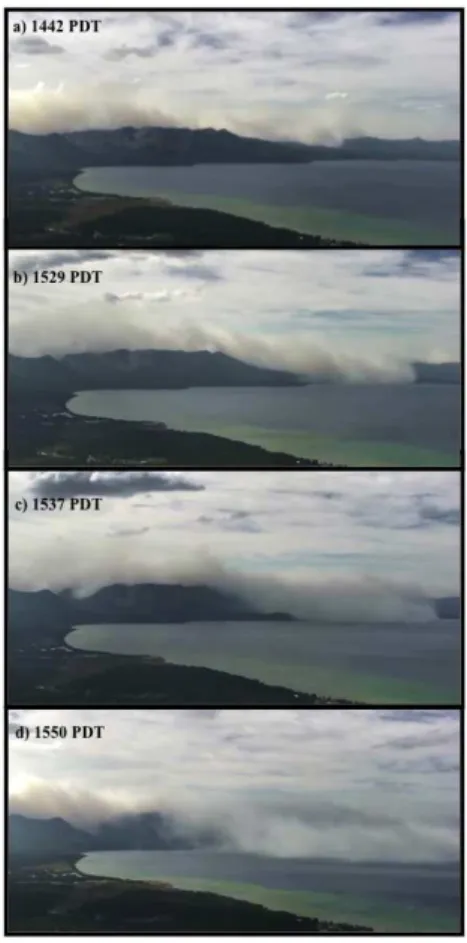
Additional evidence for the propensity for smoke-induced density currents and the interaction of density currents with diurnal mountain wind systems is presented in
5
Fig. 6, which shows a sequence of photographs extracted from a time lapse of a smoke-filled density current on 20 September 2014. In this instance the smoke layer spread more than 30 km from its source, the King Fire (http://inciweb.nwcg.gov/ incident/4108/), crossed the crest of California’s Sierra Nevada and propagated across Lake Tahoe. Inspection of the photographs and time-lapse animation (available at:
10
http://youtu.be/SLVKUEoMGwI) indicate the presence of canonical density current fea-tures at the leading edge of the smoke layer. The resulting smoke inundation of the Tahoe Basin forced the cancelation of a major sporting event due to hazardous levels of PM2.5 (http://www.ironman.com/triathlon/news/articles/2014/09/tahoe-cancellation. aspx#axzz3RIVH89F0).
15
Compared to the Bald and Eiler Fire cases, the King Fire density current is more clearly embedded within a larger-scale diurnal wind reversal. Satellite images show a widespread upslope southwesterly flow developing in the early afternoon of 20 September (not shown), which is likely a manifestation of the Washoe Zephyr, a thermally driven wind system that penetrates across the crest the Sierra Nevada
20
and becomes a downslope afternoon wind (Zhong et al., 2008). While this broader wind reversal is important in the displacement of the smoke layer, it is quite clear from the photographic sequence that the local spread characteristics are strongly affected by its density current dynamics. For example the leading edge of the layer advances to the southeast in opposition to the background synoptic-scale flow and exhibits a series
25
of lateral cleft and lobe instabilities.
com-ACPD
15, 17945–17966, 2015Cold smoke
N. P. Lareau and C. B. Clements
Title Page
Abstract Introduction
Conclusions References
Tables Figures
◭ ◮
◭ ◮
Back Close
Full Screen / Esc
Printer-friendly Version Interactive Discussion
Discussion
P
a
per
|
Discussion
P
a
per
|
Discussion
P
a
per
|
Discussion
P
a
per
prehensive studies of smoke-modified thermally-driven circulations in complex terrain have been conducted. The smoke-induced density currents examined in this study are likely just one manifestation of these smoke-shading effects, and more comprehensive assessment of smoke-modified boundary-layers is needed to better understand local transport of smoke from wildfires.
5
5 Conclusions
In this paper we have presented a set of novel observations of smoke-induced density currents and established that the driving mechanism in their propagation is the thermal difference due to reduced solar insolation beneath the smoke layer. Our results indicate that these self-propagating mesoscale fronts can cause severe and unexpected smoke
10
impacts, especially since their flow can oppose the ambient wind. Additional observa-tions indicate that smoke-induced density currents are relatively common near large multiday wildfires. Our findings also imply that smoke-modified boundary layers might contribute to changes in fire behavior that impact both firefighter and community safety. For example, smoke-induced density currents can contribute to rapid wind shifts,
dras-15
tic reductions in visibility, and delayed inversion breakup. Since smoke modeling and forecast tools typically neglect smoke radiative forcing they can not account for these phenomena, and due to the inability of satellites to resolve fine-scale boundary-layer processes there is a need for observational studies within the fire-modified environ-ment to improve our understanding of the broader range of smoke modified boundary
20
layers and other fire-atmosphere interactions and feedbacks.
Author contributions. C. Clements conceived the field campaign design, N. Lareau and C. Clements conducted the measurements and the collection of the data, N. Lareau led the data analysis and writing, and C. Clements provided contributions to the writing.
Acknowledgements. The photographs of the smoke-filled density current moving across Lake
ACPD
15, 17945–17966, 2015Cold smoke
N. P. Lareau and C. B. Clements
Title Page
Abstract Introduction
Conclusions References
Tables Figures
◭ ◮
◭ ◮
Back Close
Full Screen / Esc
Printer-friendly Version Interactive Discussion
Discussion
P
a
per
|
Discussion
P
a
per
|
Discussion
P
a
per
|
Discussion
P
a
per
|
The lidar, truck, and radiosonde data are available at http://blizzard.met.sjsu.edu/~nlareau/ density_current/. Satellite data is archived on the the Comprehensive Large Array data Stew-ardship System (CLASS) at www.class.noaa.gov. This research is supported under grant AGS-1151930 from the National Science Foundation.
References
5
Britter, R. E. and Simpson, J. E.: Experiments on the dynamics of a gravity current head, J. Fluid Mech., 88, 223–240, doi:10.1017/S0022112078002074, 1978.
Clements, C. B. and Oliphant, A. J.: The California State University mobile atmospheric profiling system: a facility for research and education in boundary layer meteorology, B. Am. Meteorol. Soc., 95, 1713–1724, doi:10.1175/BAMS-D-13-00179.1, 2014.
10
Delfino, R. J., Brummel, S., Wu, J., Stern, H., Ostro, B., Lipsett, M., Winer, A., Street, D. H., Zhang, L., Tjoa, T., and Gillen, D. L.: The relationship between respiratory and cardiovascular hospital admissions to the southern California wildfires of 2003, Occup. Environ. Med., 66, 189–197, doi:10.1136/oem.2008.041376, 2009.
Fromm, M., Lindsey, D. T., Servranckx, R., Yue, G., Trickl, T., Sica, R., Doucet, P., and
Godin-15
Beekmann, S.: The untold story of pyrocumulonimbus, B. Am. Meteorol. Soc., 91, 1193– 1209, doi:10.1175/2010BAMS3004.1, 2010.
Garrett, J. R., Pittock, A. B., and Walsh, K.: Response of the atmospheric boundary layer and soil layer to high altitude, dense aerosol cover, J. Appl. Meteorol., 29, 35–52, doi:10.1175/1520-0450(1990)029<0035:ROTABL>2.0.CO;2, 1990.
20
Goodrick, S. L., Achtemeier, G. L., Larkin, N. K., Liu, Y., and Strand, T.: Modeling smoke trans-port from wildland fires: a review, Int. J. Wildland Fire, 22, 83–94, doi:10.1071/WF11116, 2012.
Hobbs, P. V., Reid, J. S., Kotchenruther, R. A., Ferek, R. J., and Weiss, R.: Di-rect radiative forcing by smoke from biomass burning, Science, 275, 1176–1178,
25
doi:10.1126/science.275.5307.1777, 1997.
ACPD
15, 17945–17966, 2015Cold smoke
N. P. Lareau and C. B. Clements
Title Page
Abstract Introduction
Conclusions References
Tables Figures
◭ ◮
◭ ◮
Back Close
Full Screen / Esc
Printer-friendly Version Interactive Discussion
Discussion
P
a
per
|
Discussion
P
a
per
|
Discussion
P
a
per
|
Discussion
P
a
per
Johnston, F. H., Henderson, S. B., Chen, Y., Randerson, J. T., Marlier, M., Defries, R. S., Kinney, P., Dowman, D. M., and Brauer, M.: Estimated global mortality attributable to smoke from landscape fires, Environ. Health Persp., 120, 695–701, doi:10.1289/ehp.1104422, 2012. Johnson, R. H., Young, G. S., Toth, J. J., and Zehr, R. M.: Mesoscale weather effects
of variable snow cover over Northeast Colorado, Mon. Weather Rev., 112, 1141–1152,
5
doi:10.1175/1520-0493(1984)112<1141:MWEOVS>2.0.CO;2, 1984.
Lane, S. E., Barlow, J. F., and Wood, C. R.: An assessment of a three-beam Doppler li-dar wind profiling method for use in urban areas, J. Wind. Eng. Ind. Aerod., 119, 53–59, doi:10.1016/j.jweia.2013.05.010, 2013.
Larkin, N. K., O’Neill, S. M., Solomon, R., Raffuse, S., Strand, T., Sullivan, D. C., Krull, C.,
10
Rorig, M., Peterson, J., and Ferguson, S. A.: The BlueSky smoke modeling framework, Int. J. Wildland Fire, 18, 906–920, doi:10.1071/WF07086, 2009.
Mahrer, Y. and Pielke, R. A.: The effects of topography on sea and land breezes in a two-dimensional numerical model, Mon. Weather Rev., 105, 1151–1162, doi:10.1175/1520-0493(1977)105<1151:TEOTOS>2.0.CO;2, 1977.
15
Markowski, P. and Richardson, Y.: Mesoscale Meteorology in Midlatitudes, 430 pp., John Wiley and Sons, Chichester, West Sussex, UK, 2010.
Markowski, P. M., Rasmussen, E. N., Straka, J. M., and Dowell, D. C.: Observations of low-level baroclinity generated by anvil shadows, Mon. Weather Rev., 126, 2942–2958, doi:10.1175/1520-0493(1998)126<2942:OOLLBG>2.0.CO;2, 1997.
20
Mayor, S. D.: Observations of seven atmospheric density current fronts in Dixon, California, Mon. Weather Rev., 139, 1338–1351, doi:10.1175/2010MWR3374.1, 2011.
Pahlow, M., Kleissl, J., Parlange, M. B., Ondov, J. M., and Harrison, D.: Atmospheric boundary-layer structure observed during a haze event due to forest-fire smoke, Bound.-Lay. Meteorol., 115, 53–70, doi:10.1007/s10546-004-6350-z, 2005.
25
Penner, J. E., Dickinson, R. E., and O’Neill, C. S.: Effects of aerosol from biomass burning on the global radiation budget, Science, 256, 1432–1434, doi:10.1126/science.256.5062.1432, 1992.
Rife, D. L., Warner, T. T., Chen, F., and Astling, E. G.: Mechanisms for diurnal boundary layer circulations in the Great Basin Desert, Mon. Weather Rev., 130, 921–938,
doi:10.1175/1520-30
0493(2002)130<0921:MFDBLC>2.0.CO;2, 2002.
ACPD
15, 17945–17966, 2015Cold smoke
N. P. Lareau and C. B. Clements
Title Page
Abstract Introduction
Conclusions References
Tables Figures
◭ ◮
◭ ◮
Back Close
Full Screen / Esc
Printer-friendly Version Interactive Discussion
Discussion
P
a
per
|
Discussion
P
a
per
|
Discussion
P
a
per
|
Discussion
P
a
per
|
Robock, A.: Surface cooling due to forest fire smoke, J. Geophys. Res., 96, 2156–2202, doi:10.1029/91JD02043, 1991.
Segal, M. and Arritt, R. W.: Nonclassical mesoscale circulations caused by surface sen-sible heat-flux gradients, B. Am. Meteorol. Soc., 73, 1593–1604, doi:10.1175/1520-0477(1992)073<1593:NMCCBS>2.0.CO;2, 1992.
5
Segal, M., Weaver, J., and Purdom, J. F. W.: Some effects of the Yellowstone fire smoke plume on Northeast Colorado at the end of summer 1988, Mon. Weather Rev., 117, 2278–2284, doi:10.1175/1520-0493(1989)117<2278:SEOTYF>2.0.CO;2, 1989.
Simpson, J. E.: Gravity Currents: In the Environment and the Laboratory, 244 pp., Cambridge University Press, New York, 1997.
10
Simpson, J. E. and Britter, R. E.: The dynamics of the head of a gravity current advancing over a horizontal surface, J. Fluid Mech., 94, 477–495, doi:10.1017/S0022112079001142, 1979. Simpson, J. E. and Britter, R. E.: A laboratory model of an atmospheric mesofront, Q. J. Roy.
Meteor. Soc., 106, 485–500, doi:10.1002/qj.49710644907, 1980.
Strand, T. M., Larkin, N., Craig, K. J., Raffuse, S., Sullivan, D., Solomon, R., Rorig,
15
M., Wheeler, N., and Pryden, D.: Analyses of bluesky gateway PM2.5 prediction during the 2007 southern and 2008 northern California fires, J. Geophys. Res., 117, D17301, doi:10.1029/2012JD017627, 2012.
Trentmann, J., Luderer, G., Winterrath, T., Fromm, M. D., Servranckx, R., Textor, C., Herzog, M., Graf, H.-F., and Andreae, M. O.: Modeling of biomass smoke injection into the lower
strato-20
sphere by a large forest fire (Part I): reference simulation, Atmos. Chem. Phys., 6, 5247– 5260, doi:10.5194/acp-6-5247-2006, 2006.
Wegesser, T. C., Pinkerton, K. E., and Last, J. A.: California wildfires of 2008: coarse and fine particulate matter toxicity, Environ. Health Persp., 117, 893–897, doi:10.1289/ehp.0800166, 2009.
25
ACPD
15, 17945–17966, 2015Cold smoke
N. P. Lareau and C. B. Clements
Title Page
Abstract Introduction
Conclusions References
Tables Figures
◭ ◮
◭ ◮
Back Close
Full Screen / Esc
Printer-friendly Version Interactive Discussion
Discussion
P
a
per
|
Discussion
P
a
per
|
Discussion
P
a
per
|
Discussion
P
a
per
Figure 1.Overview of the smoke-induced density current on 3 August 2014.(a) Map of the regional topography (shaded and shadowed), the Bald and Eiler Fire perimeters (red lines), smoke front isochrones (dashed black lines labeled in PDT), density current intercept locations (lettered red stars), and driving route (yellow line).(b)Vertical profile of potential temperature (orange) and LiDAR backscatter (m−1
sr−1
, black) from the Hat Creek Valley at 09:00 PDT.(c–d)
ACPD
15, 17945–17966, 2015Cold smoke
N. P. Lareau and C. B. Clements
Title Page
Abstract Introduction
Conclusions References
Tables Figures
◭ ◮
◭ ◮
Back Close
Full Screen / Esc
Printer-friendly Version Interactive Discussion
Discussion
P
a
per
|
Discussion
P
a
per
|
Discussion
P
a
per
|
Discussion
P
a
per
|
Figure 2.Lidar backscatter (shading, m−1sr−1) and near surface temperature (colored squares)
for density current intercepts A–E. Times, in PDT, correspond to the center of the time range in each panel. The data for intercept D where recorded while the truck was stationary, but have been mapped to the spatial coordinate using the estimated frontal speed of 4.6 m s−1. All
ACPD
15, 17945–17966, 2015Cold smoke
N. P. Lareau and C. B. Clements
Title Page
Abstract Introduction
Conclusions References
Tables Figures
◭ ◮
◭ ◮
Back Close
Full Screen / Esc
Printer-friendly Version Interactive Discussion
Discussion
P
a
per
|
Discussion
P
a
per
|
Discussion
P
a
per
|
Discussion
P
a
per
|
Figure 4.The anatomy of the smoke-induced density current during intercept D at 14:02 PDT.
(a) Logarithmic attenuated backscatter (m−1sr−1) overlaid with the LiDAR derived front
ACPD
15, 17945–17966, 2015Cold smoke
N. P. Lareau and C. B. Clements
Title Page
Abstract Introduction
Conclusions References
Tables Figures
◭ ◮
◭ ◮
Back Close
Full Screen / Esc
Printer-friendly Version Interactive Discussion
Discussion
P
a
per
|
Discussion
P
a
per
|
Discussion
P
a
per
|
Discussion
P
a
per
Figure 5.Lidar backscatter (m−1sr−1) during two successive density current intercept on 2
ACPD
15, 17945–17966, 2015Cold smoke
N. P. Lareau and C. B. Clements
Title Page
Abstract Introduction
Conclusions References
Tables Figures
◭ ◮
◭ ◮
Back Close
Full Screen / Esc
Printer-friendly Version Interactive Discussion
Discussion
P
a
per
|
Discussion
P
a
per
|
Discussion
P
a
per
|
Discussion
P
a
per
|