Model for Quantitative Evaluation of Enzyme Replacement Treatment
Radeva B.
University Children’s Hospital, Sofia, Bulgaria
Summary: Gaucher disease is the most frequent lysosomal disorder. Its enzyme replacement treatment was the new progress of modern biotechnology, successfully used in the last years. The evaluation of optimal dose of each patient is important due to health and economical reasons. The enzyme replacement is the most expensive treatment. It must be held continuously and without interruption. Since 2001, the enzyme replacement therapy with Cerezyme*Genzyme was formally introduced in Bulgaria, but after some time it was interrupted for 1–2 months. The dose of the patients was not optimal. The aim of our work is to find a mathematical model for quantitative evaluation of ERT of Gaucher disease. The model applies a kind of software called “Statistika 6” via the input of the individual data of 5-year-old children having the Gaucher disease treated with Cerezyme. The output results of the model gave possibilities for quantitative evaluation of the individual trends in the development of the disease of each child and its correlation. On the basis of this results, we might recommend suitable changes in ERT.
Keywords: Mathematical model, Enzyme replacement therapy, Gaucher disease
1. INTRODUCTION
Gaucher disease is the most frequent lysosomal disease. The enzyme replacement treatment is a new biotechnology used with success around the world last year. The method was introduced in Bulgaria by B. Radeva in 1994. Since 2001 the treatment with Cerezyme/Gerezyme is formally registered for use [1-3]. This is one of the most expensive biotechnologies and the price of the drug is higher. The treatment with ERT must be continuous and without interruption. The patient needs optimal doses of Cerezyme. But during the treatment in the period 2001-2006, it has been interrupted several times for 1–2 months, and the doses have been deleted.
The aim of our work is to find a mathematical model for quantitative evaluation of ERT of patients with Gaucher disease.
2. MATERIALS AND METHODS
University Children’s Hospital, Sofia. Twice per month, patients received infusion with Cerezyme/Genzyme in different doses. RVT,
4 flacons x200 Uniinfusion per infusion (16 mg⋅kg-1) and K.P.D.5
flacons x200 Units per infusion (25 mg⋅kg-1). Before and during the
treatment biomarkers were used for monitoring the complete blood count: haemoglobin, leucocytes, platelets, the measure of liver and spleen, and acid phosphatase and chitotriosidase.
With methods for investigation on time series, the model applies the Origin 6 [5] and Statistika 6 [4] software programs with their input being the individual data of children with Gaucher disease for quantitative evaluation the individual tendency in the development of the disease of each child and its correlation. On the basis of these results, we were able to recommend suitable changes in ERT.
3. RESULTS
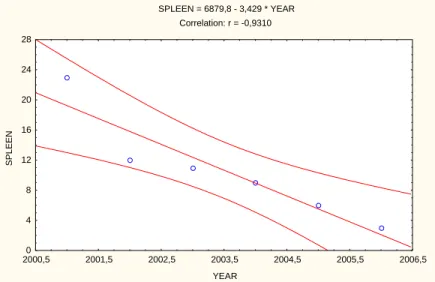
The results showed a positive tendency of decreasing of spleen dynamics in the first patient. Spleen = 6879.8 – 3.429*year and correlation R2 = -0.9310 (Fig. 1).
SPLEEN = 6879,8 - 3,429 * YEAR
Correlation: r = -0,9310
YEAR
SPLEEN
0 4 8 12 16 20 24 28
2000,5 2001,5 2002,5 2003,5 2004,5 2005,5 2006,5
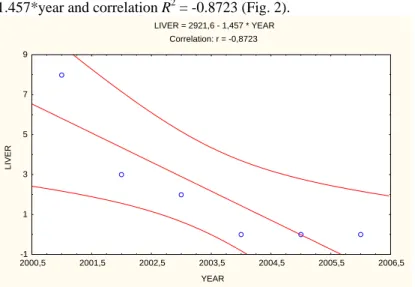
Similar dynamics were exhibited for the liver. Liver = 2921.6 – 1.457*year and correlation R2 = -0.8723 (Fig. 2).
LIVER = 2921,6 - 1,457 * YEAR Correlation: r = -0,8723
YEAR
L
IVER
-1 1 3 5 7 9
2000,5 2001,5 2002,5 2003,5 2004,5 2005,5 2006,5
Fig. 2 Tendency of the liver dynamics
Haemoglobin showed a positive tendency of increasing of level dynamics. Haemoglobin = -1511 + 76000*year and correlation R2=0.893 (Fig. 3).
HEMOGLOBIN = -1511, + ,76000 * YEAR
Correlation: r = 0,87930
YEAR
H
E
M
OGLOBI
N
8,5 9,5 10,5 11,5 12,5 13,5 14,5
2000,5 2001,5 2002,5 2003,5 2004,5 2005,5 2006,5
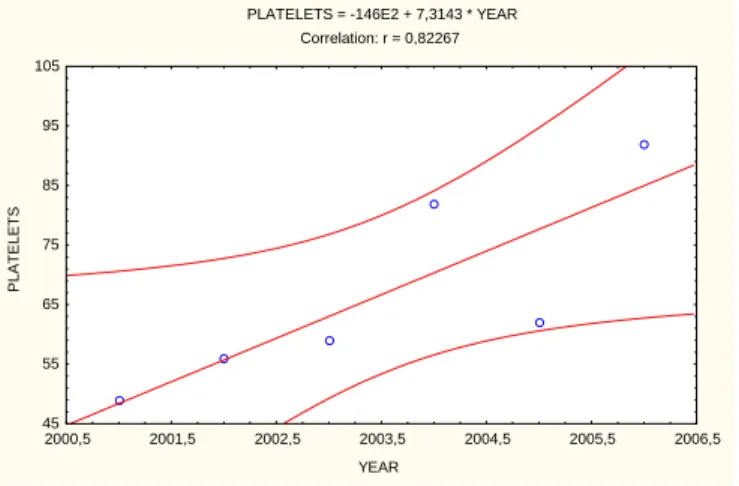
Platelets of the first patient also showed a positive tendency of
dyna-mics. Platelets = -146E2+7.3143*year and R2 = 0.82267 (Fig. 4).
PLATELETS = -146E2 + 7,3143 * YEAR Correlation: r = 0,82267
YEAR
PLATELETS
45 55 65 75 85 95 105
2000,5 2001,5 2002,5 2003,5 2004,5 2005,5 2006,5
Fig. 4 Tendency of the platelets dynamics
The first patient had a positive tendency of leukocytes dynamics. leukocytes = -207.6 + 10571*year and with lower correlation R2 = 0.22903 (Fig. 5).
LEUCOCYTES = -207,6 + ,10571 * YEAR Correlation: r = 0,22903
YEAR
LEUCOCYT
E
S
2,8 3,2 3,6 4,0 4,4 4,8 5,2 5,6
2000,5 2001,5 2002,5 2003,5 2004,5 2005,5 2006,5
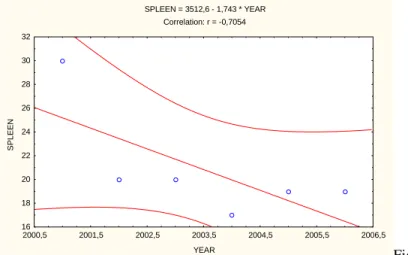
The second patient showed a positive tendency of decreasing the spleen dynamics. Spleen = 3512.6 – 1.743*year and correlation R2 = -0.7054 (Fig. 6)
SPLEEN = 3512,6 - 1,743 * YEAR
Correlation: r = -0,7054
YEAR
SPLEEN
16 18 20 22 24 26 28 30 32
2000,5 2001,5 2002,5 2003,5 2004,5 2005,5 2006,5
Fig. Fig. 6 Tendency of the spleen dynamics
Liver = 2349 – 1.171*year and correlation R2 = -0.8303 (Fig. 7).
LIVER = 2349,8 - 1,171 * YEAR
Correlation: r = -0,8303
YEAR
LIVER
0 1 2 3 4 5 6 7 8 9
2000,5 2001,5 2002,5 2003,5 2004,5 2005,5 2006,5
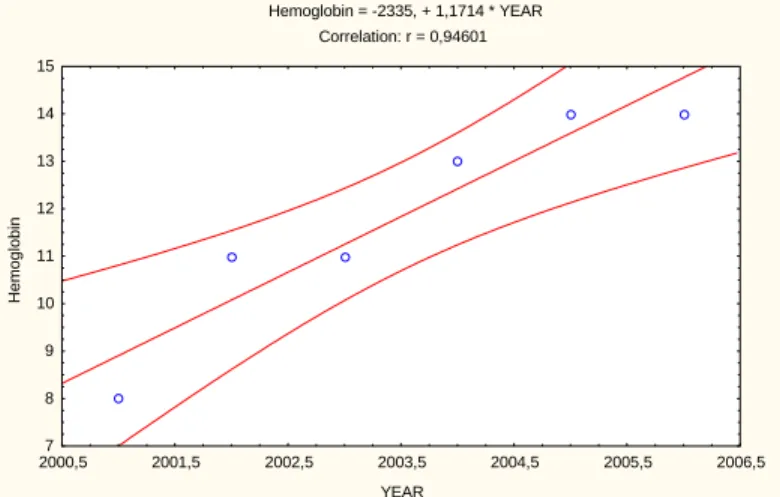
An increasing tendency of haemoglobin was found in the second
patient: haemoglobin = 2335+1.1714*year. Correlation R2=0.94601
(Fig. 8) and an increasing tendency of platelets dynamics:
platelets = 8496 + 4.2571*year. Correlation R2=+0.61198 (Fig. 9).
Hemoglobin = -2335, + 1,1714 * YEAR
Correlation: r = 0,94601
YEAR
Hem
oglobin
7 8 9 10 11 12 13 14 15
2000,5 2001,5 2002,5 2003,5 2004,5 2005,5 2006,5
Fig. 8 Tendency of the haemoglobin dynamics
PLATELETS = -8476, + 4,2571 * YEAR
Correlation: r = 0,61198
YEAR
PLATELETS
20 25 30 35 40 45 50 55 60 65
2000,5 2001,5 2002,5 2003,5 2004,5 2005,5 2006,5
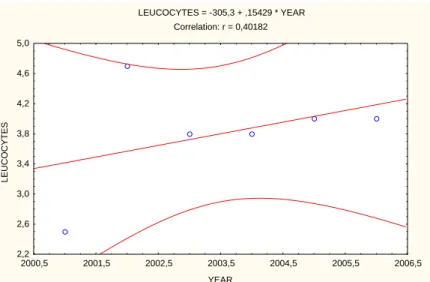
The tendency of leukocytes dynamics was flat:
leukocytes = -305.3 + 0.15429*year. Correlation R2 = 0.4082
(Fig. 10)
LEUCOCYTES = -305,3 + ,15429 * YEAR
Correlation: r = 0,40182
YEAR
LE
UCO
CY
TE
S
2,2 2,6 3,0 3,4 3,8 4,2 4,6 5,0
2000,5 2001,5 2002,5 2003,5 2004,5 2005,5 2006,5
Fig. 10 Tendency of the leucocytes dynamics
4. DISCUSSION
A model was created for the quantitative evaluation of the results of ERT with Cerezyme*Genzyme on the basis of the investigation dynamics of biomarkers of children with Gaucher disease during a treatment with ERT with Cerezyme*Genzyme. Its gave us better and easier comparison of the received results. In the first patient there were higher correlation between liver, spleen, haemoglobin and
platelets, than in the second one. But the correlation R2 of these
biomarkers were above 0.5, which implies a significant tendency. This confirmed again the effect of ERT with recombinant enzyme Cerezyme.
second patient showed a moderate tendency of leukocytes dynamics, above 0.3 (modarate tendency).
5. CONCLUSION
The developed model for quantitative evaluation, based on the method of investigation of time series, gave possibilities for longitudinal evaluation of the individual tendency of evolution of the disease. On the basis of received data, it was possible to make a precise decision about the correction of the individual doses. This approach will improve the quality of life of the patients and yield a positive economical effect.
REFERENCE
1. Radeva B., Genetics Diagnose and Treatment of Gaucher
Disease, S., Petecston, 2000, 142.
2. Radeva B., Register of Gaucher Disease in Bulgaria in Radeva
B., Clinics, Diagnose and Treatment of Inborn Errors of Metabolism in Childhood. S., Petecston, 1998, 183.
3. Radeva B., Biomarkers choice for monitoring of enzyme
replacement therapy of Gaucher disease, 37th Annual
Symposium SSIEM, Genova, Italy, 7-10 September 1999.
4. Sachs L., Angewanelte Statistik. Andwendungstatischen
Methoden, Springer-Verlag, Berlin, 1971.
5. Microcal SoftwareIns. Origin 6 Getting Started Manual. v. 7,