Transcript Profiling of Chlorella under Heterotrophy to
Photoautotrophy Transition
Jianhua Fan1., Yanbin Cui1., Jianke Huang1
, Weiliang Wang1, Weibo Yin2, Zanmin Hu2*, Yuanguang Li1*
1State Key Laboratory of Bioreactor Engineering, East China University of Science and Technology, Shanghai, People’s Republic of China,2Institute of Genetics and Developmental Biology, Chinese Academy of Sciences, Beijing, People’s Republic of China
Abstract
Background: Microalgae have been extensively investigated and exploited because of their competitive nutritive bioproducts and biofuel production ability. Chlorella are green algae that can grow well heterotrophically and
photoautotrophically. Previous studies proved that shifting from heterotrophy to photoautotrophy in light-induced environments causes photooxidative damage as well as distinct physiologic features that lead to dynamic changes in
Chlorellaintracellular components, which have great potential in algal health food and biofuel production. However, the molecular mechanisms underlying the trophic transition remain unclear.
Methodology/Principal Findings:In this study, suppression subtractive hybridization strategy was employed to screen and characterize genes that are differentially expressed in response to the light-induced shift from heterotrophy to photoautotrophy. Expressed sequence tags (ESTs) were obtained from 770 and 803 randomly selected clones among the forward and reverse libraries, respectively. Sequence analysis identified 544 unique genes in the two libraries. The functional annotation of the assembled unigenes demonstrated that 164 (63.1%) from the forward library and 62 (21.8%) from the reverse showed significant similarities with the sequences in the NCBI non-redundant database. The time-course expression patterns of 38 selected differentially expressed genes further confirmed their responsiveness to a diverse trophic status. The majority of the genes enriched in the subtracted libraries were associated with energy metabolism, amino acid metabolism, protein synthesis, carbohydrate metabolism, and stress defense.
Conclusions/Significance:The data presented here offer the first insights into the molecular foundation underlying the diverse microalgal trophic niche. In addition, the results can be used as a reference for unraveling candidate genes associated with the transition ofChlorellafrom heterotrophy to photoautotrophy, which holds great potential for further
improving its lipid and nutrient production.
Citation:Fan J, Cui Y, Huang J, Wang W, Yin W, et al. (2012) Suppression Subtractive Hybridization Reveals Transcript Profiling of Chlorella under Heterotrophy to Photoautotrophy Transition. PLoS ONE 7(11): e50414. doi:10.1371/journal.pone.0050414
Editor:Senjie Lin, University of Connecticut, United States of America
ReceivedJuly 10, 2012;AcceptedOctober 19, 2012;PublishedNovember 29, 2012
Copyright:ß2012 Fan et al. This is an open-access article distributed under the terms of the Creative Commons Attribution License, which permits unrestricted use, distribution, and reproduction in any medium, provided the original author and source are credited.
Funding:This research was supported by the National Natural Science Foundation of China 21076080, National Basic Research Program of China 2011CB200902 and National Key Technologies R&D Program 2011BAD23B04. The funders had no role in study design, data collection and analysis, decision to publish, or preparation of the manuscript.
Competing Interests:The authors have declared that no competing interests exist. * E-mail: [email protected] (YL); [email protected] (ZH)
.These authors contributed equally to this work.
Introduction
Green algae from the genusChlorella are single-celled, micro-scopic plants that grow in fresh water and are believed to have existed for billions of years [1]. Chlorellais considered one of the most powerful ‘‘superfoods’’ known to man and is renowned for their incredible nutrient content and qualities [2]. Chlorella
provides about 60% protein and it also contains an impressive range of vitamins and minerals, pigments, fatty acids, and growth factor. It is also become particularly promising in the development of second-generation biofuels because of its ability to accumulate high lipid content either under heterotrophic and phototrophic cultivation [3,4].
The conventional commercial production ofChlorellabiomass is typically accomplished in open ponds via photoautotrophy.
Analysis of the cellular components and electron micrograph studies suggest that the shift from heterotrophic to light-induced growth causes a rapid decrease in cell carbohydrate and corresponding increases in chloroplast proteins, pigments, and lipids [5]. These advantages make the SHDP approach a potential method for the mass cultivation of heterotrophic microalgae for both algal health food and biofuel production. Similar results were also achieved using other algal species via two-step culture systems (transition from heterotrophy to photoautotrophy) with improve-ments in valuable cellular components [6–8]. However, little physiologic and biochemical information is available, especially regarding the major molecular events that occur in microalgal cells under diverse trophic transitions. Thus, the actual cause of intracellular components changes and the mechanism for the SHDP process still needs to be fully understood.
Photosynthetic organisms have evolved direct and indirect mechanisms for sensing and responding to environmental changes (e.g., salt, drought, temperature, and light stresses) [9–11]. Emerging genomic sequencing and systems biological approaches such as transcriptomics, proteomics, and metabolomics have become essential for understanding how organisms respond and adapt to changes in their environment [12,13]. Regarding microalgae, numerous studies on the effects of stress conditions (e.g., nitrogen deprivation and sulfur deprivation) on microalgal lipid, hydrogen, or starch content have been previously carried out [14–19]. Nevertheless, the mechanisms of how microalgae evolved self-protective strategies against physiologic stress at the molecular level are mainly limited to model organisms such asChlamydomonas
andPhaeodactylum. High-throughput omics analyses for investigat-ing microalgal growth and metabolism remain relatively unex-plored, especially in species without genomic foundation, which leads to the lack of information on global genetic expression in response to different stresses. Therefore, unlike traditional studies that focus on general stress conditions in model microalgae, SHDP serves as a particular model for studying the molecular events that occur in heterotrophic algae to adapt and cope with unfavorable environments for survival and growth. In this study, we hypothesized that the cause of growth inhibition and cellular changes under heterotrophy to photoautotrophy transition is due to the sudden light irradiation induced photooxidative stress. We further hypothesized that heterotrophically metabolized Chlorella
attempt to maintain a balance between energy supply and consumption to protect the cells from the detrimental effects of glucose starvation. Thus, it is important to first obtain information on differentially expressed genes which play an important role in the acquisition of nutrition transition tolerance ofChlorellaunder light stress and glucose starvation.
PCR-based suppression subtractive hybridization (PCR-SSH) is a powerful tool for identifying differentially expressed genes, including genes with relatively low abundance [20]. Express sequence tags (ESTs) generated from the high-throughput sequencing of randomly selected cDNA clones in SSH libraries have proven to be a sensitive, rapid, and cost-effective technique for obtaining information on genes that play an important role in environmental stress tolerance [21]. In the current work, both forward (light-induced cells versus heterotrophic cells) and reverse (heterotrophic cells versus light-induced cells) SSH libraries were constructed using the unsequenced microalgaC. pyrenoidosa. It was cultured via the SHDP approach to identify upregulated and downregulated genes under sudden light stress and glucose starvation, by using the optimized culture medium and culture conditions in flask under heterotrophy or continues artificial light illumination (in consideration of the maximum biomass produc-tivity with significant cellular components transformation, 1–3 g/l
for photoinduction at a light intensity of 200–300mmol/m2/s was the optimum condition). A total of 544 candidate genes were found to be involved in diverse biological processes, that facilitate an understanding of the molecular basis of microalgal stress tolerance and nutrition transition.
Materials and Methods
Algal Materials and Culture Conditions
C. pyrenoidosawas obtained from the Institute of Hydrobiology, Chinese Academy of Sciences (Wuhan, China), and purified aseptically. They were first grown heterotrophically in Endo medium at 28uC [22] and shaken at 150 rpm. Light-induced treatment was carried out using late log-phase heterotrophic cells once the glucose was depleted. Aliquots (50 ml) of algal cells were collected by centrifugation at 5,0006gfor 5 min in the dark. After washing twice with sterilized water, the pellets were resuspended in fresh Sorokin–Krauss medium [23] at a final cell concentration of ,2 g/l and then subjected to continuous light treatment under a light intensity of 250mmol/m2/s. Both heterotrophic and light-induced cells from different time courses were harvested and preserved in liquid nitrogen for future use.
For comparison between different cultivation strategies, the heterotrophic grown cells were further investigated by inoculation into several 3 L air-lift flat panel photobioreactors (35 cm high, 24cm long and 4 cm wide) with a working volume of 2.5 L. The following four combinations were carried out for sampling: a) glucose starvation in the dark; b) photoautotrophic growth with 250mmol/m2/s light illumination when glucose was exhausted; c) mixotrophic growth with 20 g/l glucose and 250mmol/m2/s light treatment; d) heterotrophic growth with 20 g/l glucose in the dark. The lamps arranged in parallel on a vertical plane at both sides, were used as the external light source for a 48-h continuous irradiance. Aeration and mixing were achieved by sparging air with 1.0 vvm.
Analytical Methods
The biomass concentration, protein and chlorophyll contents were measured using the methods described by Fan et al [5]. The maximum photochemical efficiency of photosystem II (Fv/Fm) and non-photochemical quenching (NPQ) of fresh alga cells were determined with Dual-PAM 100 (Walz, Germany) according to the operating procedures used by Gao et al [24]. All experiments were conducted in three independent biological replicates. The Fv/Fm and NPQ values were calculated as follows: Fv/ Fm = (Fm2Fo)/Fm;NPQ = (Fm2Fm’)/Fm’.
Reactive oxygen species (H2O2 and hydroxyl radical) were detected by using biochemical methods following the instructions of corresponding reagent kits (Nanjing Jiancheng Bioengineering Institute, China). The activities of ROS scavenging enzymes, such as superoxide dismutase (SOD), catalase (CAT), and peroxidase (POD), as well as lipid peroxidation level in terms of malondial-dehyde (MDA) contents were measured using the methods of Zhang and Kirkham [25]. The ROS content, activity of each enzyme and MDA content were all expressed on a soluble protein basis. Soluble protein concentration was determined using bicinchoninic acid (BCA) method (BCA protein assay kit, Sangon company, China).
Total RNA and mRNA Isolation
assessed by electrophoresis on denatured agarose gel and by measuring the absorbance at 230, 260, and 280 nm. For SSH, equal amounts of total RNA from heterotrophic and light-induced
Chlorellacells at each time point were mixed. The Poly(A)+mRNA samples were purified from the mixed total RNA using Poly-ATract mRNA Isolation System (Promega, USA) according to the manufacturer’s instructions.
Construction of the Subtracted cDNA Libraries
Double-stranded cDNA reverse transcribed from 3mg of the mixed mRNA was used for suppression subtractive hybridization (SSH) using a PCR-Select cDNA Subtraction Kit (Clontech, California, USA). Both forward (cDNA obtained from light-induced cells as tester and cDNA obtained from heterotrophic cells as driver) and reverse (cDNA obtained from heterotrophic cells as tester and cDNA obtained from light-induced cells as driver) SSH libraries were constructed following the manufacturer’s instruc-tions. The efficiency of the cDNA subtraction was evaluated by PCR using beta-actin primers (Table S1) performed on subtracted and unsubtracted cDNAs for 18,23, 28, 33, and 38 cycles. The subtracted cDNA was further cloned into the pGEM-T easy vector (Promega, Beijing, China) and was transformed into chemically competent TOPO 10 Escherichia coli cells (Tiangen, Beijing, China). The transformed cells were selected on Luria– Bertani agar plates containing ampicillin at 37uC for screening.
Amplification of cDNA Inserts
PCR amplification of the cDNA inserts from colonies was conducted using the primers T7 (59 TAATACGACTCACTA-TAGGG39) and SP6 (59AGCTATTTAGGTGACACTATAG39). The PCR products were electrophoresed on 1.2% agarose gel to confirm the presence and size of the inserts before screening and sequencing.
DNA Sequencing and Data Analysis
More than 1,500 differentially expressed cDNA fragments randomly picked from each subtracted SSH library were sequenced on an ABI 3700 sequencer (Applied Biosystems, USA). The software SeqClean (http://compbio.dfci.harvard. edu/tgi/software/) was used to eliminate the vector and primer sequences, and for trimming of the low-quality segments. The CAP3 program [26] was used for contig assembly. The obtained nucleotide sequences were identified in the non-redundant (nr) protein database using the Blastx program [27] on the NCBI homepage (http://www.ncbi.nlm.nih.gov/BLAST). The ESTs with significant database threshold E-values of 1025 or better were classified into putative functional categories according to their putative biological roles and molecular functions. All assembled contigs and singletons were further annotated using NCBI nucleotide (nt) databases, InterProScan [28], SwissProt (www.expasy.org/sprot), and other specialized databases like KEGG [29] and Clusters of orthologous groups (COGs, http:// www.ncbi.nlm.nih.gov/COG).
Semiquantitative and Real-time Quantitative RT-PCR Verification
Semiquantitative RT-PCR was performed to roughly and quickly validate the differential expression of each library. Total RNA was extracted from Chlorella cells collected at six different culture stages (2, 8, and 24 h for both heterotrophic and light-induced cells) according to the method described in Section 2.3. The RNA samples were treated with RNase-free DNase I (TaKaRa, Japan) to remove DNA contamination. The cDNA
from each sample were synthesized using a ReverTra Ace -a- Kit (Toyobo, China) following the manufacturer’s protocol. The gene-specific primer pairs were designed from assembled unigenes using Primer Premier 5 (Table S1). The actin gene fromC. pyrenoidosa
was used as an internal control to normalize differences between the loading amounts of the template. All PCR reactions were carried out within a final volume of 20ml containing 1ml of cDNA template, 1.5ml of 10 mM deoxyribonucleotide triphosphates, 2ml of 106PCR buffer (Mg2+
plus), 1ml of each primer (10mM), 0.2ml of Taq polymerase (5 U/ml). The PCR parameters were set as follows: 28 cycles of 94uC for 30 s, appropriate annealing temperatures for 30 s, and 72uC for 1 min, with an additional initial 5 min denaturation at 94uC and a 5 min final extension at 72uC.
To further investigate the expression kinetics of the identified genes, real-time quantitative PCR was performed using SYBR Green Realtime PCR Master Mix (Toyobo, China) for 40 cycles, and the accumulation of fluorescent products was monitored using a C1000 Thermal cycler Real-Time PCR Detection System (Bio-Rad, CA, USA). All procedures were performed according to the manufacturers’ instructions. Table S2 summarizes the primer sequences used in this study. The 22DDCT method was used to analyze the fold change in gene expression relative to control [30].
Statistical Analysis
Data were expressed as mean 6 SD. Statistical analysis was performed by one-way ANOVA followed by Newman–Keuls multiple comparison test (GraphPad Prism 5).p-values of less than 0.05 and 0.01 were taken to indicate a significant and extreme significant difference between groups respectively.
Results
Effect of Diverse Nutrition Transition on Growth and Physiological Features
Different transition strategy of heterotrophy to photoautotro-phy, mixotrophotoautotro-phy, heterotrophy and glucose starvation were investigated to evaluate the effects on cell growth and physiological characteristics by batch mode operation, and the results are shown in Figure 1 and 2. The cultures for lack of glucose treatments (photoautotrophy and glucose starvation) exhibited a certain degree of weight loss (Figure 1A). Corresponding to this, photoautotrophy treatment resulted in the most drastic increment of cellular protein and chlorophyll contents, followed by glucose starvation (Figure 1B and 1C). With addition of glucose in the mediums (heterotrophy and mixotrophy), less cellular components variation but greatly increased biomass concentrations were observed, though slight increase of chlorophyll occurred in the mixotrophy treatment (Figure 1C). From the perspective of light, it could exacerbate the cellular change of dark-grown cells and shorten the induction period, making the quality ofChlorellacells reach the level of purely photoautotrophic cells rapidly (with 50% protein and 2% chlorophyll contents in general). Thus glucose and light may pull together effect on intracellular components and functional alterations, which maybe finally lead to differential gene expression response.
photoauto-trophy cultures. The heterotrophic-grown cells showed complete repressed photosynthesis as the photosynthetic apparatus was undeveloped in the dark. A maximum Fv/Fm of ca. 0.58 was measured at 8 h and then declined to ca. 0.45 two days after being transferred to high light environments, indicative of severe photoinhibition of photosynthesis. However, under medium light treatment, as the cultures proceeded, the cells gradually recovered from photoinhibition (Figure 2A). Simultaneously, the NPQ value of the high light treatment increased 2.79 to 4.92-fold compared to the medium light treatment in the first 48 h. Thus high light treatment led to decreased photosynthesis and increased photo-protection. In agree with probably increased photooxidative stress when transferred heterotrophic cells to photoautotrophic growth, the ROS concentration, ROS-induced lipid peroxidation (MDA content) and scavenging enzymes increased exponentially in the light-induced process, whereas only a slight increase in ROS and corresponding enzymes was detected in the heterotrophic cells under dark conditions (Figure 2B and 2C). The up-regulation of these features would potentially be caused by the increase of redox state, which perhaps explained intracellular metabolic changes follow photoinduction and glucose starvation.
Characterization of the Subtracted cDNA Libraries Two cDNA libraries were constructed by PCR-based SSH to obtain a large amount of ESTs for identifying differentially expressed genes involved in glucose starvation and light stress tolerance of Chlorella cells. Subtraction efficiency was validated using the abundances of the beta-actin gene transcripts (Figure S1). Differences in amplification patterns between the subtracted and unsubtracted cDNA samples indicative of successful subtrac-tion were visually observed. The forward and reverse libraries consisted of approximately 3,000 positive clones. Before large-scale Sanger sequencing, 20 randomly selected clones were isolated and checked via colony PCR amplification to detect the presence of cDNA inserts and to estimate the size (Figure S2). A total of 1,573 clones (770 forward and 803 reverse) were isolated and sequenced, with the sizes of the inserts ranging from 120 bp to 1,000 bp (Figure S3). After removing the vector sequences and low-quality ESTs, the average available sequence was about 301 bp length (Figure S4). All the high-quality EST sequences have been
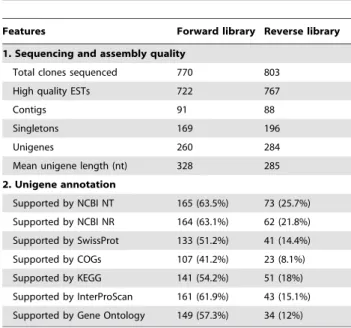
deposited in the GenBank (accession numbers: dbEST JK744884–JK746369). The general characteristics of the two SSH libraries are provided in Table 1.
Contig Assembly, Functional Annotation, and Bioinformatics Analysis
The cleaned ESTs were assembled, which resulted in a total of 260 unigenes with 91 contigs/169 singletons from the light-induced cells and 284 unigenes with 88 contigs/196 singletons from the heterotrophically cultured cells (Table 1). Some unique genes were represented by multiple ESTs, as shown in Table S3 and S4, which included contigs with more than two nucleotide sequences. The properly assembled contigs and singletons were annotated using different tools (Blastn and Blastx) and databases (NCBI nucleotide and protein databases, InterProScan, KEGG, COGs, and SwissProt, see Tables S3 and S4 for details). Blastx annotation of the assembled unigenes demonstrated that 164 (63.1%) sequences from the forward library and 62 (21.8%) from the reverse library had significant similarities with the sequences in the NCBI nr database, whereas the rest of the unigenes had no homologues at the amino acid level (Table 1). The sequenced ESTs from the forward library were classified into 10 functional categories (Table 2). Energy metabolism (36, 5%); amino acid metabolism (80, 11%); DNA/RNA binding, transcription, and translation (347, 48%); protein folding, sorting, and degradation (16, 2%); and stress response (28, 4%) represented the largest portion of sequences. Similarly, the ESTs in the reverse library were divided into 11 groups (Table 3). The largest portions of the sequences were represented by energy metabolism (21, 3%); carbohydrate metabolism (12, 2%); DNA/RNA binding, tran-scription, and translation (12, 2%); protein folding, sorting, and degradation (16, 2%); and chlorophyll and polyketide biosynthesis (25, 3%). COGs–based functional prediction was also carried out to classify the differentially expressed genes (Figure S5).
However, in addition to the putatively identified genes, ESTs for no-hit sequences with homologous sequences in the nr database (E-value .1e-5) and functionally unknown categories have a relatively higher abundance [29% in forward library (Table 2) and 87% in reverse library (Table 3)], which illustrates the current lack of genomic knowledge on green algae. These Figure 1.Chlorellagrowth and the cellular component temporal pattern characteristics under diverse nutrition transition.A: Biomass concentration; B: Protein content; C: Chlorophyll content. Error bars represent the mean6standard deviation of three independent biological replicates.
functionally non-characterized ESTs potentially represent previ-ously unidentified genes involved in algal adaption to light stress and glucose starvation. Moreover, the same function could also be carried out by differentially regulated homologs. However, the uncharacterized genes need to be further analyzed to confirm their differential expression.
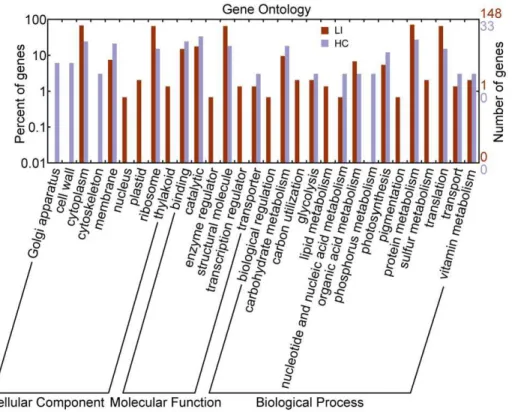
Functional analysis of the unigenes from the two libraries using Gene Ontology (GO) predictions identified several categories according to cellular component, molecular function, and biological process and were plotted using WEGO [33]. GO annotation coarsely identified the major categories of the differentially expressed genes involved in particular biological processes to assess the trends in their transcriptional regulation following glucose starvation and light induction (Figure 3). The annotation results show that the cellular component of light-induced cells were mainly located in ribosomes, the cytoplasm, and the cell membrane, which accounted for 75% of the total proportion. Likewise, cellular components of heterotrophic cells were also mainly located in the cytoplasm, cell membrane, and ribosome. The unique locations for the forward libraries were the plastids, thylakoids, the nuclei, and the cell wall, whereas the reverse libraries were in the cytoskeleton and the Golgi apparatus. The most commonly represented categories in the light-induced cells and the heterotrophic growth cells were those of structural molecules, followed by catalytic activity, and binding activities. The other molecular functions were represented at a lower extent. In terms of biological processes, the main ESTs of heterotrophic cells were related to carbohydrate metabolism, protein metabo-lism, and translation, particularly in phosphorus metabolism and nucleotide metabolism. Meanwhile, the most represented in the light-induced cells were translation, protein metabolism, organic acid metabolism, photosynthesis, carbohydrate metabolism, espe-cially in carbon utilization, lipid metabolism, sulfur metabolism,
and pigmentation. According to the information given by the GO annotation, the heterotrophic cells tended towards growth, development, and primary metabolic processes, whereas the light-inducedChlorellacells tended to be more active in response to environmental factors and self-protections.
Confirmation of Differential Expression and Transcriptional Levels
About 50 upregulated and downregulated unigenes were preferentially chosen based on the putative annotations linking them to biological processes considered significant. Since the data suggested a large number of identified genes are as of yet uncharacterized, we also added 15 randomly selected functional unknown sequences for chosen. This step was performed to validate the results from SSH experiments. Primers for RT-PCR of these genes were designed by using Primer Premier 5 software. However, since the software produced the primer pairs of only 38 genes (including 9 function unknown genes) as shown in Table S1 and S2, RT-PCR analyses were performed for these genes (20 for semi-quantitative and 28 for real-time quantitative, 10 genes were overlapped). All the selected genes showed significant differential expression at all the six different time points.As shown in Figure
S6, the mRNA abundance of the 10 genes from the forward library was notably induced in the light-treated samples, confirm-ing that these genes were upregulated by light stress and glucose starvation. On the contrary, most the 10 genes from the reverse library were significantly downregulated when the Chlorella cells were exposed to light illumination relative to the cells by heterotrophic growth. These results indicated that the genes identified in our study are transcribed differentially under heterotrophy to photoautotrophy transition.
The time-course expression profiles of the 28 candidate genes were examined using materials sampled at different points of the culture stages to investigate how the aforementioned genes responded to glucose starvation and light stress (Figure 4 and 5). The real-time RT-PCR results revealed general considerations of transcript profiling of C. pyrenoidosa under diverse nutrition transition, with most of the light-induced genes exhibiting a fast response and reaching their maximum transcription levels at the first 24 h after light exposure. Most of the genes continued to increase until the end of the experiment. In the reverse library, differences among the expression profiles were also detected. Three genes showed continued upregulation in the late growing season in dark (RYG140, RYG197, RYG223, 72 h of heterotro-phy), confirming the effect of glucose starvation on gene expression. In total, five genes remarkable increases in transcripts over 100 times during the culture process were observed (FYG017, FYG137, FYG177, RYG 088 and RYG109). Nevertheless, for all of the genes, the RT-PCR results were in reasonable agreement with the SSH experiments, which suggests that these genes were truly differentially expressed.
Discussion
Microalgae have been extensively investigated and exploited because of their competitive nutritive bioproducts and biofuel production ability. However, the large-scale applications have still been limited by the low yield and high cost of microalgal biomass production. Photoautotrophic culture model is widely used in Figure 2. Time course changes onChlorellaphysiological features under heterotrophy to photoautotrophy transition.A: Changes of photosynthesis fluorescence parameters on different light intensity; B: Production of ROS and lipid peroxidation; C: Activities of ROS scavenging enzymes. H: heterotrophy; P: photoautotrophy. Error bars represent the mean6standard deviation of three independent biological replicates. doi:10.1371/journal.pone.0050414.g002
Table 1.Assembly and annotation statistics of the two SSH libraries.
Features Forward library Reverse library
1. Sequencing and assembly quality
Total clones sequenced 770 803
High quality ESTs 722 767
Contigs 91 88
Singletons 169 196
Unigenes 260 284
Mean unigene length (nt) 328 285
2. Unigene annotation
Supported by NCBI NT 165 (63.5%) 73 (25.7%)
Supported by NCBI NR 164 (63.1%) 62 (21.8%)
Supported by SwissProt 133 (51.2%) 41 (14.4%)
Supported by COGs 107 (41.2%) 23 (8.1%)
Supported by KEGG 141 (54.2%) 51 (18%)
Supported by InterProScan 161 (61.9%) 43 (15.1%)
Supported by Gene Ontology 149 (57.3%) 34 (12%)
conventional commercial production process, yet its large area coverage, low productivity and high production cost are the main limiting factors. Heterotrophy can achieve considerable cell density and productivity. However, under heterotrophic condi-tions, cells are lacking in photosynthetically derived compounds (lower protein and pigment contents), leading the loss of its main advantages and practical application value [5]. In this study, we adopted the novel SHDP culture model to culture Chlorella, the contents of protein and chlorophyll were increased markedly within the first 8-h photoinduction (Figure 1), making the quality of the cells (protein and chlorophyll contents) obtained by SHDP
close to the maximum values reported for purely photoautotro-phically grown cells [22].
Although several studies have been carried out to explore the mechanisms of stress tolerance in microalgae [34–36], information on the genetic expression involved in their diverse trophic niche is limited.Chlorella is a particular green algal genus that can grow well heterotrophically and photoautotrophically. Thus, genes were screened to determine the distinct nutritional status of microalgae for the first time.Chlorellacultured via the SHDP strategy can also efficiently accumulate high-value bioproducts within several hours; thus, the identification of genes involved in the culture process Table 2.Functional classification of the differentially expressed genes in forward library.
Unigene ID
Length (bp)
No. of ESTs
Best
hits Identity E-value Annotation
1. Energy Metabolism (36)
FYG062 507 2 AAB40979 54 5.00E-23 chlorophyll a–b binding protein of LHCI
FYG152 488 7 XP_001695467 80 1.00E-61 chlorophyll a–b binding protein of LHCII
FYG052 173 2 ABA01111 71 4.00E-11 chloroplast ATP synthase gamma subunit
FYG066 294 3 ABK24568 88 3.00E-38 fructose-1,6-bisphosphate aldolase
FYG177 196 1 CAA41635 69 6.00E-18 glutamate dehydrogenase (NADP+)
FYG056 486 4 ABA01139 83 2.00E-33 oxygen-evolving enhancer protein 1 of photosystem II
FYG242 635 1 XP_001694126 67 2.00E-42 oxygen-evolving enhancer protein 2 of photosystem II
FYG252 285 1 BAF97055 100 6.00E-19 Rubisco large subunit
FYG257 591 1 XP_001417684 59 2.00E-27 psaG, subunit V of photosystem I
FYG011 460 11 ACU32661 91 3.00E-11 Rubisco small subunit
FYG160 336 1 Q9SBN3 67 6.00E-26 plastocyanin oxidoreductase iron-sulfur protein
FYG248 169 1 ABD37953 86 5.00E-14 glyceraldehyde-3-phosphate dehydrogenase subunit A
FYG167 177 1 NP_192713 48 1.00E-07 short-chain dehydrogenase/reductase family protein
2. Amino Acid Metabolism (80)
FYG129 521 80 XP_001697794 70 7.00E-61 diaminopimelate epimerase
3. Nucleotide Metabolism (1)
FYG215 264 1 XP_001421179 66 2.00E-20 nucleoside diphosphate kinase
4. Fatty Acid and Lipids Metabolism (1)
FYG250 320 1 ACF98530 88 1.00E-26 omega-6 fatty acid desaturase
5. DNA/RNA Binding, Transcription and Translation (347, 342 ribosomal genes were not listed)
FYG179 336 1 XP_001700625 81 8.00E-15 transcription factor NAC-BTF3
FYG224 275 1 ABR26094 82 7.00E-18 retrotransposon protein
FYG193 389 1 XP_001702450 50 6.00E-16 RNA helicase
FYG042 910 2 AAV34148 93 1.00E-83 elongation factor 1-alpha
6. Protein Folding, Sorting and Degradation (16)
FYG187 769 1 AAL15154 77 1.00E-102 serine protease
FYG069 291 15 NP_001054720 86 5.00E-34 ubiquitin family
7. Transporter (3)
FYG150 279 1 NP_565182 42 2.00E-14 bile acid:sodium symporter protein
FYG048 195 2 XP_001493127 72 2.00E-12 chloride ion channels protein
8. Cell Cycle and Motility (1)
FYG170 201 1 XP_001134549 74 7.00E-16 proliferation associated protein
9. Response to Stress (28)
FYG201 257 1 XP_001693150 62 2.00E-11 glutathione peroxidase
FYG126 496 27 ABR01228 69 5.00E-30 thiazole biosynthetic enzyme
10. Function Unknown (209)
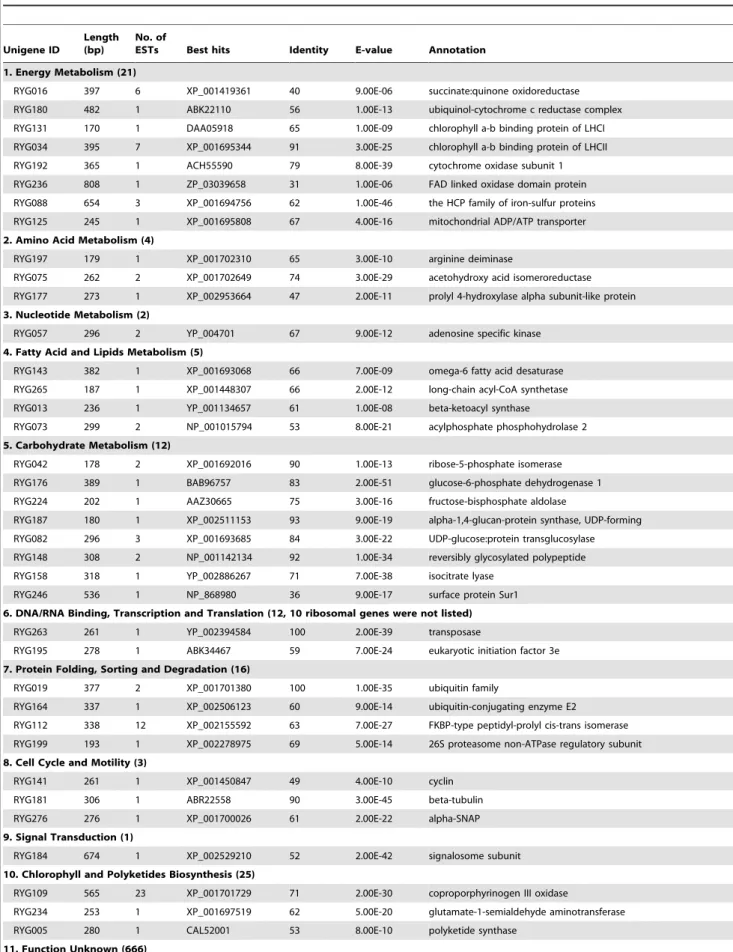
Table 3.Functional classification of the differentially expressed genes in reverse library.
Unigene ID
Length (bp)
No. of
ESTs Best hits Identity E-value Annotation
1. Energy Metabolism (21)
RYG016 397 6 XP_001419361 40 9.00E-06 succinate:quinone oxidoreductase
RYG180 482 1 ABK22110 56 1.00E-13 ubiquinol-cytochrome c reductase complex
RYG131 170 1 DAA05918 65 1.00E-09 chlorophyll a-b binding protein of LHCI
RYG034 395 7 XP_001695344 91 3.00E-25 chlorophyll a-b binding protein of LHCII
RYG192 365 1 ACH55590 79 8.00E-39 cytochrome oxidase subunit 1
RYG236 808 1 ZP_03039658 31 1.00E-06 FAD linked oxidase domain protein
RYG088 654 3 XP_001694756 62 1.00E-46 the HCP family of iron-sulfur proteins
RYG125 245 1 XP_001695808 67 4.00E-16 mitochondrial ADP/ATP transporter
2. Amino Acid Metabolism (4)
RYG197 179 1 XP_001702310 65 3.00E-10 arginine deiminase
RYG075 262 2 XP_001702649 74 3.00E-29 acetohydroxy acid isomeroreductase
RYG177 273 1 XP_002953664 47 2.00E-11 prolyl 4-hydroxylase alpha subunit-like protein
3. Nucleotide Metabolism (2)
RYG057 296 2 YP_004701 67 9.00E-12 adenosine specific kinase
4. Fatty Acid and Lipids Metabolism (5)
RYG143 382 1 XP_001693068 66 7.00E-09 omega-6 fatty acid desaturase
RYG265 187 1 XP_001448307 66 2.00E-12 long-chain acyl-CoA synthetase
RYG013 236 1 YP_001134657 61 1.00E-08 beta-ketoacyl synthase
RYG073 299 2 NP_001015794 53 8.00E-21 acylphosphate phosphohydrolase 2
5. Carbohydrate Metabolism (12)
RYG042 178 2 XP_001692016 90 1.00E-13 ribose-5-phosphate isomerase
RYG176 389 1 BAB96757 83 2.00E-51 glucose-6-phosphate dehydrogenase 1
RYG224 202 1 AAZ30665 75 3.00E-16 fructose-bisphosphate aldolase
RYG187 180 1 XP_002511153 93 9.00E-19 alpha-1,4-glucan-protein synthase, UDP-forming
RYG082 296 3 XP_001693685 84 3.00E-22 UDP-glucose:protein transglucosylase
RYG148 308 2 NP_001142134 92 1.00E-34 reversibly glycosylated polypeptide
RYG158 318 1 YP_002886267 71 7.00E-38 isocitrate lyase
RYG246 536 1 NP_868980 36 9.00E-17 surface protein Sur1
6. DNA/RNA Binding, Transcription and Translation (12, 10 ribosomal genes were not listed)
RYG263 261 1 YP_002394584 100 2.00E-39 transposase
RYG195 278 1 ABK34467 59 7.00E-24 eukaryotic initiation factor 3e
7. Protein Folding, Sorting and Degradation (16)
RYG019 377 2 XP_001701380 100 1.00E-35 ubiquitin family
RYG164 337 1 XP_002506123 60 9.00E-14 ubiquitin-conjugating enzyme E2
RYG112 338 12 XP_002155592 63 7.00E-27 FKBP-type peptidyl-prolyl cis-trans isomerase
RYG199 193 1 XP_002278975 69 5.00E-14 26S proteasome non-ATPase regulatory subunit
8. Cell Cycle and Motility (3)
RYG141 261 1 XP_001450847 49 4.00E-10 cyclin
RYG181 306 1 ABR22558 90 3.00E-45 beta-tubulin
RYG276 276 1 XP_001700026 61 2.00E-22 alpha-SNAP
9. Signal Transduction (1)
RYG184 674 1 XP_002529210 52 2.00E-42 signalosome subunit
10. Chlorophyll and Polyketides Biosynthesis (25)
RYG109 565 23 XP_001701729 71 2.00E-30 coproporphyrinogen III oxidase
RYG234 253 1 XP_001697519 62 5.00E-20 glutamate-1-semialdehyde aminotransferase
RYG005 280 1 CAL52001 53 8.00E-10 polyketide synthase
11. Function Unknown (666)
might provide clues for molecular interpretation and will facilitate further improvement of these organisms and the novel technique used. SSH is one of the most powerful methods for identifying differentially expressed transcripts. In the present study, forward and reverse libraries were constructed and screened, which yielded nearly 3,000 positive clones. About 1,500 recombinant clones were subsequently sequenced, and 544 unigenes were identified as differentially expressed genes responsive to trophic transition. Based on the homology search and functional annotation, 238 (44%) unigenes were found to encode proteins with either known or putative functions. In addition, the better part of ESTs with non-homologous proteins checked against the databases has been identified in the two libraries. These ESTs could potentially represent the sequences of the 59and 39untranslated regions or novel species-specific genes that were previously poorly charac-terized, and may play an important role in the adaption of microalgae to glucose starvation and light stress. The differentially expressed genes obtained with significant protein homology were categorized into 12 groups according to their putative function, which imply their distinct trophic status leads to a dramatic response in gene expression involved in complex biological pathways. These genes may impart a variety of physiologic and biochemical changes in Chlorella by modulating metabolic flux trends, providing a crucial molecular basis for the transition from heterotrophy to photoautotrophy leading to the reassortment of intracellular components.
In the category ‘‘energy metabolism,’’ 57 ESTs individually encoded 21 proteins. The genes that encoded the corresponding photosystem proteins (3 unigenes), light-harvesting complexes (2 unigenes), photosynthetic electron transport proteins (1 unigene), and chloroplast Calvin cycle enzymes (4 unigenes) were found in the forward library, such as oxygen-evolving enhancer protein,
chlorophyll a-b binding protein, plastocyanin oxidoreductase iron–sulfur protein, and ribulose-1,5-bisphosphate carboxylase oxygenase large/small subunit. These proteins suggest the robust ability of Chlorella to restart photosynthetic function to protect heterotrophically grown cells from photodamage under sudden light stress. Likewise, the upregulation of these proteins in response to light stress has also been reported in higher plants and algae [37,38]. By contrast, the heterotrophic cells were expectedly deprived of photosynthetic performance; thus, few genes related to photosynthetic pathways were found in the reverse library. However, two special cases were found, namely, the antenna proteins of light-harvesting complexes (RYG131 and RYG034), which showed enhanced expression in response to heterotrophy. Plant and green algal light-harvesting complexes are composed of more than 20 different antenna proteins associated with photo-systems I and II [39]. Although the function of antenna proteins in darkness-grown cells was not explored, the relatively increased expression indicates their importance in heterotrophicChlorella. In unicellular green algae Dunaliella tertiolecta, an increase in the relative abundance of chlorophyll a/b light-harvesting complex mRNA was also found following a shift from high light to darkness and from high light to low light [40]. LaRocheet alproposed that changes in energy balance brought about by a change in light intensity may control a regulatory factor acting to repress chlorophyll a/b binding protein mRNA expression [40]. Further-more, a unigene that encodes glutamate dehydrogenase (GDH), was also found in the forward library. GDH is an important intermediate enzyme between carbon and nitrogen metabolism and it functions in multiple directions, depending on the environment and the stress [41,42]. In transgenic plants, the overexpression of microbial GDH reportedly confers improved tolerance to herbicides, drought, and pathogenic infections [43]. Figure 3. Gene Ontology (GO) annotation of genes obtained from the SSH libraries.GO predictions identified several categories based on the three terms cellular component, molecular function, and biological process, and were plotted by WEGO. LI represents forward library under the light-induced treatment; HC represents the reverse library under the heterotrophic culture process.
Thus, the upregulation of the gene might be important for the acquisition of nutritional transition tolerance. In the reverse library, several ESTs that encode oxidoreductases (RYG016, RYG180, RYG192, and RYG236) involved in the respiratory electron-transport chain were enriched congruously. The en-hanced expression of genes related to cellular respiration indicates exuberant anabolism in the darkness-grownChlorella, which is in line with the competitive cellular growth rate during the heterotrophic process compared with that in light-induced cells.
The ‘‘DNA/RNA binding, transcription and translation’’ category was the most abundant among the genes identified in the forward library, especially those that encode ribosomal proteins, taking over nearly half of the sequenced clones (342 ESTs). In addition, four unigenes individually encoded proteins homologous to transcription factor BTF3, retrotransposon protein, RNA helicase, and elongation factor 1-alpha. Previous studies confirmed that some ribosomal protein genes are regulated by different stress environments, including high salinity and cold stress [36,44,45]. Organisms have evolved a translation machinery referred to as de novo protein synthesis to cope with stress. In
Chlorella, the increase in the number of transcripts of various ribosomal protein subunits may be responsible for the reboot of the photosynthetic apparatus and related enzymes after they are returned under light. In higher plants, transcription factor BTF3 is required for RNA polymerase II-dependent transcription. The downregulation of BTF3 expression reduces the chloroplast size and the chlorophyll content [46]. Therefore, the upregulation of BTF3 activity may contribute to chloroplast development in
Chlorella to accommodate light stress. Plant retrotransposons are reportedly minimized by maintaining a quiescent state during normal growth and development but could be stress-induced under life-threatening situations [47]. Although the function of retrotransposon proteins in trophic transition remains unclear, the transcriptional increase may reflect a survival strategy inChlorella
during the transition from heterotrophy to photoautotrophy. RNA helicases are ubiquitous enzymes that function as molecular motors that rearrange duplex RNA secondary structures [48]. The helicases might be involved in regulating plant growth and development under stress conditions by regulating some stress-induced pathways [49,50]. In the present study, the mRNA induction of RNA helicase in the forward library may act as a potential regulator that buffers the sudden shock under glucose starvation and light stress. Two other ESTs that individually encode transposase (RYG263) and eukaryotic initiation factor 3e (RYG195) were found in the reverse library, despite the relationships between the two genes and heterotrophic growth have not yet been reported.
In the present study, the diverse expression of 10 genes that encode putative protein with functions related to amino acid metabolism and protein folding, sorting, and degradation were identified in both libraries. Among them, diaminopimelate epimerase plays a critical role in the biosynthetic pathway that converts aspartate into lysine. Further research into the enhance-ment of the metabolic flux through this pathway could increase the essential amino acid yield in important crops, thereby improving their nutritional value [51]. Another notable unigene is arginine deiminase, a key enzyme that participates in arginine and proline
metabolism. In bacteria, arginine deiminase expression is regulat-ed by various environmental factors and growth phases [52]. The upregulation of this enzyme was reported in response to growth under both temperature and salt stress conditions [53]. As demonstrated in the current work, the increased transcription level of arginine deiminase produces ammonia and ATP, thereby allowing the darkness-grown cells to survive and gain an energy advantage. The induced expression of ESTs that encode acetohydroxy acid isomeroreductase (AAIR), the prolyl 4-hydrox-ylase alpha subunit-like protein (P4HA), ubiquitin-conjugating enzyme, FKBP-type peptidyl-prolyl cis–trans isomerase, and the 26S proteasome non-ATPase regulatory subunit were also characterized in the reverse library. AAIR is an important enzyme in the biosynthetic pathway of branched-chain amino acids in plants and microorganisms, whereas P4HA encodes a component of prolyl 4-hydroxylase, a key enzyme that catalyzes the formation of 4-hydroxyproline essential to the proper three-dimensional folding of newly synthesized procollagen chains. These functions, which are potentially necessary for heterotrophic Chlorella, may help cells grow well in the dark [54,55].
A previous study demonstrated that the fatty acids profile of
Chlorella changes significantly after light induction [5]. In the present study, we found two distinct omega-6 fatty acid desaturases (FAD6) individually expressed in the two libraries. FAD6 is involved in the desaturation of fatty acids. Two FAD6 isoenzymes were identified in Arabidopsis [56,57]. The upregulation of chloroplastic FAD6 isotype in response to freezing stress has been reported inC. vulgaris [36]. Two other ESTs that are related to fatty acid synthesis and activation were identified from the reverse library, namely, beta-ketoacyl synthase (KAS) and long-chain acyl-CoA synthetase (LC-FACS). KAS catalyzes the condensation of malonyl-ACP with the growing fatty acid chain, whereas LC-FACS plays a role in the pre-step reaction for theb-oxidation of fatty acids and it can be incorporated in phospholipids. Although the functions of these enzymes in the diverse trophic traits of
Chlorella remain unclear, induction or repression of these genes may be important in maintaining cell membrane performance.
Our study revealed the upregulation of genes involved in the pentose phosphate pathway (RYG042 and RYG176), gluconeo-genesis (RYG224), and the glyoxylate cycle (RYG158) in the reverse library, which suggests the global vigorous expression of central carbon metabolism in the heterotrophically grown cells. In plants, the pentose phosphate pathway is usually stimulated by stress conditions, which supplies reductive intermediates to cells by maintaining the NADPH levels [58]. The transcription of the proteins in the pentose phosphate pathway was also upregulated in S-deprivedChlamydomonas[17]. The glyoxylate cycle serves as the bypass pathway of the TCA cycle and is able to synthesize acetyl-CoA products from the degradation of fatty acids [59], which is especially important for cells that use oils as nutrient sources. In the present study, the induced expression of these metabolism-related genes may be linked to the high demand for metabolic intermediates for heterotrophic growth and biomass production. The plant cell wall is located outside the cell membrane and provides cells with structural support and protection. The cell wall is significantly important in cell enlargement, which plays a critical role in growth and development [60]. The upregulated expression Figure 4. Time-course expression patterns of the selected differentially expressed genes from the forward SSH library.All expression values were normalized to the value of actin gene. Relative amount was calibrated based on the transcript amount of the corresponding gene in control (aliquots of the cDNA samples were mixed from different time points). Left of the dotted line represent the mixed photoautotrophic cells as control and heterotrophic cells as treatment. Right of the dotted line is just the opposite. Values are mean6standard deviation obtained from three independent biological experiments. Hetero- and H: heterotrophy; Photo- and P: photoautotrophy.
of ESTs associated with cell wall metabolism, such as UDP-forming alpha-1,4-glucan-protein synthase, UDP-glucose:protein transglucosylase (UPTG), and reversibly glycosylated polypeptide (RGP) related to heterotrophic cells were identified in this study. These enzymes have a similar function in the synthesis of cell wall polysaccharides in plants [61,62]. A correlation was found between the UPTG transcript levels and the growing status of potato tissues wherein the cell wall components were actively synthesized [61]. A possible explanation for the differential expression of cell wall–related genes is thatChlorella growth and development under heterotrophy and under light induction alter the structure and composition of the cell walls. Thus, the transcripts of genes related to cell wall polysaccharide synthesis are also possibly changed.
Aside from the aforementioned genes identified in both the forward and reverse libraries, we also found several representa-tions of ESTs involved in cell cycle regulation and motility, signaling, chlorophyll biosynthesis, transport, and stress defense (Tables 2 and 3). Among them, the transcription levels of unigenes that encode thiazole biosynthetic enzyme and coproporphyrino-gen III oxidase remarkably increase, both with more than 20 ESTs assembled. The thiazole biosynthetic enzyme and its plant homolog appear to be dual functional proteins with roles in thiamine biosynthesis and mitochondrial DNA damage tolerance [63,64]. Therefore, its function may help Chlorella cells become more robust during trophic transition. Plants and algae under high light stress have to adapt to oxidative stress, which is associated with the generation of reactive oxygen species [37]. Therefore, increasing ROS scavenging capacity by enhancing the expression of ROS scavengers is essential to cells (Figure 2B and 2C). Corresponding to this, an EST that encodes the putative glutathione peroxidase (GPX) was found in the forward library. GPX represents an enzyme family with peroxidase activity that mainly functions in protecting the organism from oxidative damage, thereby stabilizing the light-induced Chlorella cells and maintaining intracellular activity under sudden light treatment.
In summary, the results described herein provide the valuable first insights into the molecular foundation associated with microalgal trophic transition, as well as glucose starvation and light stress. This study also provides an important basis for selecting candidate genes related to the SHDP process inChlorella. These identified genes encompass a range of physiologic processes with pathways specific to both heterotrophic and phototrophic metabolism. Further studies are currently in progress, including screening for differentially expressed genes and pathways and clarifying their functional significance at the whole genome and transcriptome levels. These studies will facilitate further investiga-tions that aim to improve the lipid and nutrient production in
Chlorella.
Supporting Information
Figure S1 Analysis of the subtraction efficiency using PCR. The subtracted and unsubtracted pools of cDNA from forward and reverse libraries were amplified by using primers for the constitutively expressed beta-actin gene. A: forward library; B: reverse library; M: marker.
(DOCX)
Figure S2 Detection of inserted fragments using colony PCR. The insets of 20 randomly selected clones in the two subtracted libraries were tested.
(DOCX)
Figure S3 Length and distribution of sequenced reads among two SSH libraries. The vector sequences were included in the results. A: forward library; B: reverse library. (DOCX)
Figure S4 Length and distribution of ESTs and assem-bled unigenes among two SSH libraries.A: EST lengths without vector sequences from the forward library; B: unigene lengths identified from the forward library; C: EST lengths without vector sequences from the reverse library; D: unigene lengths identified from the reverse library.
(DOCX)
Figure S5 COGs-based functional classification of the differentially expressed genes. A: genes from the forward library; B: genes from the reverse library.
(DOCX)
Figure S6 Time-course expression patterns of the selected differentially expressed genes from the two SSH libraries.Semiquantitative RT-PCR was carried out using
actinas the internal control. HC: heterotrophic culture; LP: Light-induced process.
(DOCX)
Table S1 Sequences of primer pairs used for semi-quantitative RT-PCR.
(DOCX)
Table S2 Sequences of primer pairs used for real-time quantitative RT-PCR.
(DOC)
Table S3 Functional annotation and bioinformatics analysis of the properly assembled contigs and single-tons from the forward library. The ESTs with significant database threshold E-value of at least 1e-5 were classified into putative functional categories.
(XLS)
Table S4 Functional annotation and bioinformatics analysis of the properly assembled contigs and single-tons from the reverse library.The ESTs with a significant database threshold E-value of at least 1e-5 were classified into putative functional categories.
(XLS)
Acknowledgments
We would like to thank the entire staffs and students from the marine bioprocess engineering group, SKLBE and 305 group, IGDB that contributed reagents/materials/analysis tools in this study.
Author Contributions
Conceived and designed the experiments: JF YL ZH. Performed the experiments: JF YC JH. Analyzed the data: JF YC WW WY. Contributed reagents/materials/analysis tools: YL ZH. Wrote the paper: JF. Figure 5. Time-course expression patterns of the selected differentially expressed genes from the reverse SSH library.All expression values were normalized to the value of actin gene. Relative amount was calibrated based on the transcript amount of the corresponding gene in control (aliquots of the cDNA samples were mixed from different time points). Left of the dotted line represent the mixed photoautotrophic cells as control and heterotrophic cells as treatment. Right of the dotted line is just the opposite. Values are mean6standard deviation obtained from three independent biological experiments. Hetero- and H: heterotrophy; Photo- and P: photoautotrophy.
References
1. Heckman DS, Geiser DM, Eidell BR, Stauffer RL, Kardos NL, et al. (2001) Molecular evidence for the early colonization of land by fungi and plants. Science 293: 1129–1133.
2. Tokusoglu O, Unal MK (2003) Biomass nutrient profiles of three microalgae: Spirulina platensis, Chlorella vulgaris, and Isochrisis galbana. J Food Sci 68: 1144–1148.
3. Phukan MM, Chutia RS, Konwar BK, Kataki R (2011) Microalgae Chlorella as a potential bio-energy feedstock. Appl Energy 88: 3307–3312.
4. Xu H, Miao XL, Wu QY (2006) High quality biodiesel production from a microalga Chlorella protothecoides by heterotrophic growth in fermenters. J Biotechnol 126: 499–507.
5. Fan JH, Huang JK, Li YG, Han FF, Wang J, et al. (2012) Sequential heterotrophy-dilution-photoinduction cultivation for efficient microalgal biomass and lipid production. Bioresour Technol 112: 206–211.
6. Zhang DH, Lee YK (2001) Two-step process for ketocarotenoid production by a green alga, Chlorococcum sp. strain MA-1. Appl Microbiol Biotechnol 55: 537– 540.
7. Hata N, Ogbonna JC, Hasegawa Y, Taroda H, Tanaka H (2001) Production of astaxanthin by Haematococcus pluvialis in a sequential heterotrophic-photoau-totrophic culture. J Appl Phycol 13: 395–402.
8. Ogbonna JC, Tomiyama S, Tanaka H (1999) Production of alpha-tocopherol by sequential heterotrophic-photoautotrophic cultivation of Euglena gracilis. J Biotechnol 70: 213–221.
9. Allen AE, Laroche J, Maheswari U, Lommer M, Schauer N, et al. (2008) Whole-cell response of the pennate diatomPhaeodactylum tricornutumto iron starvation. Proc Natl Acad Sci U S A 105: 10438–10443.
10. De Martino A, Bartual A, Willis A, Meichenin A, Villazan B, et al. (2011) Physiological and molecular evidence that environmental changes elicit morphological interconversion in the model diatomPhaeodactylum tricornutum. Protist 162: 462–481.
11. Huddleston JE (2011) Cellular microbiology: rulers and sensors in Chlamydomo-nas. Nat Rev Microbiol 9: 397.
12. Ideker T, Galitski T, Hood L (2001) A new approach to decoding life: Systems biology. Annual Review of Genomics and Human Genetics 2: 343–372. 13. Kitano H (2002) Systems biology: a brief overview. Science 295: 1662–1664. 14. Castruita M, Casero D, Karpowicz SJ, Kropat J, Vieler A, et al. (2011) Systems
biology approach inChlamydomonasreveals connections between copper nutrition and multiple metabolic steps. Plant Cell 23: 1273–1292.
15. Miller R, Wu G, Deshpande RR, Vieler A, Gartner K, et al. (2010) Changes in transcript abundance inChlamydomonas reinhardtiifollowing nitrogen deprivation predict diversion of metabolism. Plant Physiol 154: 1737–1752.
16. Nguyen AV, Toepel J, Burgess S, Uhmeyer A, Blifernez O, et al. (2011) Time-course global expression profiles of Chlamydomonas reinhardtii during photo-biological H2production. PLoS One 6: e29364.
17. Gonzalez-Ballester D, Casero D, Cokus S, Pellegrini M, Merchant SS, et al. (2010) RNA-seq analysis of sulfur-deprivedChlamydomonascells reveals aspects of acclimation critical for cell survival. Plant Cell 22: 2058–2084.
18. Hockin NL, Mock T, Mulholland F, Kopriva S, Malin G (2012) The response of diatom central carbon metabolism to nitrogen starvation is different from that of green algae and higher plants. Plant Physiol 158: 299–312.
19. Guarnieri MT, Nag A, Smolinski SL, Darzins A, Seibert M, et al. (2011) Examination of triacylglycerol biosynthetic pathways via de novo transcriptomic and proteomic analyses in an unsequenced microalga. PLoS One 6: e25851. 20. Diatchenko L, Lau YF, Campbell AP, Chenchik A, Moqadam F, et al. (1996)
Suppression subtractive hybridization: a method for generating differentially regulated or tissue-specific cDNA probes and libraries. Proc Natl Acad Sci U S A 93: 6025–6030.
21. Rebrikov DV, Desai SM, Siebert PD, Lukyanov SA (2004) Suppression subtractive hybridization. Methods Mol Biol 258: 107–134.
22. Endo H, Nakajima K, Chino R, Shirota M (1974) Growth characteristics and cellular components of Chlorella regularis, heterotrophic fast growing strain. Agricultural and Biological Chemistry 38: 9–18.
23. Oh-Hama T, Miyachi S (1988) Microalgal biotechnology: Chlorella. London: Cambridge University Press. 3–26 p.
24. Gao Z, Meng C, Zhang X, Xu D, Zhao Y, et al. (2012) Differential Expression of Carotenogenic Genes, Associated Changes on Astaxanthin Production and Photosynthesis Features Induced by JA in H. pluvialis. PLoS One 7: e42243. 25. Zhang J, Kirkham MB (1994) Drought-stress-induced changes in activities of
superoxide dismutase, catalase, and peroxidase in wheat species. Plant and Cell Physiology 35: 785–791.
26. Huang XQ, Madan A (1999) CAP3: a DNA sequence assembly program. Genome Res 9: 868–877.
27. Altschul SF, Madden TL, Schaffer AA, Zhang J, Zhang Z, et al. (1997) Gapped BLAST and PSI-BLAST: a new generation of protein database search programs. Nucleic Acids Res 25: 3389–3402.
28. Zdobnov EM, Apweiler R (2001) InterProScan - an integration platform for the signature-recognition methods in InterPro. Bioinformatics 17: 847–848. 29. Ogata H, Goto S, Sato K, Fujibuchi W, Bono H, et al. (1999) KEGG: Kyoto
Encyclopedia of Genes and Genomes. Nucleic Acids Res 27: 29–34.
30. Livak KJ, Schmittgen TD (2001) Analysis of relative gene expression data using real-time quantitative PCR and the 2(T)(-Delta Delta C) method. Methods 25: 402–408.
31. Stirbet A, Govindjee (2011) On the relation between the Kautsky effect (chlorophyll a fluorescence induction) and photosystem II: basics and applications of the OJIP fluorescence transient. Journal of Photochemistry and Photobiology B-Biology 104: 236–257.
32. Vavilin DV, Polynov VA, Matorin DN, Venediktov PS (1995) SublethalCon-centrations of Copper Stimulate Photosystem II Photoinhibition in Chlorella pyrenoidosa. Journal of Plant Physiology 146: 609–614.
33. Ye J, Fang L, Zheng HK, Zhang Y, Chen J, et al. (2006) WEGO: a web tool for plotting GO annotations. Nucleic Acids Res 34: W293–W297.
34. Zhao R, Cao Y, Xu H, Lv L, Qiao D, et al. (2011) Analysis of Expressed Sequence Tags from the Green Alga Dunaliella Salina (Chlorophyta)1. J Phycol 47: 1454–1460.
35. Alkayal F, Albion RL, Tillett RL, Hathwaik LT, Lemos MS, et al. (2010) Expressed sequence tag (EST) profiling in hyper saline shockedDunaliella salina reveals high expression of protein synthetic apparatus components. Plant Sci 179: 437–449.
36. Machida T, Murase H, Kato E, Honjoh K, Matsumoto K, et al. (2008) Isolation of cDNAs for hardening-induced genes fromChlorella vulgarisby suppression subtractive hybridization. Plant Science 175: 238–246.
37. Li ZR, Wakao S, Fischer BB, Niyogi KK (2009) Sensing and responding to excess light. Annu Rev Plant Biol 60: 239–260.
38. Heddad M, Adamska I (2000) Light stress-regulated two-helix proteins in Arabidopsis thalianarelated to the chlorophyll a/b-binding gene family. Proc Natl Acad Sci U S A 97: 3741–3746.
39. Andersson U, Heddad M, Adamska I (2003) Light stress-induced one-helix protein of the chlorophyll a/b-binding family associated with photosystem I. Plant Physiol 132: 811–820.
40. Laroche J, Mortain-Bertrand A, Falkowski PG (1991) Light Intensity-Induced Changes in cab mRNA and Light Harvesting Complex II Apoprotein Levels in the Unicellular Chlorophyte Dunaliella tertiolecta. Plant Physiology 97: 147– 153.
41. Mungur R, Glass ADM, Goodenow DB, Lightfoot DA (2005) Metabolite fingerprinting in transgenic Nicotiana tabacum altered by the Escherichia coli glutamate dehydrogenase gene. Journal of Biomedicine and Biotechnology: 198–214.
42. Grabowska A, Nowicki M, Kwinta J (2011) Glutamate dehydrogenase of the germinating triticale seeds: gene expression, activity distribution and kinetic characteristics. Acta Physiologiae Plantarum 33: 1981–1990.
43. Lightfoot DA, Mungur R, Ameziane R, Nolte S, Long L, et al. (2007) Improved drought tolerance of transgenic Zea mays plants that express the glutamate dehydrogenase gene (gdhA) of E-coli. Euphytica 156: 103–116.
44. Baldwin JC, Dombrowski JE (2006) Evaluation ofLolium temulentumas a model grass species for the study of salinity stress by PCR-based subtractive suppression hybridization analysis. Plant Science 171: 459–469.
45. Kim KY, Park SW, Chung YS, Chung CH, Kim JI, et al. (2004) Molecular cloning of low-temperature-inducible ribosomal proteins from soybean. J Exp Bot 55: 1153–1155.
46. Yang KS, Kim HS, Jin UH, Lee SS, Park JA, et al. (2007) Silencing ofNbBTF3 results in developmental defects and disturbed gene expression in chloroplasts and mitochondria of higher plants. Planta 225: 1459–1469.
47. Wessler SR (1996) Plant retrotransposons: Turned on by stress. Current Biology 6: 959–961.
48. Owttrim GW (2006) RNA helicases and abiotic stress. Nucleic Acids Research 34: 3220–3230.
49. Gong ZZ, Lee H, Xiong LM, Jagendorf A, Stevenson B, et al. (2002) RNA helicase-like protein as an early regulator of transcription factors for plant chilling and freezing tolerance. Proc Natl Acad Sci U S A 99: 11507–11512. 50. Vashisht AA, Tuteja N (2006) Stress responsive DEAD-box helicases: A new
pathway to engineer plant stress tolerance. Journal of Photochemistry and Photobiology B-Biology 84: 150–160.
51. Viola RE (2001) The central enzymes of the aspartate family of amino acid biosynthesis. Accounts of Chemical Research 34: 339–349.
52. Liu YL, Dong YQ, Chen YYM, Burne RA (2008) Environmental and growth phase regulation of the Streptococcus gordonii arginine deiminase genes. Appl Environ Microbiol 74: 5023–5030.
53. Vrancken G, Rimaux T, Wouters D, Leroy F, De Vuyst L (2009) The arginine deiminase pathway ofLactobacillus fermentumIMDO 130101 responds to growth under stress conditions of both temperature and salt. Food Microbiology 26: 720–727.
54. Biou V, Dumas R, Cohen-Addad C, Douce R, Job D, et al. (1997) The crystal structure of plant acetohydroxy acid isomeroreductase complexed with NADPH, two magnesium ions and a herbicidal transition state analog determined at 1.65 A resolution. EMBO J 16: 3405–3415.
56. Falcone DL, Gibson S, Lemieux B, Somerville C (1994) Identification of a gene that complements an Arabidopsis mutant deficient in chloroplast omega-6 desaturase activity. Plant Physiol 106: 1453–1459.
57. Okuley J, Lightner J, Feldmann K, Yadav N, Lark E, et al. (1994) Arabidopsis Fad2 Gene Encodes the Enzyme That Is Essential for Polyunsaturated Lipid-Synthesis. Plant Cell 6: 147–158.
58. Couee I, Sulmon C, Gouesbet G, El Amrani A (2006) Involvement of soluble sugars in reactive oxygen species balance and responses to oxidative stress in plants. J Exp Bot 57: 449–459.
59. Dunn MF, Ramirez-Trujillo JA, Hernandez-Lucas I (2009) Major roles of isocitrate lyase and malate synthase in bacterial and fungal pathogenesis. Microbiology-Sgm 155: 3166–3175.
60. Cosgrove DJ (2001) Wall structure and wall loosening. A look backwards and forwards. Plant Physiol 125: 131–134.
61. Wald FA, Kissen R, du Jardin P, Moreno S (2003) Characterization of UDP-glucose : protein transglucosylase genes from potato. Plant Molecular Biology 52: 705–714.
62. Drakakaki G, Zabotina O, Delgado I, Robert S, Keegstra K, et al. (2006) Arabidopsisreversibly glycosylated polypeptides 1 and 2 are essential for pollen development. Plant Physiol 142: 1480–1492.
63. Machado CR, Praekelt UM, deOliveira RC, Barbosa ACC, Byrne KL, et al. (1997) Dual role for the yeastTHI4gene in thiamine biosynthesis and DNA damage tolerance. Journal of Molecular Biology 273: 114–121.