LUCAS LIMA VERARDO
DIFFERENTIALLY EXPRESSED GENES AND miRNA IDENTIFICATION IN PIG SKELETAL MUSCLE
Dissertation presented to the Genetics and Breeding Graduate Program of the Universidade Federal de Viçosa, in partial fulfillment of the requirements for degree of Magister Scientiae.
VIÇOSA
LUCAS LIMA VERARDO
DIFFERENTIALLY EXPRESSED GENES AND miRNA IDENTIFICATION IN PIG SKELETAL MUSCLE
Dissertation presented to the Genetics and Breeding Graduate Program of the Universidade Federal de Viçosa, in partial fulfillment of the requirements for degree of Magister Scientiae.
APROVADA: 25 de julho de 2011.
Marta Fonseca Martins Guimarães Paulo Sávio Lopes (Co-orientador)
AKNOWLEDGEMENTS
Firstly, I would like to thank God for the care and comfort in every moment and for giving me strength to finish this study.
Sincere thanks also to:
The most important people in my life, my parents Márcio and Beth, who always supported me and believed in me;
My brother and sister (Paulo and Liana) and my girlfriend Juliana for giving me all support and friendship;
Friends of República Inçana (Thiago, Marcos, Pedrão, Pedrinho, Alan, Zé, Renê, Matheus, João, Gaucho, Renan, Vinicius and Guilherme) and friends of Judô team (Rangel, Mococa, Maguinho, Thiagão, Allan, Samuel and etc.) for providing me some of the best years of my life here in Viçosa;
My friends from LABTEC (Animal Biotechnology Laboratory), Kleibe, Marcos, Nicola, Erika, Mayara, Priscila, Renata, Ana Paula, Kati, Bruna, Débora, Carol, Margareth, Iuri, André, Daniel, Darlene and Beatriz for continuous knowledge, learning exchange and pleasant workplace;
Federal University of Viçosa (UFV), in special to the Animal Science Department (DZO) and Genetics and Breeding Program, for the opportunity of carrying out the course;
Professor Simone Eliza Facioni Guimarães, my adviser, for her excellent supervision, competence, teachings, friendship and opportunities given to me;
Dr. Carlos, my co-adviser for him patience, friendship and teaching, a lot of teaching;
Professor Paulo Sávio Lopes, for his valuable teachings, patience and friendship; Professor Fabyano Fonseca for all patience, his help during analyses and SAS lessons;
Dr. Marta Fonseca Martins, for participate of the review of my Dissertation and for her presence;
TABLE OF CONTENTS
RESUMO...iv
ABSTRACT...vi
Chapter 1
GENERAL INTRODUCTION... 1
Chapter 2
DIFFERENTIALLY EXPRESSED GENES IDENTIFIED FROM ADULT PIG cDNA LIBRARIES AND THEIR EXPRESSION LEVELS... 5 Chapter 3
NON-CODING RNAs IDENTIFICATION AND EXPRESSION LEVELS OF PIG miRNAs IN SKELETAL MUSCLE 27 Chapter 4
RESUMO
VERARDO, Lucas Lima, M.Sc., Universidade Federal de Viçosa, Julho de 2011. Identificação de genes diferencialmente expressos e miRNAs em músculo esquelético de suínos. Orientadora: Simone Eliza Facioni Guimarães. Co-orientadores: Paulo Sávio Lopes e Carlos Souza do Nascimento.
O suíno (Sus scrofa) é considerado um animal de grande importância para produção de carne, sendo seu potencial de crescimento muscular objeto de grande interesse e geralmente associado com características determinadas na fase pré-natal durante a miogênese. Para o estudo de genes responsáveis por estas características, as etiquetas de sequências expressas (Expressed Sequence Tags - EST) fornecem informações diretas sobre o transcriptoma e indiretas sobre a relação entre o genoma e diferentes fenótipos, proporcionando o conhecimento sobre genes diferencialmente expressos (GDE) bem como sequências genômicas transcritas para o controle da expressão gênica como, por exemplo, alguns RNAs não codificantes. Características de tecidos musculares em suínos podem ser influenciadas diretamente por genes, e estes sendo regulados como, por exemplo, através de miRNAs, em diferentes fases de desenvolvimento. O presente trabalho teve como objetivo a identificação e a anotação in sílico de GDE e sequências não codificantes, com enfoque aos miRNAs, de bibliotecas de cDNA construídas a partir do músculo esquelético semi-membranoso de três diferentes raças de suínos (Duroc, Large White e naturalizada brasileira Piau) bem como a análise dos níveis de expressão dos genes identificados e miRNAs em sete fases de desenvolvimento do
ABSTRACT
VERARDO, Lucas Lima, M.Sc., Universidade Federal de Viçosa, July, 2011. Differentially expressed genes and miRNA identification in pig skeletal muscle. Adviser: Simone Eliza Facioni Guimarães. Co-Advisers: Paulo Sávio Lopes and Carlos Souza do Nascimento.
The pig (Sus scrofa) is considered an important animal for meat production. This interest revolves around the potential for muscle growth, which usually is associated with certain characteristics during prenatal myogenesis. To study the genes responsible for these characteristics, expressed sequence tags (EST) provide direct information about the transcriptome and indirectly on the relationship between the genome and different phenotypes, supplying knowledge about differentially expressed genes (DEG) as well as other transcribed genomic sequences for the control of gene expression, e.g., some non-coding RNAs. Characteristics of muscle tissue in pigs may have been directly influenced by genes, and those being regulated, for example, by miRNAs, in different stages of development. This study aimed to identify by in silico annotation, DEG and non-coding sequences, focusing on miRNAs, using cDNA libraries constructed from semi-membranous skeletal muscle of three different pig breeds (Duroc, Large White and naturalized Brazilian Piau ) as well as analysis of gene expression profiles of identified genes and miRNAs during seven stages of development (21, 40, 70 and 90 days prenatal and 107, 121 and 171 days postnatal) from commercial line animals
Chapter 1
GENERAL INTRODUCTION
Muscle development
The interest in muscle growth potential is generally associated with characteristics determined prenatally during myogenesis (Rehfeldt et al., 2000). Recent studies in fetal pig skeletal muscle have revealed developmental patterns of gene expression, including genes not previously associated with myogenesis (Sollero et al., 2011). In this way, more detailed studies of this process looking for a better meat productivity and quality still have a particular place in the area of animal genetics research.
The lean muscle growth potential of an animal largely depends on the number of muscle fibers prenatally formed, once the postnatal increase in muscle fiber size is limited by genetic and physiological reasons (Rehfeldt et al., 2004), so the skeletal muscle development is an important process in meat animals, this directly affects meat production. The animal muscle mass is formed in two stages during gestation, including primary and secondary fiber formation, being the muscle fiber number fixed before birth. A primary generation occurs from 35 until 55 days of gestation (dg), followed by a second generation which happens between 55 and 90-95 dg. These secondary fibers form around the primary myotubes, using them as a scaffold. The total number of muscle fibers is generally considered to be definitively established by 90-95 dg in the pig and birth occurring at 113 dg (Lefaucheur et al., 1995).
One of the unique characteristics of the skeletal muscle is the diversity on its morphological and biochemical properties (Ryu et al., 2006), what may be explained by the type of protein present according to the expressed genes. Investigation of expressed genes during skeletal muscle development is elementary to understand molecular mechanism of muscle growth. The pattern of expression can be evaluated by analyses of expressed sequence tags (EST) present in muscle tissues. In different areas of research, ESTs and full-length cDNAs provide direct information on the transcriptome and indirect information on the relation between the genome and different phenotypes (Gorodkin et al., 2007). This resource can be used in wide range of applications (Murray et al. 2007), for example to identify genes of importance in meat production or to analyze the effect of a specific gene in the muscle development. Nevertheless, the simple information of these genes is not enough to understand their role in muscularity. There are many factors acting on the genes expression and a good example would be non-coding RNA sequences.
Non-coding RNA
In a first moment the name non-coding RNA (ncRNA) give us an idea that such RNAs neither contain information nor have function. Although it has been generally assumed that most genetic information is transacted by proteins, recent evidence suggests that the majority of mammal’s genomes and other complex organisms are in fact transcribed into ncRNAs, many of which are alternatively spliced and/or processed into smaller products (Jacquier, 2009). Some of these ncRNAs include micro RNAs which are a class of naturally occurring RNA, first recognized in plants and worms and have been extensively characterized since then in other species (Watson et al., 2004).
other small regulatory RNAs in different organisms is a critical step to facilitate our understanding of genome organization, genome biology and evolution (Carrington & Ambros, 2003).
Characteristics of muscle tissue in pigs may have been directly influenced by genes, and those being regulated, for example, by miRNAs, in different stages of development. The goal of this work was to identify genes and miRNAs which have been expressed in pig breeds differing in muscularity and analyze is their expression in different muscle development periods in commercial animals.
REFERENCES
Ambros, V. The functions of animal microRNAs. Nature 2004, 431: 350–355.
Bartel, DP. MicroRNAs: genomics, biogenesis, mechanism, and function. Cell 2004, 116, 281−297.
Carrington, JC; Ambros, V. Role of microRNAs in plant and animal development.
Science 2003, 301(5631): 336–338
Carthew, RW. Gene regulation by microRNAs. Current Opinion in Genetics & Development 2006,16, 203–208.
Gorodkin J., Cirera S., Hedegaard J. et al. Porcine transcriptome analysis based on 97 non-normalized cDNA libraries and assembly of 1,021,891 expressed sequence tags. Genome Biology 2007, 8:R45
Jacquier, A. The complex eukaryotic transcriptome: unex- pected pervasive transcription and novel small RNAs. Nature Reviews Genetics 2009, 10, (12):833–844.
Lefaucheur, L., Edom, F., Ecolan, P. & Butler-Browne, G.S. Pattern of muscle fiber type formation in the pig. Developmental Dynamics 1995, 203, 27-41.
Murray D, Doran P, MacMathuna P, Moss AC: In silico gene expression analysis – an overview. Molecular Cancer 2007, 6:50.
Rehfeldt, C, I Fiedler, G Dietl, and K Ender: Myogenesis and postnatal skeletal muscle cell growth as influenced by selection. Livestock Production Science
2000,66:177–188.
Muscle development of livestock animals: physiology, genetics, and meat Quality
2004, p. 15 – 52. CABI Publishing: Oxon.
Ryu, YC, M-H Lee, S-K Lee and BC Kim: Effects of muscle mass and fiber type composition of Longissimus dorsi muscle on postmortem metabolic rate and meat quality. Journal of Muscle Foods 200617: 343-352.
Sollero BP, Guimarães SEF, Rilington V D, Tempelman R J, Raney N E, Steibel J P, Guimarães J D, Lopes P S, Lopes M S and Ernst C W. Transcriptional profiling
during foetal skeletal muscle development of Piau and Yorkshire–Landrace cross-bred pigs. Animal Genetics 2011,doi:10.1111/j.1365-2052.2011.02186.x Swatland, HJ (1994) In: Structure and Development of Meat Animal and Poultry.
Technomic Publishing Co., Inc., Lancaster, PA, P. 303.
Chapter 2
Abstract. Pig (Sus scrofa) is an important animal, for meat production as well as model organism for biomedical research. As animal production, an interest in the muscle growth potential is generally associated with characteristics determined prenatally during myogenesis. Expressed sequence tags (EST) and full-length cDNAs provide direct information on the transcriptome and indirect information on the relation between the genome and different phenotypes, giving information about differentially expressed genes (DEG). In this work the in sílico identification and annotation of DEG from EST libraries of three different pig breeds (Duroc, Large White and Brazilian naturalized Piau) were performed, followed by qRT-PCR analyses during pre- and postnatal stages (21, 40, 70 and 90 days of pregnancy and 107, 121 and 171 days postnatal) from commercial breed animals for the analysis of genes expression levels across these periods. Thirty four genes differentially expressed were identified, being 21 grouped in a network related to muscle traits which is composed by subnets like myofibril, muscle system process, structural constituent of muscle, motor activity and Wnt signaling pathway after annotation. Thirteen had their expression profile measured by qRT-PCR during all seven periods and could be grouped in four cluster according to their expression level having genes being more expressed during prenatal (ANKRD2, MYBPC1, NEB, DCTN1, MYL2, TP53, TPM2, OBSCN and ANK1) and others during postnatal stage (MYH2, ACTA1, MYH7 and TNNT3). These findings can contribute to better explaining genes function mechanism. More generally, our data are likely to be helpful in uncovering the pathways that mediate prenatal and postnatal skeletal muscle development in vertebrates.
Introduction
The pig (Sus scrofa) is an important animal for meat production being the most widely consumed meat in many countries (Foreign Agricultural Service/USDA Office of Global Analysis, 2011). Studies in fetal pig skeletal muscle have revealed developmental patterns of gene expression, including genes not previously associated with myogenesis (Sollero et al., 2011). In this way, more detailed studies of this process seeking for a better meat production still have a particular place in the area of animal genetics research.
The interest in muscle growth potential is generally associated with characteristics determined prenatally during myogenesis (Rehfeldt et al., 2000). This lean muscle growth potential of an animal largely depends on the number of muscle fibers prenatally formed, being the postnatal increase in muscle fiber size limited by genetic and physiological reasons (Rehfeldt et al., 2004). One of the unique characteristics of the skeletal muscle is the diversity on its morphological and biochemical properties (Ryu et al., 2006), which may be explained by the type of protein present according to the expressed genes. The genes expression can be evaluated by analyses of expressed sequence tags (EST) present in specific populations.
In different areas of research, ESTs and full-length cDNAs provide direct information on the transcriptome and indirect information on the relation between the genome and different phenotypes (Gorodkin et al., 2007). This resource can be used in a wide range of applications (Murray et al. 2007), for example to identify genes of importance in meat production or to analyze the effect of a specific gene in the muscle development. Nevertheless, the power of these libraries as a comprehensive and quantitative transcript profiling method relies on efficient computational tools for data generation, management and analysis, plus a good quality experimental validation of these genes through methods such as the quantitative real time PCR.
Here we made use of our results from an in sílico identification of differentially expressed genes in EST libraries of three different pig breeds (Duroc, Large White and Brazilian naturalized Piau) to annotate their metabolic path and select differentially expressed genes related to muscularity to analyze through qRT-PCR their expression profile in pre- and postnatal stages from commercial breed animals.
Material and Methods
All methods involving animal handling was done in accordance with regulations approved by the institutional animal welfare and ethics/protection commission of the Federal University of Viçosa(UFV; DVT- UFV 02/2008).
EST dataset
Differentially expressed genes identification
First, ESTs were submitted to CAP3 program (http://deepc2.psi.iastate.edu/aat/cap/cap.html), for clustering and assembling into contigs with the parameters set greater than 80% similarity over at least a 40-bp fragment. ESTs that did not form contigs were designated as singletons. The number of sequences on each contig was determined and used to construct a table for further analysis. Functional annotation of ESTs for the three sets of data was performed using the program BlastX (Altschul et al., 1990) using an e-value ≤ 10-05, against the data base of transcripts from SwissProt (http://www.expasy.ch/sprot/). The results for each gene identified were normalized using the total number of ESTs in each library and defined as values of relative expression for the identification of DEGs using the IDEG6 program, available online at the web server (http://telethon.bio.unipd.it/bioinfo/). This software calculates the values of six different statistical tests used for the identification of differentially expressed genes in multiple tag sampling experiments. For pair-wise comparisons, we applied the AC statistic (Audic and Claverie, 1997), Fisher’s 2x2 exact test and 2x2 Chi2 test, and in multiple comparisons the R statistic (Stekel et al., 2000), GT statistic (Greller and Tobin, 1999), and general Chi2 test were used. For each test the associated significance thresholds (<0.05) were applied using the Bonferroni correction and the differentially expressed genes were identified.
Gene Network Analysis
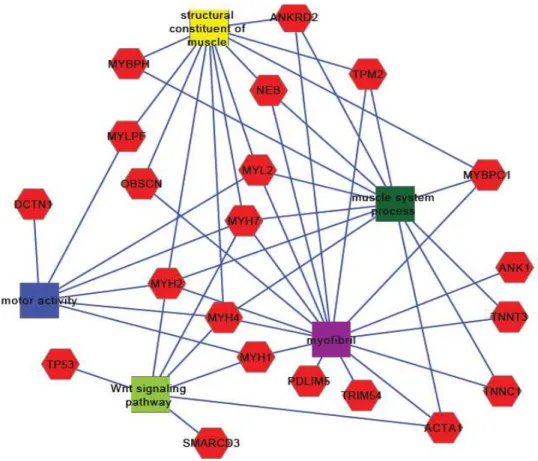
Aiming to examine the process of shared pathways, the Ensembl gene identifiers can be used. These gene identifiers were extracted from Ensembl Biomart web site (http://www.ensembl.org/biomart/martview/02295617921911c90441a7a165cd0f7f). The program TOPPCLUSTER (http://toppcluster.cchmc.org/) was used to obtain the functional Gene Ontology (GO), identifying the biological mechanisms and pathways and functions involving the differentially expressed genes. The application Cytoscape (www.cytoscape.org/) was used to visualize and edit the identified pathways. Only networks that include direct relationships between genes and muscularity have been maintained. Based on the functional genes annotated as differentially expressed, we obtained a list (Table 1) of 13 candidate genes for experimental validation by qRT-PCR.
Quantitative real-time PCR of differentially expressed genes
Tissue samples
prior to RNA isolation. In the same way, samples of LD from Commercial castrated males in three different ages, 107 days (n=3), 121 days (n=3) and 171days (n=3) postnatal, were isolated and stored.
RNA isolation and Reverse transcription
Total RNA was isolated from the muscle with RNeasy ® Mini Kit (QIAGEN, Valencia, CA, USA). The total concentration of RNA was estimated in a spectrophotometer NanoVueTM Plus (GE Healtchare, Germany) and quality at the Agilent 2100 Bioanalyzer © (Agilent Technologies, Palo Alto, Calif.) obtained an 7.6 average RIM quality value. RNA samples were kept at -70o C until cDNA synthesis reactions (reverse transcriptase). More details about the animals and RNA extraction were described by Serão et al. (2010) and Sollero et al. (2010).The first strand of cDNA synthesis was performed using ProtoScript® M-MuLV First-Strand cDNA Synthesis Kit (New England Biolabs Inc., Beverly, MA) and its concentration was estimated in a spectrophotometer NanoVue TM Plus (GE Healtchare, Germany). Subsequently, the cDNA samples were kept at -20 °C until the completion of the PCR reactions in real time.
Quantitative real-time PCR analysis
The qRT-PCR reactions were performed in thermal cycler ABI Prism 7300 Sequence Detection Systems (Applied Biosystems, Foster City, CA, USA) using GoTaq® qPCR Master Mix (Promega Corporation, Madison, USA). Amplification conditions for all systems were: 95 °C for 2 minutes, 40 cycles of denaturation at 95 °C for 15 seconds, and extension at 60 °C for 60 seconds. After 40 cycles of amplification, an additional step with a gradual increase in temperature of 60 to 95 °C was used to obtain the dissociation curve. The best primers and cDNA amplification conditions were used for qRT-PCR analyzes. The amplification of target genes was performed at different wells and in duplicates (Livak and Schmittigen, 2001). The concentrations of primers and cDNA used in amplification reactions are shown in Table S1. The used experimental design was completely randomized, with three replicates per period (21, 40, 70 and 90 days of pregnancy; 107, 121 and 171 days after birth of castrated white commercial males). Initially, data from qRT-PCR were analyzed using the linear mixed model, described below.
Where:
is the measured expression level of gene i on animal j in the period k; is the effect of gene i in period k; is a random sample-specific effect (common to both
genes), ~N(0, σ2D ); and Eijk is a residual term., ~ N(0, σ2e ).
values from a period to the following was performed by CONTRAST statement of the GLM procedure (SAS software) using t-student test.
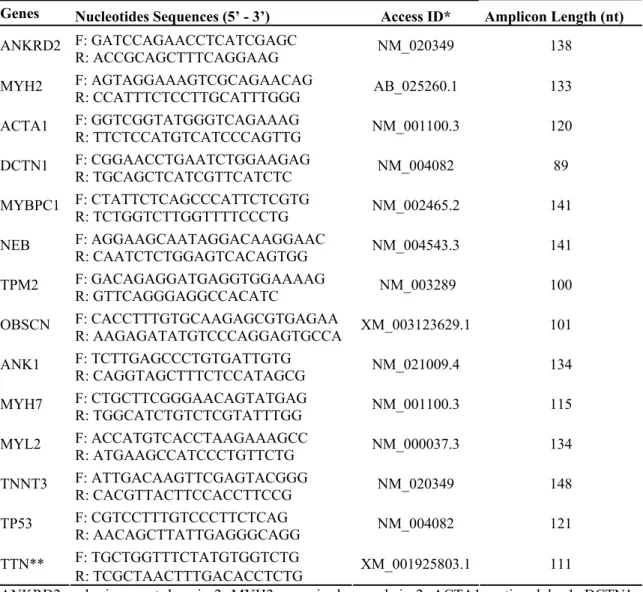
Gene target sequence was recovered from nucleotide sequences obtained from the GenBank database (www.ncbi.nlm.nih.gov). These sequences were used to construct primers by the PrimerQuest program available at (www.idtdna.com/SciTools/Applications/primerQuest) provided by Integrated DNA Technologies, Inc (Coralville, IA). Nucleotide sequence of the primers and accession numbers of nucleotide sequences are summarized in Table 1.
Table 1. Nucleotide sequence of the primers and accession number of nucleotide sequences used in qRT-PCR reactions identified as differentially expressed across the EST libraries analyzed.
Genes Nucleotides Sequences (5’ - 3’) Access ID* Amplicon Length (nt)
F: GATCCAGAACCTCATCGAGC ANKRD2
R: ACCGCAGCTTTCAGGAAG NM_020349 138
F: AGTAGGAAAGTCGCAGAACAG MYH2
R: CCATTTCTCCTTGCATTTGGG AB_025260.1 133 F: GGTCGGTATGGGTCAGAAAG
ACTA1
R: TTCTCCATGTCATCCCAGTTG NM_001100.3 120 F: CGGAACCTGAATCTGGAAGAG
DCTN1
R: TGCAGCTCATCGTTCATCTC NM_004082 89
F: CTATTCTCAGCCCATTCTCGTG MYBPC1
R: TCTGGTCTTGGTTTTCCCTG NM_002465.2 141 F: AGGAAGCAATAGGACAAGGAAC
NEB
R: CAATCTCTGGAGTCACAGTGG NM_004543.3 141 F: GACAGAGGATGAGGTGGAAAAG
TPM2
R: GTTCAGGGAGGCCACATC NM_003289 100 F: CACCTTTGTGCAAGAGCGTGAGAA
OBSCN
R: AAGAGATATGTCCCAGGAGTGCCA XM_003123629.1 101 F: TCTTGAGCCCTGTGATTGTG
ANK1
R: CAGGTAGCTTTCTCCATAGCG NM_021009.4 134 F: CTGCTTCGGGAACAGTATGAG
MYH7
R: TGGCATCTGTCTCGTATTTGG NM_001100.3 115 F: ACCATGTCACCTAAGAAAGCC
MYL2
R: ATGAAGCCATCCCTGTTCTG NM_000037.3 134 F: ATTGACAAGTTCGAGTACGGG
TNNT3
R: CACGTTACTTCCACCTTCCG NM_020349 148 F: CGTCCTTTGTCCCTTCTCAG
TP53
R: AACAGCTTATTGAGGGCAGG NM_004082 121 F: TGCTGGTTTCTATGTGGTCTG
TTN**
R: TCGCTAACTTTGACACCTCTG XM_001925803.1 111 ANKRD2- ankyrin repeat domain 2; MYH2- myosin, heavy chain 2; ACTA1- actin, alpha 1; DCTN1- dynactin 1; MYBPC1- myosin binding protein C; NEB- nebulin; TPM2- tropomyosin, 2; OBSCN- obscurin; ANK1- ankyrin 1; MYH7- myosin, heavy chain 7; MYL2- myosin, light chain 2; TNNT3- troponin T, type 3; TP53- tumor protein, p53 and TTN- titin * Access ID: GenBank database identification (www.ncbi.nlm.nih.gov). ** Internal control gene.
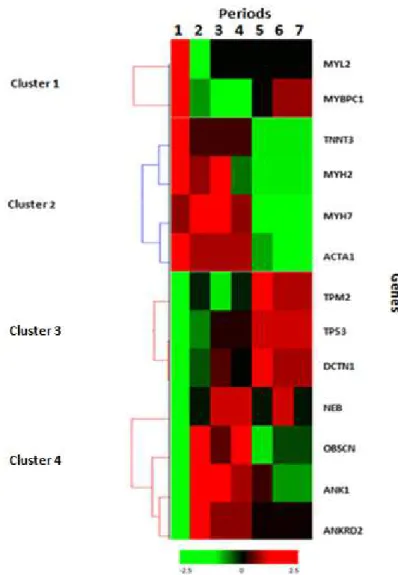
Hierarchical clustering was performed on qRT-PCR data (Eisen et al. 1998). ΔCt values (target Ct – endogenous Ct) were used in the analysis (Dittmer et al. 2005). The set of muscle-specific genes expression values across seven periods was used for unsupervised hierarchical clustering based on Complete Linkage method with Pearson Correlation as a distance (Eisen et al. 1998).
Results
Differentially expressed genes identification
The CAP3 sequence assembly program was used to group redundant ESTs which had overlapping sequences from all three libraries. A consensus sequence was obtained for each contig, and every EST present in the contig was considered a copy of the transcript from the same gene sequence. Three thousand six hundred and seventy unique sequences representing putative transcripts from pig breeds forming 905 contigs (merged overlapping sequences) and 2765 singletons were obtained, defined as sequences that did not assemble into contigs using the defined assembly parameters. After BlastX of all 905 contig against SwissProt data base and further IDEG6 analysis, a total of 54 differentially expressed genes (DEGs) were identified, 34 represented coding genes for known proteins as following on supplementary data (Table S2).
Gene Networks Analyses
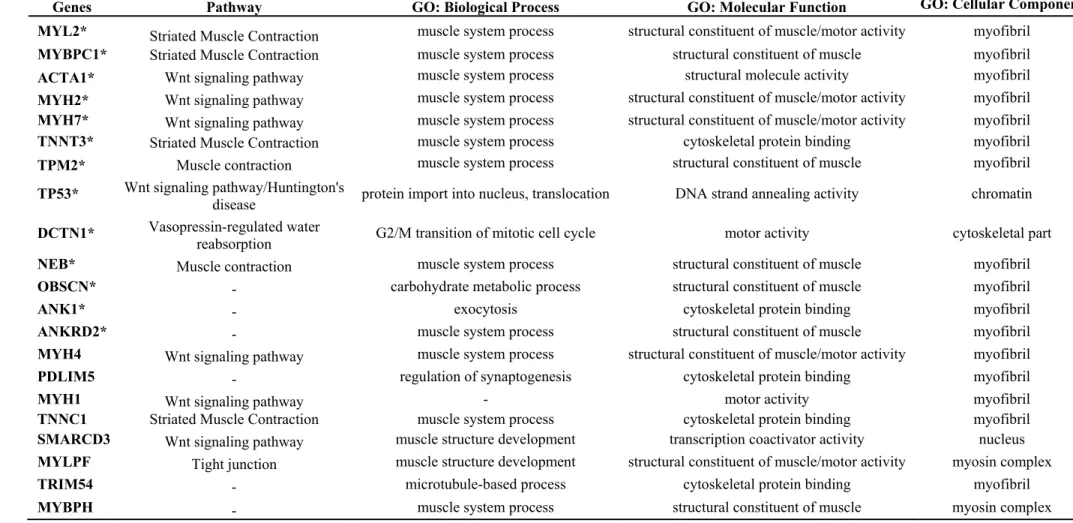
Table 2. Pathway, biological process, molecular function and cellular component from genes represented in the network. There are 21 genes related with muscle tissue development.
Genes Pathway GO: Biological Process GO: Molecular Function GO: Cellular Component
MYL2* Striated Muscle Contraction muscle system process structural constituent of muscle/motor activity myofibril
MYBPC1* Striated Muscle Contraction muscle system process structural constituent of muscle myofibril
ACTA1* Wnt signaling pathway muscle system process structural molecule activity myofibril
MYH2* Wnt signaling pathway muscle system process structural constituent of muscle/motor activity myofibril
MYH7* Wnt signaling pathway muscle system process structural constituent of muscle/motor activity myofibril
TNNT3* Striated Muscle Contraction muscle system process cytoskeletal protein binding myofibril
TPM2* Muscle contraction muscle system process structural constituent of muscle myofibril
TP53* Wnt signaling pathway/Huntington's
disease protein import into nucleus, translocation DNA strand annealing activity chromatin
DCTN1* Vasopressin-regulated water
reabsorption G2/M transition of mitotic cell cycle motor activity cytoskeletal part
NEB* Muscle contraction muscle system process structural constituent of muscle myofibril
OBSCN* - carbohydrate metabolic process structural constituent of muscle myofibril
ANK1* - exocytosis cytoskeletal protein binding myofibril
ANKRD2* - muscle system process structural constituent of muscle myofibril
MYH4 Wnt signaling pathway muscle system process structural constituent of muscle/motor activity myofibril
PDLIM5 - regulation of synaptogenesis cytoskeletal protein binding myofibril
MYH1 Wnt signaling pathway - motor activity myofibril
TNNC1 Striated Muscle Contraction muscle system process cytoskeletal protein binding myofibril
SMARCD3 Wnt signaling pathway muscle structure development transcription coactivator activity nucleus
MYLPF Tight junction muscle structure development structural constituent of muscle/motor activity myosin complex
TRIM54 - microtubule-based process cytoskeletal protein binding myofibril
Quantitative real-time PCR of differentially expressed genes
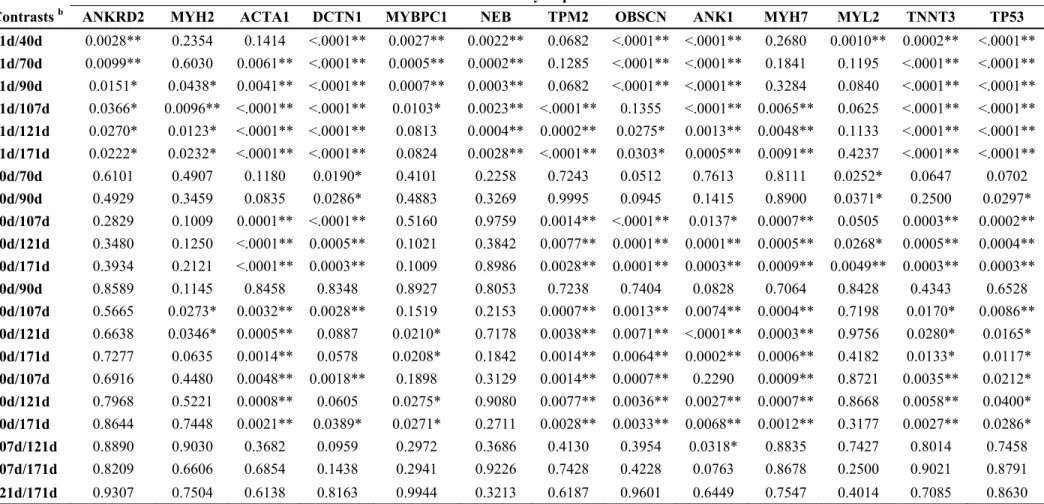
Table 3. p values for differential expression values for each gene in the comparison between periods.
Differentially Expressed Genes a
Contrasts b ANKRD2 MYH2 ACTA1 DCTN1 MYBPC1 NEB TPM2 OBSCN ANK1 MYH7 MYL2 TNNT3 TP53
21d/40d 0.0028** 0.2354 0.1414 <.0001** 0.0027** 0.0022** 0.0682 <.0001** <.0001** 0.2680 0.0010** 0.0002** <.0001**
21d/70d 0.0099** 0.6030 0.0061** <.0001** 0.0005** 0.0002** 0.1285 <.0001** <.0001** 0.1841 0.1195 <.0001** <.0001**
21d/90d 0.0151* 0.0438* 0.0041** <.0001** 0.0007** 0.0003** 0.0682 <.0001** <.0001** 0.3284 0.0840 <.0001** <.0001**
21d/107d 0.0366* 0.0096** <.0001** <.0001** 0.0103* 0.0023** <.0001** 0.1355 <.0001** 0.0065** 0.0625 <.0001** <.0001**
21d/121d 0.0270* 0.0123* <.0001** <.0001** 0.0813 0.0004** 0.0002** 0.0275* 0.0013** 0.0048** 0.1133 <.0001** <.0001**
21d/171d 0.0222* 0.0232* <.0001** <.0001** 0.0824 0.0028** <.0001** 0.0303* 0.0005** 0.0091** 0.4237 <.0001** <.0001**
40d/70d 0.6101 0.4907 0.1180 0.0190* 0.4101 0.2258 0.7243 0.0512 0.7613 0.8111 0.0252* 0.0647 0.0702
40d/90d 0.4929 0.3459 0.0835 0.0286* 0.4883 0.3269 0.9995 0.0945 0.1415 0.8900 0.0371* 0.2500 0.0297*
40d/107d 0.2829 0.1009 0.0001** <.0001** 0.5160 0.9759 0.0014** <.0001** 0.0137* 0.0007** 0.0505 0.0003** 0.0002**
40d/121d 0.3480 0.1250 <.0001** 0.0005** 0.1021 0.3842 0.0077** 0.0001** 0.0001** 0.0005** 0.0268* 0.0005** 0.0004**
40d/171d 0.3934 0.2121 <.0001** 0.0003** 0.1009 0.8986 0.0028** 0.0001** 0.0003** 0.0009** 0.0049** 0.0003** 0.0003**
70d/90d 0.8589 0.1145 0.8458 0.8348 0.8927 0.8053 0.7238 0.7404 0.0828 0.7064 0.8428 0.4343 0.6528
70d/107d 0.5665 0.0273* 0.0032** 0.0028** 0.1519 0.2153 0.0007** 0.0013** 0.0074** 0.0004** 0.7198 0.0170* 0.0086**
70d/121d 0.6638 0.0346* 0.0005** 0.0887 0.0210* 0.7178 0.0038** 0.0071** <.0001** 0.0003** 0.9756 0.0280* 0.0165*
70d/171d 0.7277 0.0635 0.0014** 0.0578 0.0208* 0.1842 0.0014** 0.0064** 0.0002** 0.0006** 0.4182 0.0133* 0.0117*
90d/107d 0.6916 0.4480 0.0048** 0.0018** 0.1898 0.3129 0.0014** 0.0007** 0.2290 0.0009** 0.8721 0.0035** 0.0212*
90d/121d 0.7968 0.5221 0.0008** 0.0605 0.0275* 0.9080 0.0077** 0.0036** 0.0027** 0.0007** 0.8668 0.0058** 0.0400*
90d/171d 0.8644 0.7448 0.0021** 0.0389* 0.0271* 0.2711 0.0028** 0.0033** 0.0068** 0.0012** 0.3177 0.0027** 0.0286*
107d/121d 0.8890 0.9030 0.3682 0.0959 0.2972 0.3686 0.4130 0.3954 0.0318* 0.8835 0.7427 0.8014 0.7458
107d/171d 0.8209 0.6606 0.6854 0.1438 0.2941 0.9226 0.7428 0.4228 0.0763 0.8678 0.2500 0.9021 0.8791
121d/171d 0.9307 0.7504 0.6138 0.8163 0.9944 0.3213 0.6187 0.9601 0.6449 0.7547 0.4014 0.7085 0.8630
Discussion
Comparison of three sequenced cDNA libraries from divergent genetic background identified sequences that were differentially expressed among them. The comparison of results derived from the six statistical tests showed that they produced different results, indicating divergence among them (Table S3). The Chi2 test was the most sensitive, recovering most of the significant cases. In contrast, the GT test alone
was not sufficient to detect subtle divergences in the analyzed data. This observation
was consistent with results based on theoretical and observed data from Romualdi et al., 2001, who considered the use of AC and Chi2 as the most appropriate combination to test deferential distribution in multiple tag sampling experiments with cDNA libraries.
For a better understanding of the differentially expressed genes biological role, we performed a qRT-PCR across seven periods (four pre-natal and three post-natal). During prenatal stage nine genes showed a higher expression in at least one period (ANKRD2, MYBPC1, NEB, DCTN1, MYL2, TP53, TPM2, OBSCN and ANK1) and four during postnatal (MYH2, ACTA1, MYH7 and TNNT3).
Prenatal over expressed
During embryo growth there is the occurrence of two muscle development waves, the first during 35-55 days and the other during 55-90 days of pregnancy (Wigmore and Stickland, 1983). Here two genes (MYL2 and MYBPC1) had high expression in critical periods of pre-natal stage forming the Cluster 1 (Figure 2) at the network described above they are connected with myofibril, muscle system process and structural constituent of the muscle as expected with the exception of MYL2 which is also related to motor activity.
Myosin light chains (MYLs) are the main components in myofibrils and are associated with myosin heavy chain heads. According to their conditions of dissociation, MYLs are divided into two classes (Barton et al., 1985; Hailstones et al., 1990). One is called the regulatory (or phosphorylatable) light chain (i.e. MYL2) and the other is the alkali light chain (i.e. MYL1, MYL3 and MYL4). Each class has several isoforms associated with different muscle types. It has been speculated that MYL may be involved in myogenesis or muscle regeneration through its function in myogenic cells (Zhang et al. 2009). The MYL2 gene expression profile in this study contrasting with 21d/40d (P<0.01) and 40d/70d (P<0.05) showed a single peak of high expression at 40 days of pregnancy (Figure 2), which coincide with the primary generation stage of muscle formation which is between 35 and 60 days of pregnancy (Wigmore and Stickland, 1983). Our findings are in agreement with Zhang et al., 2009, supporting the hypothesis of MYL2 to be involved in myogenesis.
coincides with the second generation of muscle fiber formation which is between 54 to 90 days of pregnancy (Wigmore and Stickland, 1983).
Three genes (TPM2, TP53 and DCTN1) showed a very low expression during postnatal stage (Cluster 3 on Figure 2). The TPM2 gene is showed to be differentially expressed across the stages (P<0.01), being more expressed during prenatal, demonstrating that it is playing a role during muscle development. TPM (tropomyosin) is a dimeric, coiled coil protein which interacts with troponin and actin, regulating skeletal muscle contraction and stabilizing the actin filament. In skeletal muscle, three major isoforms, TPM1, TPM2, and TPM3, are expressed. However, the conformation and function of the TPM dimmer is obscure, since the identification and quantification of the isoforms have not been clarified in the past studies (Oe et al. 2007). The postnatal expression profile found in this work agrees with results found by Różycki et al. 2011, where the expression level of TPM2 did not change significantly.
The p53 is encoded by human gene known as TP53; it is a tumor suppressor protein and responds to diverse cellular stresses to regulate target genes that induce cell cycle arrest, apoptosis, senescence, DNA repair, or changes in metabolism. This protein is expressed at low level in normal cells and at a high level in a variety of transformed cell lines, where it's believed to contribute to transformation and malignancy (May and May, 1999; Tyner et al., 2002). Here at the major network it is connected only with the subnet Wnt signaling pathway which is strongly related with embryogenesis path according with its expression profile. This gene showed to be highly expressed at the first period (21 days prenatal) going down at 40 days prenatal, and differing from all three postnatal periods (P<0.01).
The DCTN1 had a high expression at the first period (21d) but its expression at 40 days was also high (P<0.05) when comparing with the other five periods (Table 3).The DCTN1 gene provides a protein called dynactin-1 which has at least two different versions differing in size; the larger version is called p150-glued, and the smaller version is called p135. Dynactin contributes significantly to cytoplasmic organization and subcellular motility at all stages of the cell cycle. Its ability to bind motors, microtubules, and cargo structures allows dynactin to link a wide variety of cellular components to the cytoskeleton (Schroer, 2004). For these reasons it is believed to be connected with motor activity subnet. The DCTN1 high expression level during the first and second period seems to play a role during the embryo stage.
According to gene expression profile it was possible to see a cluster (Cluster 4) with four genes (ANKRD2, NEB, OBSCN and ANK1) having a very high expression level at 21 days of gestation (Figure 2). ANKRD2 is a member of the Muscle Ankyrin Repeat Protein family (MARPs), consisting of sarcomere-associated proteins that can also localize in the nucleus. Results in mice suggest that ANKRD2 gives an important contribution to the coordination of proliferation and apoptosis during myogenic differentiation in vitro, mainly through the p53 network (Bean et al. 2008). Another gene from this cluster, Nebulin (NEB) is a giant modular sarcomeric protein that has been proposed to play critical roles in myofibrillogenesis, thin filament length regulation, and muscle contraction (Bang et al. 2006). It is present at the same subnets as ANKRD2: myofibril, muscle system process and structural constituent of the muscle. In Figure 2 we can see the ANKRD2 and NEB expression level being high at 21 days (P<0.01) and after that being low across all other six periods.
with the exception of the fifth period (107 days of adult age) in which ANK1 had almost the same expression level as period four (90 days of pregnancy). The OBSCN encodes a protein which belongs to the family of giant sarcomeric signaling proteins which includes Titin and Nebulin, and may have a role in the organization of myofibrils during assembly and may mediate interactions between the sarcoplasmic reticulum and myofibrils (Young et al. 2001). There are reports about this gene where it is positively correlated with intra muscular fat content in adult pigs (Serão et al., 2010). On our network it was connected with myofibril and structural constituent of the muscle subnets. The ANK1 gene belongs to a family of proteins that link the integral membrane proteins to the underlying spectrin-actin cytoskeleton and plays key roles in activities such as cell motility, activation, proliferation, contact and the maintenance of specialized membrane domains (Wimmers et al., 2007), and it was linked only with myofibril subnet.
Postnatal over expressed
On this cluster four genes were found (MYH2, MYH7, ACTA1 and TNNT3) which may play a role in hypertrophy once a higher expression during postnatal stage is observed for them. The two first belongs to a sarcomeric myosin heavy chain (MHC) family consisting of at least eleven isoforms (Weiss et al., 1996). The MYH2, MYH1 and MYH4 genes encode the protein isoforms commonly termed MHC IIA, IIX and IIB (Tonge et al., 2010). Of the eleven sarcomeric isoforms genes of MHC, four are known to be expressed in adult skeletal muscle: one "slow-twitch" (Type I or MYH7) associated MHC isoform and three "fast-twitch" (Types IIA, IIX and IIB) muscle-associated isoforms. Here MYH2 and MYH7 are at the same subnets, also with Wnt signaling pathway even their expression level showing to be high only during postnatal stage (Figure 2). The MYH2 gene had two points during prenatal stage being statistically less expressed which was at 21d and 70d (P<0.05), while MYH7 gene had all prenatal periods being less expressed than postnatal (P<0.01).
As in MYH2 and MYH7, ACTA1 and TNNT3 genes showed a similar expression profile. ACTA1 is founded in six different actin isoforms which are highly conserved across species with more than 90% similarity in their amino acid sequence. Four of them are muscle-specific isoforms which are expressed in different types of muscle tissues, and are functionally involved in muscle contraction (Ilkovski et al., 2005); the α-skeletal actin (ACTA1) is a very important type in this group. It was linked to the Wnt signaling pathway, myofibril and muscle system process according to its property. Here its expression profile showed low levels at prenatal stage (P<0.01) and high at postnatal. Troponin T (TnT) in vertebrates occurs in three tissue-specific forms of striated muscle: fast skeletal TnT, slow skeletal TnT and cardiac TnT (Perry, 1998),
each isoform is encoded by a separate gene, in humans TNNT3, TNNT1 and TNNT2,
respectively (Mao et al.,1996). There are reports where the expression levels of TNNT3
gene showed to be not differentially related to the pig slaughter age of Polish commercial animals line (Różycki et al., 2011). In our finds this gene had a higher expression during postnatal stage while the expression level in prenatal stage was lower (P<0.01), which means that this gene even though does not differ during postnatal periods may play an important role on that stage.
Only few genes analysed at the present study have been previously described in relation to their expression profile during the mentioned stages in skeletal muscle. We could find a few studies during postnatal life which agree with our results about TPM2
are connected by muscle system process and myofibril subnets. The TPM2 gene in human is expressed in both pre- and postnatal stage (Wang et al. 2003), but our results showed a high expression during fetal growth going down at postnatal stage demonstrating a differential of expression between them. Other genes known to be related with myogenic stage as ANKRD2 (Bean et al. 2008), MYBPC1 (Gautel et al., 1998 and Kurasawa et al., 1999), NEB (Bang et al., 2006) and MYL2 (Zhang et al., 2009) also showed a prenatal high expression in this study and are connected by muscle system process, structural constituent of muscle and myofibril subnets at the major network.
Besides, new candidates for muscle development (TP53 and DCTN1) can be listed. Here they showed a high expression level during the first muscle development wave which was at 21 and 40 days of pregnancy and are connected with Wnt signaling pathway and motor activity subnets respectively. The network constructed can be helpful to better understand the molecular mechanisms involved with skeletal muscle. However, this is a complex trait that is subject to action from a large number of genes in muscle that are regulated by several transcription factors.
Conclusion
The computational approaches allowed the identification of genes being differentially expressed, by their functional annotation. It was possible to find genes with obvious roles in muscle physiology such as those that encode proteins of cytoskeleton allowing inserting these genes into relevant functional networks. These can be helpful to better understand the molecular mechanisms responsible for the process of muscularity. In this work, the functional analysis results suggest an interaction between 21 differentially expressed genes mapped in the same genetic network. The present study also provides rich new information resource about genes from which are cited to be involved in myogenesis for the first time increasing our understanding of the molecular mechanisms underlying pig skeletal muscle development. Our comparative analysis of the prenatal and postnatal skeletal muscle specific genes suggests that there are genes which play important role for one stage more than to another. This finding could contribute to better explaining genes function mechanism. More generally, our data are likely to be helpful in uncovering the pathways that mediate prenatal and postnatal muscle development in vertebrates. A number of differentially expressed genes were identified across stages associated with meat production traits, which may be commercially valuable.
Authors’ contributions
SEFG and PSL conceived of the study, and participated in its design and coordination. CSN and JOP performed of the biological analysis and the EST sequencing under the guidance of MFMG and SEFG. LLV and CSN were responsible for the bioinformatics and qRT-PCR analysis and wrote the manuscript with the help of SEFG. All authors have read and approved the final manuscript.
Acknowledgements
References
Altschul SF, Gish W, Miller W, Myers EW et al. Basic local alignment search tool.
Journal of Molecular Biology 1990, 215:403–410.
Altschul SF, Madden TL, Schaffer AA, Zhang J et al. Gapped BLAST and PSI-BLAST: A new generation of protein database search programs. Nucleic Acids Research 1997, 25:3389–3402.
Bang ML, Li X, Littlefield R, Bremner S et al. Nebulin-deficient mice exhibit shorter thin filament lengths and reduced contractile function in skeletal muscle.
Journal of Cell Biology 2006, 173:905-916.
Barton P J, Buckingham M E: The myosin alkali light chain proteins and their genes. Biochemical Journal 1985, 231: 249-261
Bean C, Facchinello N, Faulkner G, Lanfranchi G: The effects of Ankrd2 alteration indicate its involvement in cell cycle regulation during muscle differentiation. Biochimica et Biophysica Acta (BBA) - Molecular Cell Research, 2008, 1783(6):1023-1035.
Dittmer D P, Gonzalez C M, Vahrson W, DeWire S M, Hines-Boykin R and Damania B. Whole-Genome Transcription Profiling of Rhesus Monkey
Rhadinovirus. Journal of Virology, 2005, 79 (13):8637-8650.
Eisen M B, Spellman P T, Brown P O and Botstein D. Cluster analysis and display of genome-wide expression patterns. Proceedings of National Academy of Sciences of United States of America 1998 95:14863–14868.
Gautel M, Furst DO, Cocco A, Schiaffino S: Isoform transitions of the myosin binding protein C family in developing human and mouse muscles: lack of isoform transcomplementation in cardiac muscle. Circulation Research 1998, 82:124-129.
Gorodkin J., Cirera S., Hedegaard J. et al: Porcine transcriptome analysis based on 97 non-normalized cDNA libraries and assembly of 1,021,891 expressed sequence tags. Genome Biology 2007, 8:R45
Greller LD, Tobin FL: Detecting selective expression of genes and proteins. Genome Research 1999, 9: 282–296.
Ilkovski B, Clement S, Sewry C, North KN, Cooper ST: Defining alpha-skeletal and alpha-cardiac actin expression in human heart and skeletal muscle explains the absence of cardiac involvement in ACTA1 nemaline myopathy.
Neuromuscular Disorders 2005, 15:829–835.
Kurasawa M, Sato N, Matsuda A, Koshida S, Totsuka T, Obinata T: Differential expression of C-protein isoforms in developing and degenerating mouse striated muscles. Muscle Nerve 1999, 22:196-207.
Livak KJ, Schmittigen TD: Analysis of relative gene expression data using real-time quantitative PCR and the 2DDCt method. Methods 2001, 25: 402-408.
Mao C., Baumgartner A.P., Jha P.K., Huang T.H.-M. Sarkar S: Assignment of the human fast skeletal troponin T gene (TNNT3) to chromosome 11p15.5: evidence for the presence of 11pter in a monochromosome 9 somatic cell hybrid in NIGMS Mapping Panel 2. Genomics 1996, 31:385-388.
May, P. and May, E: Twenty years of p53 research: structural and functional aspects of the p53 protein. Oncogene 1999, 18:7621–36.
Murray D, Doran P, MacMathuna P, Moss AC: In silico gene expression analysis – an overview. Molecular Cancer 2007, 6:50.
Oakley CE, Chamoun J, Brown LJ, Hambly BD: Myosin binding protein-C: enigmatic regulator of cardiac contraction. The International Journal of Biochemistry and Cell Biology 2007, 39:2161-2166.
Oe M, Ohnishi-Kameyama M, Nakajima I, Muroya S, Chikuni K: Muscle type specific expression of tropomyosin isoforms in bovine skeletal muscles. Meat Science
2007, 75: 558–563.
Pfaffl MW: A new mathematical model for relative quantification in real time RT-PCR. Nucleic Acids Research 2001,29(9):e45.
Perry S.V: Troponin T: genetics, properties and function. Journal of Muscle Research and Cell Motility 1998, 19:575-602.
Radoniæ A, Thulke S, Mackay IM, Landt O, Siegert W, Nitsche A: Guideline to reference gene selection for quantitative real-time PCR. Biochemical and Biophysical Research Communications 2004, 313:856-862.
Rehfeldt, C, I Fiedler, G Dietl, and K Ender: Myogenesis and postnatal skeletal muscle cell growth as influenced by selection. Livestock Production Science
2000,66:177–188.
Rehfeldt, C, I Fieldler and NC Stickland: Number and Size of Muscle Fibres in Relation to Meat Production. In: MFW te Pas, ME Everts and HP Haagsman,
Romualdi C, Bortoluzzi S, and Danieli GA. Detecting differentially expressed genes in multiple tag sampling experiments. Comparative evaluation of statistical tests. Human Molecular Genetics 2001, 10: 2133–2141.
Różycki M, Piórkowska K, Oczkowicz M. Expression of contractile protein-encoding genes TPM2 and TNNT3 during ontogenesis in pigs raised in Poland. Animal Science Papers and Reports, 2011 29 (1):65-74
Ryu, YC, Lee M-H, Lee S-K and Kim BC. Effects of muscle mass and fiber type composition of Longissimus dorsi muscle on postmortem metabolic rate and meat quality. Journal of Muscle Foods 200617: 343-352.
Schroer TA. Dynactin. Annu. Rev. Cell Dev. Biol. 2004, 20:759-79. Review.
Serão N, Veroneze R, Ribeiro A, Verardo LL, Braccini Neto J, Gasparino E, Campos C.F, Lopes P.S, Guimarães S.E.F: Candidate gene expression and intramuscular fat content in pigs. Journal of Animal Breending and Genetics
2010, JABG, 09:0151.R2.
Sollero BP, Guimarães SEF, Rilington V D, Tempelman R J, Raney N E, Steibel J P, Guimarães J D, Lopes P S, Lopes M S and Ernst C W. Transcriptional profiling
during foetal skeletal muscle development of Piau and Yorkshire–Landrace cross-bred pigs. Animal Genetics,doi:10.1111/j.1365-2052.2011.02186.x
Steibel JP, Poletto R, Coussens PM, Rosa GJM: A powerful and flexible linear mixed model framework for the analysis of relative quantification RT-PCR data.
Genomics 2009, 94:146–152.
Stekel DJ, Git Y, Falciani F: The comparison of gene expression from multiple cDNA libraries. Genome Research 2000, 10: 2055–2061.
te Pas MF, De Wit AA, Priem J, Cagnazzo M, Davoli R, Russo V, Pool MH: Transcriptome expression profiles in prenatal pigs in relation to myogenesis. Journal of Muscle Research and Cell Motility 2005, 26:157-165. Tonge DP, Jones SW, Bardsley RG, Parr T: Characterisation of the sarcomeric
myosin heavy chain multigene family in the laboratory guinea pig. BMC Molecular Biology, 2010, 11:52.
Vandesompele J, De Preter K, Pattyn F, Poppe B, Van Roy N, De Paepe A, Speleman F: Accurate normalization of real-time quantitative RT-PCR data by geometric averaging of multiple internal control genes. Genome Biology
2002, 3:research0034-research0034.11
Wang H, Hubbell E, Hu J-s, Mei G, Cline M, Lu G, Clark T, Siani-Rose MA, Ares M, Kulp DC, Haussler D: Gene structure-based splice variant deconvolution using a microarry platform. Bioinformatics 2003, 19:315–322.
Weiss A, Leinwand LA: The mammalian myosin heavy chain gene family. Annual Review of Cell and Developmental Biology 1996, 12:417-439.
Wigmore PMC and Stickland NC: Muscle development in large and small pig fetuses. Journal of Anatomy 1983, 137: 235–245.
Wimmers K, Murani E, TePas M. F, Chang K. C, Davoli R, Merks J. W, Henne H, Muraniova M, daCosta N, Harlizius B, Schellander K, B ll I, Braglia S, deWit A. A, Cagnazzo M, Fontanesi L, Prins D, Ponsuksili S. Associations of functional candidate genes derived from gene-expression profiles of prenatal porcine muscle tissue with meat quality and muscle deposition.
Animal Genetics 2007, 38:474-484.
Young P, Ehler E, Gautel M: Obscurin, a giant sarcomeric Rho guanine nucleotide exchange factor protein involved in sarcomere assembly. The Journal of Cell Biology 2001 154 (1):123–36.
Supplementary data
Table S1. Deferentially expressed genes primer concentration and cDNA. Their concentrations were determinate through amplification efficiency as described by Pfaffl, 2001.
Genes* Primer Concentration (nM) cDNA concentration (ng)
ANKRD2 400 75
MYH2 400 25
ACTA1 200 25
DCTN1 400 25
MYBPC1 400 25
NEB 400 225
TTN 100 75
TPM2 400 75
OBSCN 100 25
ANK1 100 25
MYH7 400 75
MYL2 100 25
TNNT3 100 25
TP53 400 75
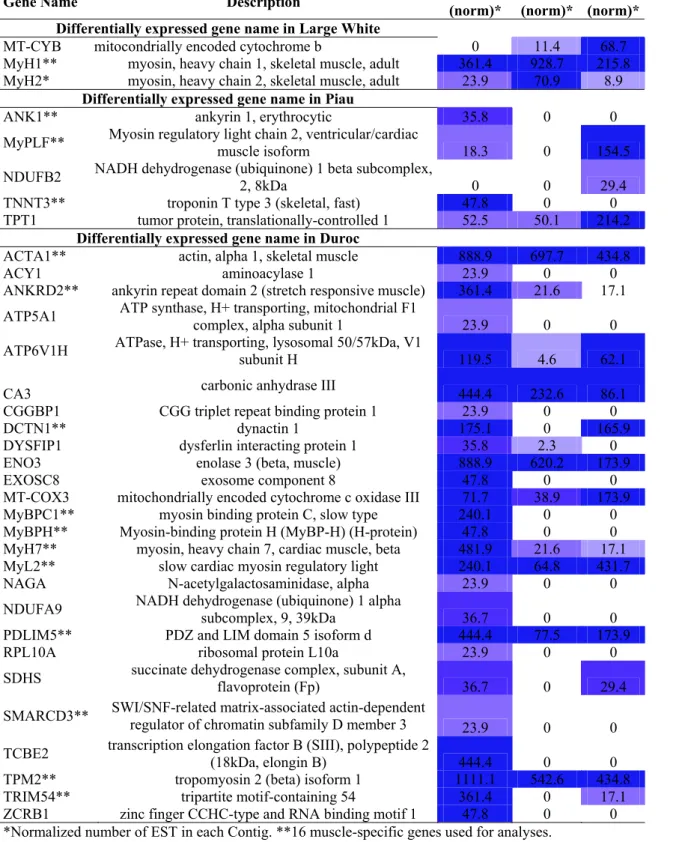
Table S2. Genes whose transcripts varied significantly depending on the abundance of ESTs in the libraries of three cDNA pig Semi-membransous muscle. 34 contigs with functional annotation showed differential expression. We applied the AC statistic, Fisher’s 2x2 exact test and 2x2 Chi2 test, and in multiple comparisons, the R statistic, GT statistic, and general Chi2 test were used. Cells with different degrees of blue color represent extent of gene expression.
Gene Name Description Duroc
(norm)*
LW (norm)*
Piau (norm)* Differentially expressed gene name in Large White
MT-CYB mitocondrially encoded cytochrome b 0 11.4 68.7 MyH1** myosin, heavy chain 1, skeletal muscle, adult 361.4 928.7 215.8 MyH2* myosin, heavy chain 2, skeletal muscle, adult 23.9 70.9 8.9
Differentially expressed gene name in Piau
ANK1** ankyrin 1, erythrocytic 35.8 0 0
MyPLF** Myosin regulatory light chain 2, ventricular/cardiac
muscle isoform 18.3 0 154.5
NDUFB2 NADH dehydrogenase (ubiquinone) 1 beta subcomplex,
2, 8kDa 0 0 29.4
TNNT3** troponin T type 3 (skeletal, fast) 47.8 0 0 TPT1 tumor protein, translationally-controlled 1 52.5 50.1 214.2
Differentially expressed gene name in Duroc
ACTA1** actin, alpha 1, skeletal muscle 888.9 697.7 434.8
ACY1 aminoacylase 1 23.9 0 0
ANKRD2** ankyrin repeat domain 2 (stretch responsive muscle) 361.4 21.6 17.1
ATP5A1 ATP synthase, H+ transporting, mitochondrial F1
complex, alpha subunit 1 23.9 0 0
ATP6V1H ATPase, H+ transporting, lysosomal 50/57kDa, V1
subunit H 119.5 4.6 62.1
CA3 carbonic anhydrase III 444.4 232.6 86.1 CGGBP1 CGG triplet repeat binding protein 1 23.9 0 0
DCTN1** dynactin 1 175.1 0 165.9
DYSFIP1 dysferlin interacting protein 1 35.8 2.3 0 ENO3 enolase 3 (beta, muscle) 888.9 620.2 173.9
EXOSC8 exosome component 8 47.8 0 0
MT-COX3 mitochondrially encoded cytochrome c oxidase III 71.7 38.9 173.9 MyBPC1** myosin binding protein C, slow type 240.1 0 0 MyBPH** Myosin-binding protein H (MyBP-H) (H-protein) 47.8 0 0 MyH7** myosin, heavy chain 7, cardiac muscle, beta 481.9 21.6 17.1 MyL2** slow cardiac myosin regulatory light 240.1 64.8 431.7 NAGA N-acetylgalactosaminidase, alpha 23.9 0 0
NDUFA9 NADH dehydrogenase (ubiquinone) 1 alpha
subcomplex, 9, 39kDa 36.7 0 0 PDLIM5** PDZ and LIM domain 5 isoform d 444.4 77.5 173.9
RPL10A ribosomal protein L10a 23.9 0 0
SDHS succinate dehydrogenase complex, subunit A,
flavoprotein (Fp) 36.7 0 29.4
SMARCD3** SWI/SNF-related matrix-associated actin-dependent
regulator of chromatin subfamily D member 3 23.9 0 0
TCBE2 transcription elongation factor B (SIII), polypeptide 2
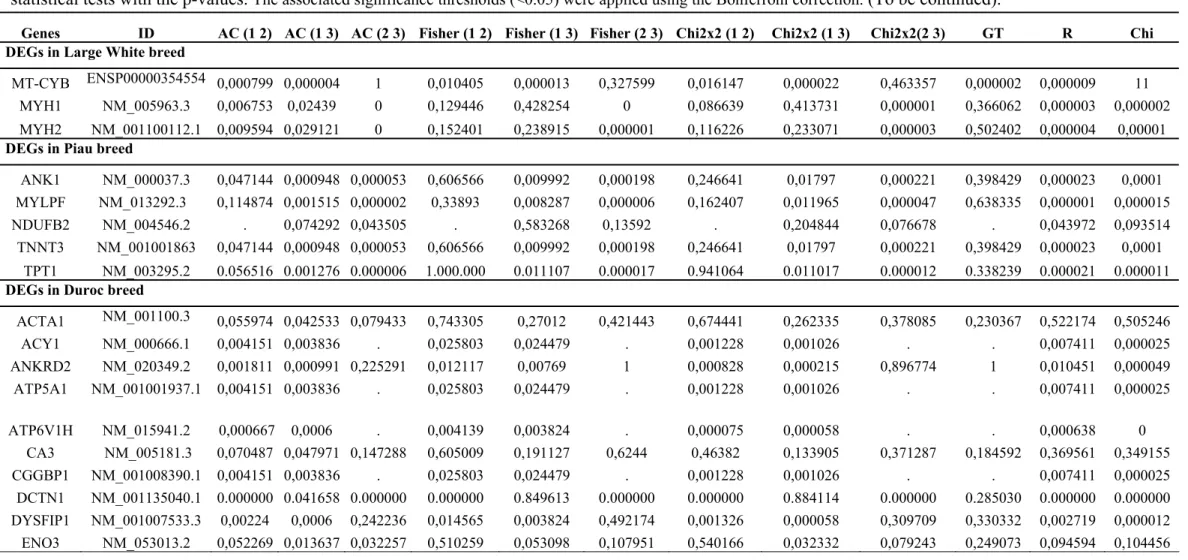
Table S3. 36 genes showing differential expression. The results are shown for the three libraries (Duroc, Large White and Piau) and considering six different statistical tests with the p-values. The associated significance thresholds (<0.05) were applied using the Bonferroni correction. (To be continued).
Genes ID AC (1 2) AC (1 3) AC (2 3) Fisher (1 2) Fisher (1 3) Fisher (2 3) Chi2x2 (1 2) Chi2x2 (1 3) Chi2x2(2 3) GT R Chi
DEGs in Large White breed
MT-CYB ENSP00000354554 0,000799 0,000004 1 0,010405 0,000013 0,327599 0,016147 0,000022 0,463357 0,000002 0,000009 11
MYH1 NM_005963.3 0,006753 0,02439 0 0,129446 0,428254 0 0,086639 0,413731 0,000001 0,366062 0,000003 0,000002 MYH2 NM_001100112.1 0,009594 0,029121 0 0,152401 0,238915 0,000001 0,116226 0,233071 0,000003 0,502402 0,000004 0,00001
DEGs in Piau breed
ANK1 NM_000037.3 0,047144 0,000948 0,000053 0,606566 0,009992 0,000198 0,246641 0,01797 0,000221 0,398429 0,000023 0,0001 MYLPF NM_013292.3 0,114874 0,001515 0,000002 0,33893 0,008287 0,000006 0,162407 0,011965 0,000047 0,638335 0,000001 0,000015 NDUFB2 NM_004546.2 . 0,074292 0,043505 . 0,583268 0,13592 . 0,204844 0,076678 . 0,043972 0,093514 TNNT3 NM_001001863 0,047144 0,000948 0,000053 0,606566 0,009992 0,000198 0,246641 0,01797 0,000221 0,398429 0,000023 0,0001
TPT1 NM_003295.2 0.056516 0.001276 0.000006 1.000.000 0.011107 0.000017 0.941064 0.011017 0.000012 0.338239 0.000021 0.000011
DEGs in Duroc breed
ACTA1 NM_001100.3 0,055974 0,042533 0,079433 0,743305 0,27012 0,421443 0,674441 0,262335 0,378085 0,230367 0,522174 0,505246 ACY1 NM_000666.1 0,004151 0,003836 . 0,025803 0,024479 . 0,001228 0,001026 . . 0,007411 0,000025 ANKRD2 NM_020349.2 0,001811 0,000991 0,225291 0,012117 0,00769 1 0,000828 0,000215 0,896774 1 0,010451 0,000049
ATP5A1 NM_001001937.1 0,004151 0,003836 . 0,025803 0,024479 . 0,001228 0,001026 . . 0,007411 0,000025
ATP6V1H NM_015941.2 0,000667 0,0006 . 0,004139 0,003824 . 0,000075 0,000058 . . 0,000638 0 CA3 NM_005181.3 0,070487 0,047971 0,147288 0,605009 0,191127 0,6244 0,46382 0,133905 0,371287 0,184592 0,369561 0,349155 CGGBP1 NM_001008390.1 0,004151 0,003836 . 0,025803 0,024479 . 0,001228 0,001026 . . 0,007411 0,000025
DCTN1 NM_001135040.1 0.000000 0.041658 0.000000 0.000000 0.849613 0.000000 0.000000 0.884114 0.000000 0.285030 0.000000 0.000000 DYSFIP1 NM_001007533.3 0,00224 0,0006 0,242236 0,014565 0,003824 0,492174 0,001326 0,000058 0,309709 0,330332 0,002719 0,000012
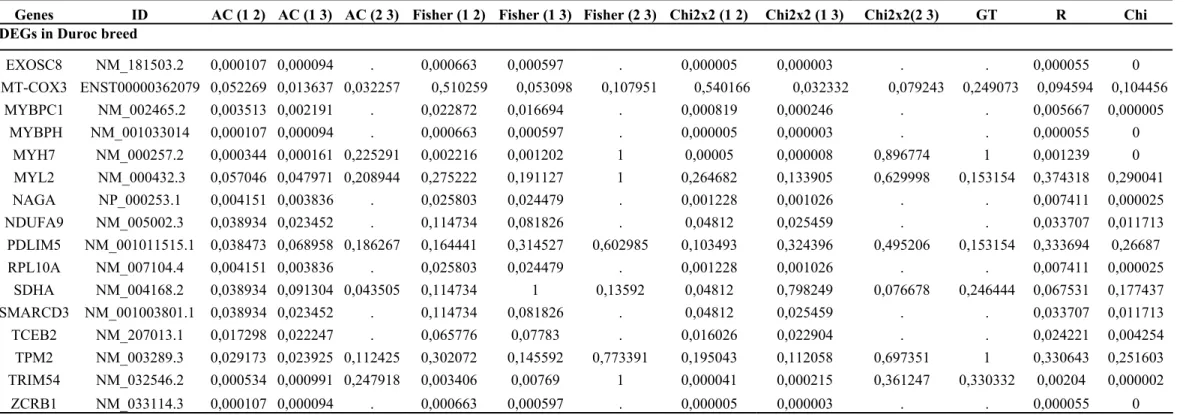
Table S3. 36 genes showing differential expression. The results are shown for the three libraries (Duroc, Large White and Piau) and considering six different statistical tests with the p-values. The associated significance thresholds (<0.05) were applied using the Bonferroni correction. (Continuation)
Genes ID AC (1 2) AC (1 3) AC (2 3) Fisher (1 2) Fisher (1 3) Fisher (2 3) Chi2x2 (1 2) Chi2x2 (1 3) Chi2x2(2 3) GT R Chi
DEGs in Duroc breed
EXOSC8 NM_181503.2 0,000107 0,000094 . 0,000663 0,000597 . 0,000005 0,000003 . . 0,000055 0 MT-COX3 ENST00000362079 0,052269 0,013637 0,032257 0,510259 0,053098 0,107951 0,540166 0,032332 0,079243 0,249073 0,094594 0,104456
MYBPC1 NM_002465.2 0,003513 0,002191 . 0,022872 0,016694 . 0,000819 0,000246 . . 0,005667 0,000005 MYBPH NM_001033014 0,000107 0,000094 . 0,000663 0,000597 . 0,000005 0,000003 . . 0,000055 0
MYH7 NM_000257.2 0,000344 0,000161 0,225291 0,002216 0,001202 1 0,00005 0,000008 0,896774 1 0,001239 0 MYL2 NM_000432.3 0,057046 0,047971 0,208944 0,275222 0,191127 1 0,264682 0,133905 0,629998 0,153154 0,374318 0,290041 NAGA NP_000253.1 0,004151 0,003836 . 0,025803 0,024479 . 0,001228 0,001026 . . 0,007411 0,000025 NDUFA9 NM_005002.3 0,038934 0,023452 . 0,114734 0,081826 . 0,04812 0,025459 . . 0,033707 0,011713
PDLIM5 NM_001011515.1 0,038473 0,068958 0,186267 0,164441 0,314527 0,602985 0,103493 0,324396 0,495206 0,153154 0,333694 0,26687 RPL10A NM_007104.4 0,004151 0,003836 . 0,025803 0,024479 . 0,001228 0,001026 . . 0,007411 0,000025
SDHA NM_004168.2 0,038934 0,091304 0,043505 0,114734 1 0,13592 0,04812 0,798249 0,076678 0,246444 0,067531 0,177437 SMARCD3 NM_001003801.1 0,038934 0,023452 . 0,114734 0,081826 . 0,04812 0,025459 . . 0,033707 0,011713
TCEB2 NM_207013.1 0,017298 0,022247 . 0,065776 0,07783 . 0,016026 0,022904 . . 0,024221 0,004254 TPM2 NM_003289.3 0,029173 0,023925 0,112425 0,302072 0,145592 0,773391 0,195043 0,112058 0,697351 1 0,330643 0,251603 TRIM54 NM_032546.2 0,000534 0,000991 0,247918 0,003406 0,00769 1 0,000041 0,000215 0,361247 0,330332 0,00204 0,000002
Chapter 3
Abstract. MicroRNAs are a class of naturally occurring non-coding RNAs. Typically they have ~22 nucleotides (nt) in length that suppress translation of their targets genes. Several laboratories have attempted to identify miRNAs from pigs and the bioinformatics strategies using ESTs have proved to be successful for this aim. In this study we report an in silico identification of ncRNA in pig EST libraries focusing on novel pig miRNAs and further investigated the differential expression of pigs miRNAs (known and novel) by quantitative real-time PCR during pre- and postnatal stage from commercial pig breed skeletal muscle tissue. From a total of 2286 EST sequences it was possible to identify by computational approaches two miRNAs showing an appropriate secondary structure and being not yet described in pigs. A substantial number of remaining no hit sequences showed homology with non-coding sequences as a Piwi-interacting RNA (piRNA) and others. Predicting the targets of miRNAs which had homology with pigs’ sequences we found a total of 503 potential miRNA targets for them. The miRNA which had more number of targets was the hsa-miR-1207-5p, with 288 targets followed by hsa-miR-665 with 214. From these targets, four were muscle specific genes being three for hsa-miR-1207-5p (CAMK2D, AK1 and SLC25A34), and just one target identified for the hsa-miR-665 (DIDO1). The protein-protein interaction was determined with these four genes finding nine related genes. They formed a specific network composed for subnets like kinase activity, programmed cell death, synaptic transmission, cell projection and genes involved in the activation of NMDA receptor upon glutamate binding and postsynaptic events. The expression analyses were performed for known and novel pigs miRNA across seven muscle developmental periods in which a differential between pre- and postnatal stages was observed. This work suggests that EST analysis is a feasible strategy for identifying ncRNAs as new miRNA candidates with their targets. The findings of miRNAs and their muscle-specific targets in pigs will be helpful for understanding the function and processing of pig small RNAs in the future. Besides, the expression level of the miRNAs analysed across pre- and postnatal stages demonstrate a role on biological events during muscle development and may be worthy of further investigation on their biological role in pigs.
Introduction
MicroRNAs are a class of naturally occurring non-coding RNAs (ncRNA), which are expressed in a wide range of eukaryotic organisms (Bartel et al., 2004). Typically they have ~22 nucleotides (nt) in length that suppress translation of their targets genes by binding to the 3’ untranslated region (Ambros, 2004 and Bartel, 2004). Several laboratories have attempted to identify miRNAs from pig (Huang et al., 2008) and the bioinformatics strategies have proved to be successful for this aim. This approach is based on genome sequences or other databases such as expressed sequence tags (ESTs) and genome survey sequences (GSS) which are nucleotide sequences similar to EST's, with the exception that most of them are genomic in origin, rather than mRNA(Xie et al., 2010 and Zhang et al., 2006). Previous research has used the public available ESTs to search new miRNA genes in pigs using the previously known miRNAs from human and mouse and others mammals non-coding sequences (Zhou & Liu, 2010 and Seeman et al., 2007).
Recent studies have shown that miRNAs play important gene-regulatory roles in numerous eukaryotic lineages and are often highly conserved across animal species. They are involved in many diverse biological processes and may potentially regulate the functions of thousands of genes. The regulation mechanisms can be since a repression of translation to a cleavage of targeted mRNAs. Also, they may directly target transcription factors which affect animal development and specific genes which control metabolism (Carthew, 2006). Identification of comprehensive sets of miRNAs and other small regulatory RNAs in different organisms is a critical step to facilitate our understanding of genome organization, genome biology and evolution (Carrington & Ambros, 2003), as the different stages of muscle development.
Skeletal muscle development is an important physiological process in animal production, and it directly affects meat production. Muscle mass is mainly determined by muscle fiber number and size in animals. In pigs, muscle fibers are formed in two stages during gestation, including primary and secondary fiber formation, being the muscle fiber numbers fixed before birth. Investigation of genes expressed during skeletal muscle development is elementary in understanding molecular mechanism of muscle growth as the identification of miRNAs related with muscle specific genes. In this study we report a computational identification of non-coding sequences in owner EST libraries data base focusing in new pig miRNA with their appropriated secondary structure and further investigated differential expression of miRNAs by quantitative real time PCR during pre- and postnatal stage from skeletal muscle tissue in commercial pigs.
Material and Methods
miRNAs dataset
To search potential miRNAs, a total of 2625 previously known miRNAs from
Homo sapiens (human) and Mus musculus (mouse) were obtained from the miRNA Registry Database (Release 16, September 2010; http:/www.mirbase.org; Griffiths-Jones, 2004). The Sus scrofa (pig) miRNA dataset was provided by Li et al. (2010) and a total of 777 pig miRNA sequences were obtained. All theses sequences were used to construct a mature miRNA reference dataset to predict known and novel miRNA sequences on the available pig EST library. In addition, 510,055 ncRNAs sequences were downloaded from fRNAdb, a comprehensive functional RNA database freely available (http://www.ncrna.org/frnadb/). These sequences were used to predict other RNA classes.
EST dataset
All ESTs used in this study were generated from three different pig breeds
semimembranosus muscle tissue cDNA libraries (Duroc, Large White and a naturalized Brazilian breed, Piau) (Nascimento et al., 2011) being 392, 1312 and 1438 ESTs sequences respectively. Each EST library was assembled in Contigs and Singlets by CAP3 Sequence Assembly Program (http://deepc2.psi.iastate.edu/aat/cap/cap.html) web server, (Huang & Madan, 1999) generating 150, 475 and 602 unique sequences in each dataset, respectively. The parameters used on this step were the default.
Besides, we kept short sequences with less than a hundred nucleotides of length for further analysis; being 145, 349 and 557 short sequences for Duroc, Large White and Piau pig breed respectively. Unique sequences originated by CAP3 program were used for alignment by BlastX program (2.2.18), freely available at (http://blast.ncbi.nlm.nih.gov/Blast.cgi?CMD=Web&PAGE_TYPE=BlastNews#1),
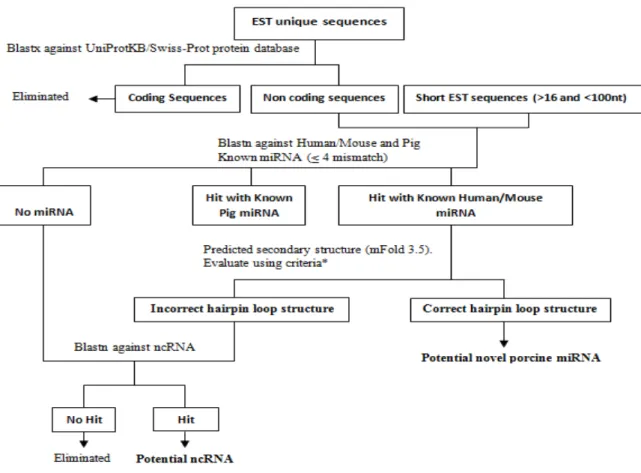
against UniProtKB/Swiss-Prot protein database (http://www.ebi.ac.uk/swissprot/) using an E-value 10 to pick up all no hit sequences. All BlastX no hit and short sequences, totalizing 2278, were recorded as a distinct dataset and used on BlastN searches to predict known and novels miRNA.
Homology searches and secondary structure predictions
Hits among the pig EST sequences and known miRNA with less than four nucleotides of mismatch between them were filtered out.
The sequences which did not have homology with pig miRNA but had with humans and mice were picked up to be mapped into a pig genome. For this, we used the MapMi web server available in http://www.ebi.ac.uk/enright-srv/MapMi/ (Guerra-Assunção & Enright, 2010). Eventually some could not be mapped, and then we carried out a BlastN of EST sequences against the pig genome database (ftp://ftp.ensembl.org/pub/current/fasta/sus_scrofa/dna/) to determinate and confirm their locations into the genome. The BlastN parameters used to map miRNA sequences on pig genome, were: -G 1 -E 2 -W 15 -F "m D" –U and E-value 1e-20, where –G is the cost to open a gap, -E is the cost to extend a gap, -W is the word size and -F “mD” –U was used to mask during the seed generation stage, but with no sequence masked in the match extension stage. EST sequences that matched genomic sequences were selected and the flanking ~60 nucleotides were excised. On this, folding was performed using the program mfold version 3.5 (Markham & Zuker, 2005 and 2008) available at (http://mfold.rna.albany.edu/?q=mfold/RNA-Folding-Form) web server.
Furthermore miRNA precursor sequences were considered a potential miRNA when fitting the following criteria: (1) the predicted mature miRNA had no more than four nucleotide substitutions when aligned with known H. sapiens and M. musculus
mature miRNAs; (2) the RNA sequence can fold into an appropriate stem-loop hairpin secondary structure; (3) a mature miRNA sequence site is present in one arm of the hairpin structure and (4) the predicted secondary structure has a negative minimum free folding energy (MFE; ΔG kcal/mol) and 30–70% Adenine+Uracil content (Zhang et al. 2006). These criteria reduced false positives and required that the predicted miRNAs fit the criteria proposed by Ambros et al., 2003. Besides, we submitted the new miRNA precursor sequences to an ab initio based program called MiPred (Jiang et al. 2007) which identify pre-miRNA-like hairpin sequences classifying them in real or pseudo pre-miRNA. The structures that qualified for the succeeding steps were those which were classified as a real pre-miRNA-like hairpin by MiPred program and fully satisfied the criteria proposed by Zhang et al. (2006).
Figure 1. A schematic diagram of the over-all procedure used to identify and analyze miRNA and others ncRNAs. * modified from Zhang et al (2006), see text for more details.
Phylogenetic analyses
Considering the significance of miRNAs in evolution investigation, the precursor sequences of the predicted pig miRNAs and the known miRNAs in the same family were aligned and phylogenetically analyzed by ClustalW online with defaults parameters to investigate their evolutionary relationships (http://www.clustal.org/). Potential miRNA target prediction
In the present study, new miRNAs targets were predicted using the web-based computational software TargetScan, which is publicly available at http://www.targetscan.org. S. scrofa genes are not included in the current version of TargetScan and the predictions were therefore based on the human mRNA/miRNA interactions. The identified known miRNAs targets were filtered against the TiGER
muscle specific genes database available at http://bioinfo.wilmer.jhu.edu/tiger/db_tissue/muscle-index.html. This particular step