Gene expression profiling of clinical
stages II and III breast cancer
1Disciplina de Oncologia, Departamento de Radiologia,
Faculdade de Medicina, Universidade de São Paulo, São Paulo, SP, Brasil
2Hospital do Câncer A.C. Camargo, São Paulo, SP, Brasil
3Instituto Ludwig de Pesquisa sobre o Câncer, São Paulo, SP, Brasil 4Instituto Brasileiro de Controle do Câncer, São Paulo, SP, Brasil 5Hospital Amaral Carvalho, Jaú, SP, Brasil
M.A.A.K. Folgueira1*,
H. Brentani2*,
M.L.H. Katayama1,
D.F.C. Patrão2, D.M. Carraro2,
M. Mourão Netto2,
E.M. Barbosa4, J.R.F. Caldeira5,
A.P.S. Abreu4, E.C. Lyra4,
J.H.L. Kaiano3, L.D. Mota2,
A.H.J.F.M. Campos2,
M.S. Maciel2, M. Dellamano2,
O.L.S.D. Caballero3
and M.M. Brentani1
Abstract
Clinical stage (CS) is an established indicator of breast cancer out-come. In the present study, a cDNA microarray platform containing 692 genes was used to identify molecular differences between CSII and CSIII disease. Tumor samples were collected from patients with CSII or CSIII breast cancer, and normal breast tissue was collected from women without invasive cancer. Seventy-eight genes were deregulated in CSIII tumors and 22 in CSII tumors when compared to normal tissue, and 20 of them were differentially expressed in both CSII and CSIII tumors. In addition, 58 genes were specifically altered in CSIII and expression of 6 of them was tested by real time RT-PCR in another cohort of patients with CSII or CSIII breast cancer and in women without cancer. Among these genes, MAX, KRT15 and S100A14, but not APOBEC3G or KRT19, were differentially ex-pressed on both CSIII and CSII tumors as compared to normal tissue. Increased HMOX1 levels were detected only in CSIII tumors and may represent a molecular marker of this stage. A clear difference in gene expression pattern occurs at the normal-to-cancer transition; however, most of the differentially expressed genes are deregulated in tumors of both CS (II and III) compared to normal breast tissue.
Correspondence
M.M. Brentani Disciplina de Oncologia Departamento de Radiologia Faculdade de Medicina, USP Av. Dr. Arnaldo, 455, Sala 4112 01246-903 São Paulo, SP Brasil
E-mail: [email protected] Fax: +55-11-3082-6580
Presented in part at the 40th American Society
of Clinical Oncology Annual Meeting, New Orleans, LA, USA, June 5-8, 2004, and at the 29th European Society of Medical Oncology Congress, Vienna, Austria, October 29-November 2, 2004.
Research supported by FAPESP (No. 01/00146-8) and CNPq.
*These authors contributed equally to this study.
Received August 19, 2005 Accepted April 24, 2006
Key words •Breast cancer
•cDNA microarray
•Clinical stage
•Gene expression
Introduction
A current hypothesis of tumorigenesis suggests that cancer cells sequentially ac-quire hallmarks of malignancy, which re-flect genetic alterations that drive the pro-gressive transformation of normal cells into highly malignant derivatives. During breast
sig-nificantly within each subgroup, indicating the heterogeneity of the current tumor stages. USA Surveillance, Epidemiology and End Results (SEER) cancer registries show that 5-year specific breast cancer mortality rates range from 4.7 to 30.2% for clinical stage II (CSII) and from 17.8 to 54.5% for CSIII, suggesting the overlapping nature of these tumors (2).
Recent findings indicate that the poten-tial for distant metastasis and overall sur-vival probability may be attributable to bio-logical characteristics of the primary tumor, reflected by a specific gene expression sig-nature present upon diagnosis (3-11). Hence, new evidence suggests that tumor gene pro-filing might be viewed as a valuable source of additional information supplementing clinical and pathobiological markers.
Biologically relevant genes and biochemi-cal pathways involved in breast tumor de-velopment are not completely understood and their elucidation may allow tailored molecular-based preventive and therapeutic approaches. Thus, in the present study we investigated the gene profile of breast tumor samples obtained from CSII or CSIII pa-tients compared to normal breast tissue.
Patients and Methods
Forty-seven patients were prospectively
studied at three reference centers for cancer treatment in São Paulo State, Brazil: Instituto Brasileiro de Controle do Câncer, São Paulo, Hospital do Câncer A.C. Camargo, São Paulo, and Hospital Amaral Carvalho, Jaú, from Janu-ary 2002 to August 2003. These patients were primarily included in a study to determine the gene expression profile associated with the response to neoadjuvant chemotherapy based on doxorubicin (12). The study was approved by the Ethics Committee of each Institution and written informed consent was obtained from all participants.
Invasive breast cancer was confirmed his-topathologically in samples obtained by core or incisional biopsy. Clinical staging included physical examination with inspection and pal-pation of the skin, mammary gland, and lymph nodes (axillary, supraclavicular and cervical). Imaging studies included a chest X-ray, ab-dominal ultrasound and bone scintillography. According to the classification of the Ameri-can Joint Committee on Cancer (1997), 5 patients were clinically staged as IIA, 2 tients as IIB, 24 patients as IIIA, and 16 pa-tients as IIIB. Patient characteristics according to CS (II versus III) are presented in Table 1. Most of the patients were post-menopausal (>50%). Previous invasive cancer had not been detected in any patient, except in one who had been previously submitted to unilat-eral mastectomy for invasive ductal carcino-ma 37 months before presenting contralateral breast cancer and had already received adju-vant chemotherapy.
Infiltrating ductal carcinoma was diag-nosed in most of the patients (>82%) inde-pendent of clinical stage. Other types of invasive carcinoma detected in CSIII pa-tients were lobular (N = 2), mixed ductal and lobular (N = 1), cribriform (N = 1), medul-lary (N = 1), and apocrine (N = 1). Histologi-cal type was not defined in two patients, one of them clinically staged as II and the other as III. Most tumors were of high histological grade (II or III), with only 16% of CSII patients and 6% of CSIII patients presenting
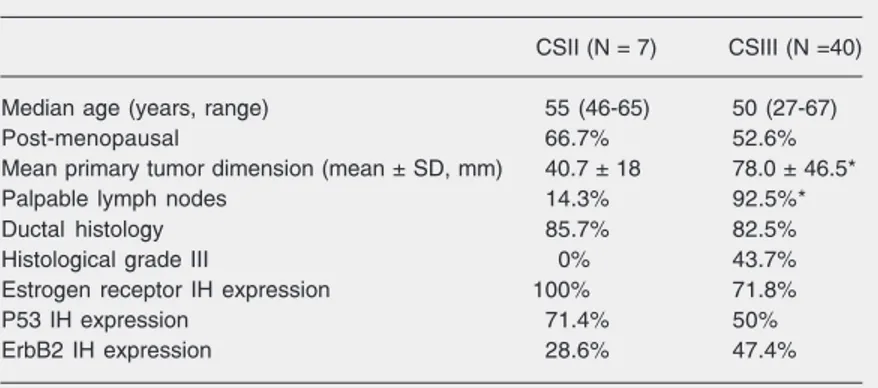
Table 1. Breast cancer patient characteristics.
CSII (N = 7) CSIII (N =40) Median age (years, range) 55 (46-65) 50 (27-67) Post-menopausal 66.7% 52.6% Mean primary tumor dimension (mean ± SD, mm) 40.7 ± 18 78.0 ± 46.5* Palpable lymph nodes 14.3% 92.5%* Ductal histology 85.7% 82.5% Histological grade III 0% 43.7% Estrogen receptor IH expression 100% 71.8% P53 IH expression 71.4% 50% ErbB2 IH expression 28.6% 47.4% CS = clinical stage; IH = immunohistochemistry.
a grade I tumor. There were no differences in immunohistochemical expression of estro-gen receptor, p53 or ErbB2 between CSII and CSIII patients (Table 1).
Nine normal samples were obtained from perilesional mammary tissue from patients submitted to resection of benign lesions or noninvasive carcinoma (5 fibroadenomas and 3 in situ ductal carcinomas). One patient was
operated for a reduction mammoplasty. The median age of the patients without invasive cancer was 42 years (range: 21-73 years).
cDNA microarray assembly, hybridization and analysis
To assemble the cDNA microarray glass slides, literature and SAGE libraries were reviewed in order to select genes expressed in mammary tissue and breast cancer. Some open reading frame-expressed sequence tags (13) identified as being expressed in other cancer types, such as head and neck and stomach, were also added to the slides, some of them corresponding to unknown genes.
Sequences representing 692 genes were then chosen from the Human Cancer Ge-nome Project bank (Fundação de Amparo à Pesquisa do Estado de São Paulo, FAPESP/ Instituto Ludwig de Pesquisa sobre o Câncer), or synthesized by PCR (14). Inserts were amplified by PCR using M13 reverse and forward primers from the cDNA clones. Amplicons purified by gel filtration and clones were printed in three or six replicates onto Corning slides using a Flexys Robot (Genomic Solutions, Ann Arbor, MI, USA). Some genes were represented by two clones corresponding to different regions of the cDNA. cDNA microarray platform and data, complying with MIAME format, have been submitted to the Gene Expression Omnibus data repository under accession numbers GPL 1727 and GSE2048 (www.ncbi.nlm. nih.gov/projects/geo).
Samples obtained from tumor biopsies were hand dissected to eliminate normal
tissue, fibrosis, and adipose tissue and, after microscopic analysis, only samples com-posed of at least 80% malignant cells were further processed. Histologic analysis was performed to select only normal tissue and non-tumor samples were also hand dissected to discard adipose tissue and fibrosis.
Total RNA from frozen specimens was isolated using Trizol reagent (Invitrogen Corporation, Carlsbad, CA, USA) accord-ing to the manufacturer’s protocol. RNA quality was confirmed by agarose gel elec-trophoresis after visualization with ethidium bromide. Only RNA samples with a >1 ratio for 28S/18S ribosomal RNA were further processed. A two-round RNA amplification procedure was carried out by combining antisense RNA amplification with a tem-plate-switching effect according to a previ-ously described protocol (15). At the start, 3 µg total RNA was used to yield about 60 µg amplified RNA. Three to 5 µg amplified RNA were then used in a reverse transcrip-tase reaction in the presence of Cy3- or Cy5-labeled dCTP (GE Healthcare Life Sciences, Little Chalfont, St. Giles, UK) and Super-Script II (Invitrogen-Life Technology, Carls-bad, CA, USA). The HB4A normal epitheli-al mammary cell line, kindly donated by Drs. Mike O’Hare and Alan Mackay (Ludwig Institute for Cancer Research, University College of London, London, UK) (16), was used as reference for the hybridizations. These cells were processed in the same man-ner as the breast tissue samples.
A mixture of equal amounts of breast tumor samples and HB4A cDNA labeled probes was hybridized on cDNA microarray slides. Dye swap was performed for each sample analyzed to control for dye bias. Pre-hybridization was carried out in a humidi-fied chamber at 42oC for 16-20 h and hybrid-ization at 65oC in a GeneTac Hybridization Station (Genomic Solutions).
iden-tical photomultiplier voltage for all slides and data were recovered with the Quantarray software (Perkin Elmer) using histogram methods. After image acquisition and quan-tification, saturated spots (signal intensity higher than 63,000) as well as unreliable low-intensity spots, defined as those within the 95% percentile of intensity distribution of known empty spots, were removed from the analysis. Replica (3-6 times) spots repre-senting the same gene were identified, aver-age signal intensity was determined and spots with low reproducibility between technical replicates (mean plus 2 SD cut-off) were excluded, and the average signal was then once again evaluated without these spot val-ues. Transcripts missing in at least two ar-rays were also eliminated from analysis. Quantified signals were submitted to log transformation and to Lowess normaliza-tion.
The permuted Student t-test (10,000
per-mutations) was used to determine the level of significance of the difference in expres-sion of each individual gene and false dis-covery ratio (FDR) was employed as a test for multiple analysis correction. Genes were considered to be differentially expressed if they satisfied an FDR level of 0.05. Hierar-chical clustering analysis based on Euclid-ean distance and complete linkage was per-formed using the genes differentially ex-pressed. Reliability of the clustering was assessed by the bootstrap technique using TMEV software (17).
Meta-analyses of our results along with those of public data (4,9,10) found in the Oncomine website http://141.214.6.50/ oncomine/main/index.jsp were performed following a previously described procedure (18). Briefly, gene libraries were down-loaded, data format was standardized, and common gene sets were determined. Dupli-cate gene entries were reduced to one by evaluating the mean expression in the same sample. Next, individual analysis of each data set was performed by evaluating the
level of significance of the difference (P value, Student t-test) of each gene, as done
in our own study. A proper meta-analysis was then carried out by determining a sum-mary statistics for each gene (which ac-counts for all P values in all studies) and 100,000 random permutated summary sta-tistics by randomly choosing P values from a study. The summary P value for each gene is the fraction of random permutated summary statistics, which are equal to or lower than the “real” summary statistic.
Real-time quantitative reverse
transcription-polymerase chain reaction
Two micrograms of total RNA was re-verse-transcribedusing the oligo(dT) primer and Superscript II (Invitrogen). Real-time RT-PCR was performed using SYBR-green I (Sigma, St. Louis, MO, USA) in a Light-Cycler™ system (Roche Diagnostics, Mann-heim, Germany) or a Rotor-gene system (Corbett Research, Mortlake, Australia), or alternatively using Taqman chemistry and an ABI Prism 7700 sequencedetection sys-tem (Applied Biosyssys-tems, Foster City, CA, USA).
60ºC for 30 s, and extension at 72ºC for 30 s. HB4A cells were used as reference.
For the Taqman assay, primers and probes were synthetized by the custom TaqMan® Gene Expression Assays service (Applied Biosystems) (Table 2). Two microliters of the diluted c-DNA was amplified in a final volume of 25 µL with 1X Mix Assays-by-Design™ (Applied Biosystems). Thermal cycling consisted of 2 min at 95ºC, 40 cycles at 95ºC for 15 s, and 60ºC for 1 min. Normal human mammary glands (RNA from 2 Cau-casian women 26 and 27 years old) (BD Biosciences Clontech, Palo Alto, CA, USA) were used as reference.
Experiments were performed in dupli-cate and relative expression of the genes of interest was normalizedto that of ß-actin (ACTB). Geneexpression in each sample was then compared with expression in nor-mal human mammary glands or HB4A cells, as indicated. The comparative CT method (∆∆CT)was used for quantification of gene expression and relative expression was cal-culated as 2-∆∆CT
(19). The relationship be-tween gene expression of samples analyzed by both cDNA microarray and quantitative RT-PCR was determined by Pearson corre-lation. At least 19 samples were analyzed and variables were significantly correlated if
a critical value for Pearson r ≥ 0.456 and P ≤ 0.05 (two-tailed) were both attained.
Gene expression from samples of a sec-ond cohort of patients evaluated only by quantitative RT-PCR was analyzed by the Kruskal-Wallis test and found to be statisti-cally different if they satisfied a two-tailed level of significance ≤0.05. The Mann-Whit-ney U-test was subsequently used to detect differences between groups.
Results
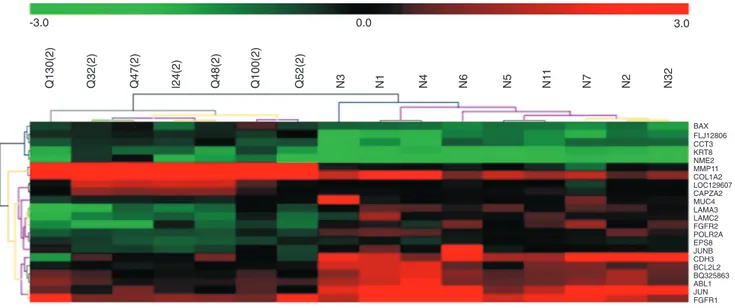
Twenty-two genes were differentially expressed by CSII tumors and normal breast tissue, representing approximately 3.2% of the genes analyzed, and unsupervised hier-archical clustering permitted the proper dis-crimination of normal and tumor samples (Figure 1).
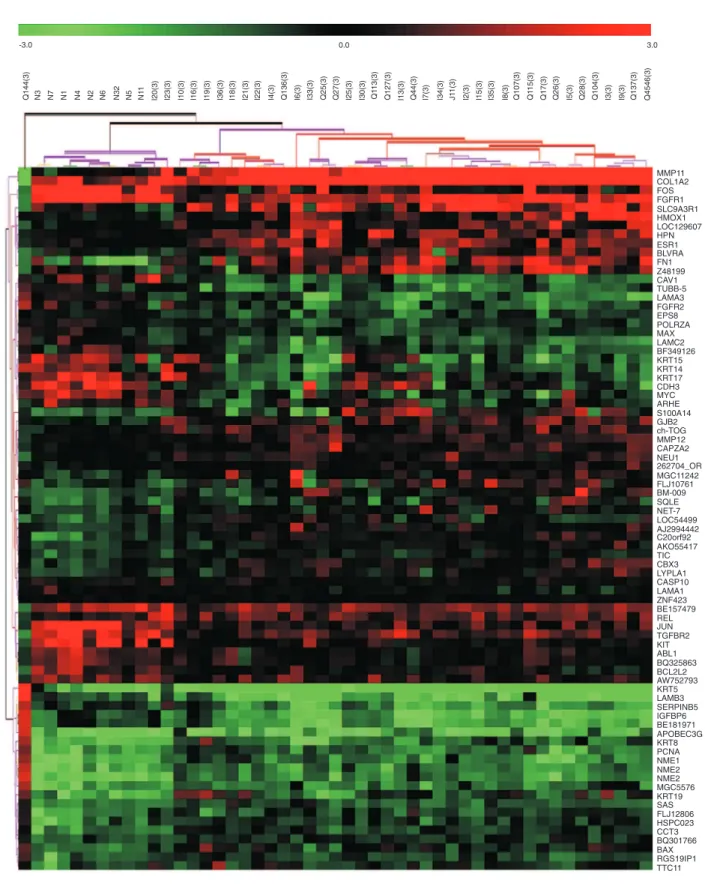
When CSIII tumors were compared to normal breast tissue, 78 differentially ex-pressed genes were identified (11.4% of the genes) which could correctly cluster 100% of the normal samples as well as 92.5% of the tumor samples (Figure 2). Three of 40 tumors seemed to cluster inappropriately, two of them grouping with the normal ones: I20, obtained from a 48-year-old patient with a T3N1M0 ductal carcinoma, histological
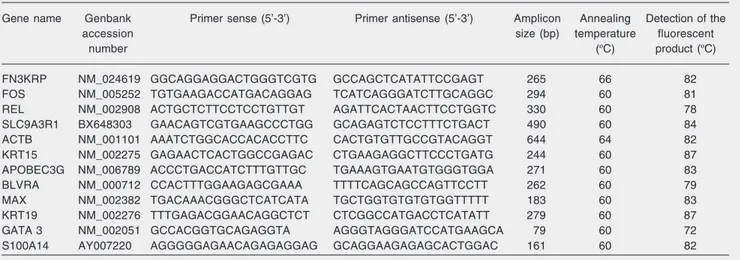
Table 2. Sequences of primers and probes and conditions of quantitative PCR.
Gene name Genbank Primer sense (5’-3’) Primer antisense (5’-3’) Amplicon Annealing Detection of the accession size (bp) temperature fluorescent
number (ºC) product (ºC)
Figure 1. Unsupervised hierarchical clustering of 7 clinical stage II breast cancer samples and 9 normal breast samples (N) based on 22 differentially expressed genes at a false discovery ratio level of 0.05. Tumor identification (beginning with I, Q) appears at the top of the figure and each column represents gene expression of a single tumor. UniGene cluster ID or gene ID or ORESTES is shown in each row. The upper colored bar indicates the variation in gene expression in target samples as compared to reference cells (HB4A), i.e., red, more expressed and green, less expressed in target samples. The colored lines of the dendrogram stand for the support for each clustering, black and gray meaning more reliable and yellow and red less reliable. The metric used was Euclidean distance, with complete linkage for distance between clusters.
grade 2, ER positive (80% of the cells), PR positive, ErbB2 negative, and P53 negative, and I23, obtained from a 63-year-old patient with a T3N2M0 invasive cribriform carci-noma. After mastectomy, the tumor of the latter patient was found to be a histological grade 3 invasive ductal carcinoma negative for ER, PR, ErbB2, and p53 expression as determined by immunohistochemistry stain-ing. Another sample (Q144) from a woman with an apocrine estrogen receptor-negative CSIII carcinoma presented a peculiar gene expression that prevented its correct cluster-ing among the other tumors.
Among the 78 genes differentially ex-pressed in CSIII tumors as compared to nor-mal breast tissue, 20 were also deregulated in CSII tumors in relation to normal tissue (Table 3). Therefore, two of 22 genes, JUNB and MUC4, were under-expressed only in CSII tumors compared to normal tissue. In addition, 58 genes were exclusively deregu-lated in CSIII tumor samples in relation to normal breast (but not in the CSII tumor and
normal tissue comparison; Table 4). The reliability of the cDNA microarray analysis was evaluated by quantitative RT-PCR for 5 selected genes (FOS, REL, SLC9A3R1, GATA 3, FN3KRP), and 21 breast tumor samples were re-analyzed. The first 3 genes were considered to be differen-tially expressed in CSIII tumors (Table 4) on the basis of the criteria described in methods for cDNA microarrays analysis. Although this cDNA microarray platform also con-tained spotted clones of FN3KRP and GATA 3, these genes were not found to be differen-tially expressed in the tumor/normal tissue comparison. The correlation between the two assays was significantly positive for 60% of the genes, FOS, GATA 3, and SLC9A3R1 (Table 5), indicating that RT-PCR data agreed with the cDNA microarray data.
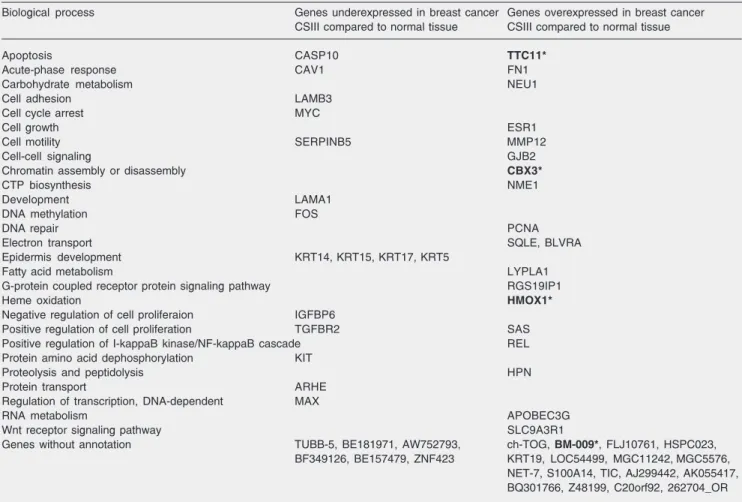
Table 4. Genes differentially expressed in clinical stage III (CSIII) tumors and in normal tissue according to their Gene Ontology annotation (biological process).
Biological process Genes underexpressed in breast cancer Genes overexpressed in breast cancer CSIII compared to normal tissue CSIII compared to normal tissue
Apoptosis CASP10 TTC11*
Acute-phase response CAV1 FN1 Carbohydrate metabolism NEU1 Cell adhesion LAMB3
Cell cycle arrest MYC
Cell growth ESR1
Cell motility SERPINB5 MMP12
Cell-cell signaling GJB2
Chromatin assembly or disassembly CBX3*
CTP biosynthesis NME1
Development LAMA1 DNA methylation FOS
DNA repair PCNA
Electron transport SQLE, BLVRA Epidermis development KRT14, KRT15, KRT17, KRT5
Fatty acid metabolism LYPLA1 G-protein coupled receptor protein signaling pathway RGS19IP1
Heme oxidation HMOX1*
Negative regulation of cell proliferaion IGFBP6
Positive regulation of cell proliferation TGFBR2 SAS Positive regulation of I-kappaB kinase/NF-kappaB cascade REL Protein amino acid dephosphorylation KIT
Proteolysis and peptidolysis HPN Protein transport ARHE
Regulation of transcription, DNA-dependent MAX
RNA metabolism APOBEC3G
Wnt receptor signaling pathway SLC9A3R1
Genes without annotation TUBB-5, BE181971, AW752793, ch-TOG, BM-009*, FLJ10761, HSPC023, BF349126, BE157479, ZNF423 KRT19, LOC54499, MGC11242, MGC5576,
NET-7, S100A14, TIC, AJ299442, AK055417, BQ301766, Z48199, C20orf92, 262704_OR Genes exclusively differentially expressed in CSIII tumors and in normal tissue at a false discovery ratio level of 0.05. Genes printed in bold type and with an asterisk were also found to be differentially expressed in tumor and normal tissue in the meta-analysis.
Table 3. Genes commonly differentially expressed in CSII and CSIII tumors compared to normal breast tissue according to their Gene Ontology annotation (biological process).
Biological process Genes underexpressed in tumors Genes overexpressed in tumors compared to normal tissue compared to normal tissue Cell growth and/or maintenance JUN*
Cell proliferation EPS8 Regulation of cell cycle ABL1* Regulation of cell proliferation FGFR1 Salivary gland morphogenesis FGFR2 Regulation of apoptosis BCL2L2
Induction of apoptosis BAX Cytoskeleton organization and biogenesis CCT3 Cell adhesion LAMC2
Transport LAMA3*
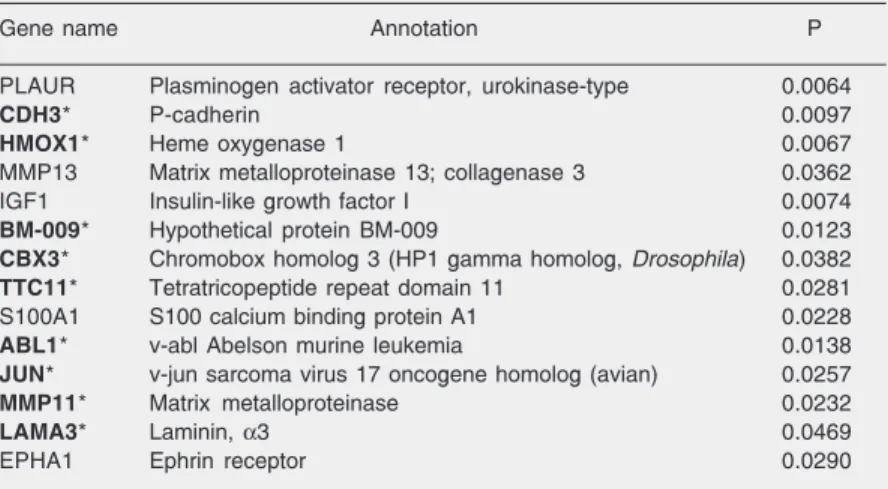
Table 6. Fourteen genes differentially expressed in breast cancer and in normal tissue as determined by a meta-analysis.
Gene name Annotation P PLAUR Plasminogen activator receptor, urokinase-type 0.0064
CDH3* P-cadherin 0.0097
HMOX1* Heme oxygenase 1 0.0067
MMP13 Matrix metalloproteinase 13; collagenase 3 0.0362 IGF1 Insulin-like growth factor I 0.0074
BM-009* Hypothetical protein BM-009 0.0123
CBX3* Chromobox homolog 3 (HP1 gamma homolog, Drosophila) 0.0382
TTC11* Tetratricopeptide repeat domain 11 0.0281 S100A1 S100 calcium binding protein A1 0.0228
ABL1* v-abl Abelson murine leukemia 0.0138
JUN* v-jun sarcoma virus 17 oncogene homolog (avian) 0.0257
MMP11* Matrix metalloproteinase 0.0232
LAMA3* Laminin, α3 0.0469
EPHA1 Ephrin receptor 0.0290 Meta-analysis of public data (4,9,10) and of our own data. Genes printed in bold type and with an asterisk were differentially expressed in tumor and normal tissue in our analysis.
markers of this clinical stage or were also deregulated in CSII tumors, we analyzed their expression by quantitative RT-PCR in an independent cohort of patients.
Tumor samples from 31 patients clinically staged as CSII breast cancer and 22 patients staged as CSIII, median age 51 and 52 years, respectively, were then analyzed. Tumors were mainly invasive ductal carcinomas (90 and 81% of CSII and CSIII patients, respectively). Normal breast tissue obtained from another group of 18 women without cancer was used for comparison. The median age of these women was 37 years and they had their breasts operated for benign conditions, mainly fibroad-enomas or fibrocystic conditions (83.3%).
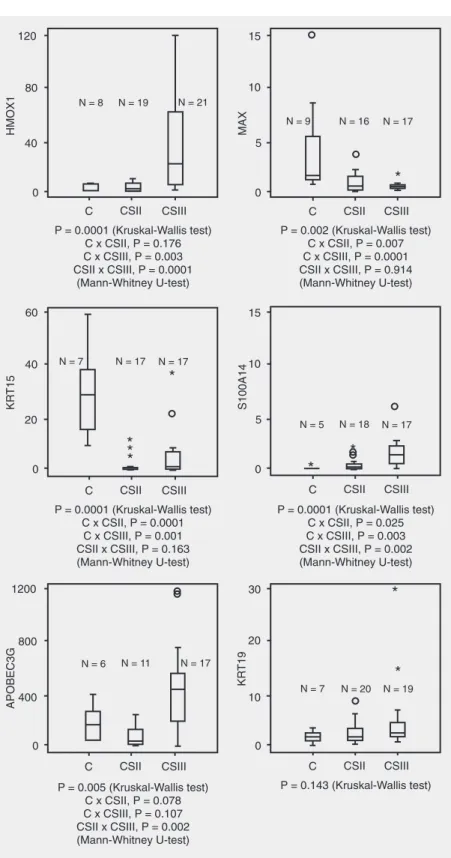
Confirming our cDNA microarray re-sults, 4 genes, MAX, HMOX1, KRT15, and S100A14, were differentially expressed, and another, APOBEC3G, showed a trend to-wards a differential expression between CSIII tumors and normal breast tissue, as analyzed by real-time RT-PCR (Figure 3). KRT19 expression, however, was similar in normal samples and CSIII tumors. On the other hand, MAX, KRT15 and S100A14 were also differentially expressed in CSII tumors and normal breast tissue. Therefore, among the 6 genes analyzed by real-time RT-PCR, only increased levels of HMOX1 may be a molecular marker of CSIII breast cancer.
We also performed a meta-analysis of the genes differentially expressed in breast tumors versus normal tissue, identified in some other published microarray reports (4,9,10) including our own data. Among the 692 genes represented on our cDNA micro-array slides, 198 elements overlapped the elements of the large scale array platforms used by these other three groups. In the meta-analysis, 14 genes (Table 6) were dif-ferentially expressed in breast tumors and in normal tissue (summary P value <0.05), 9 of which were also found to be differentially expressed in tumors analyzed by us, indicat-ing the sensitivity of the present cDNA mi-croarray approach.
Discussion
To evaluate whether gene profile could characterize a particular clinical stage, tran-scripts from CSII and CSIII breast cancer samples were compared. The pattern of ex-pression of 22 genes in CSII tumors and 78 genes in CSIII tumors best distinguished them from normal breast tissue. However, most of the genes differentially expressed by
Table 5. Correlation between gene expression evaluated by cDNA microarray and quantitative RT-PCR.
Pearson correlation
r P
FN3KRP 0.414 0.062 FOS 0.927 <0.001* GATA 3 0.614 0.005* REL -0.149 0.52 SLC9A3R1 0.726 <0.001* Expression of 5 genes from 19-21 samples was analyzed by both cDNA microarray and quantita-tive RT-PCR.
Figure 3. Gene expression in clinical stage II and III tumors and in normal breast tissue. Tumor specimens from patients with clinical stage II or III breast cancer, as well normal breast tissue from women without can-cer, were analyzed by quantitative RT-PCR. The com-parative CT method (∆∆CT)was used for quantification
of gene expression and relative expression was calcu-lated as 2-∆∆CT. Relative expression of genes of
inter-est was normalizedto that of ß-actin and gene sion in each sample was then compared with expres-sionin HB4A cells. Values are shown on the y-axis. The box plot displays the distribution of all values be-tween bars (25th, 50th and 75th percentiles in the box), except outliers (º1.5-3.0 box lengths from the 75th per-centile) and extreme values (*values more than 3 box lengths from the 75th percentile). The Kruskal-Wallis test followed by the Mann-Whitney U-test (if a differ-ence was found) was employed and a two-tailed P ≤
CSII tumors (20/22) could not be considered specific markers of this stage since they were also found to be deregulated in the CSIII tumor/normal tissue comparison.
In general, tumor cells progressively lose the expression of genes involved in cell ad-hesion and in the maintenance of myoepi-thelial cell layers, such as several laminin chains and P-cadherin (CDH3), a specific myoepithelial marker (20,21). Other mark-ers of myoepithelial cells, such as Serpin B5, a protease inhibitor, and caveolin-1, were down-regulated in CSIII tumors, suggesting a reduced proportion of these normal cells within tumors upon stage progression (22). Accordingly, a lower expression of a group of basal cytokeratins, generally expressed by myoepithelial cells (KRT5, 14, 15, 17), was observed in these advanced tumors. On the other hand, another keratin typical of luminal cells such as KRT8, but not KRT19, was over-expressed in tumors as compared to normal tissue. KRT19 (23) is expressed by both normal mammary glands and breast adenocarcinomas, and even though our cDNA microarray data showed a higher ex-pression in CSIII tumors as compared to normal tissue, these values were greatly vari-able, and such results were not later con-firmed by quantitative RT-PCR in another cohort of CSIII patients.
We also detected a reduced proliferation signature in tumors. Some growth factors and receptors, such as fibroblast growth fac-tor recepfac-tors or substrates (FGFR1, FGFR2, ABL1, EPS8) and early transcription genes with transcription factor activity (JUN, JUNB, FOS, MYC, MAX), were down-regu-lated in malignant disease compared to nor-mal breast tissue. In contrast, other genes affecting proliferation emerged as being more expressed in the CSIII tumor profile, such as REL and proliferating cell nuclear antigen, as opposed to TGFß receptor 2, which was less expressed in CSIII tumors than in nor-mal tissue, and may inhibit epithelial cell proliferation.
Genes linked to cytoskeleton regulation and signal transduction through lipids were up-modulated in tumors, such as CAPZA2, a member of the F-actin capping protein α subunit family, thought to modulate second messenger generation through the phospho-inositide cycle and ultimately controlling cell survival and cell cycle, members of the tetraspanin superfamily (sarcoma amplified sequence) which can be associated with phos-phatidylinositol kinase, as well as CCT3, a molecular chaperone involved in actin and tubulin folding, previously reported to be up-regulated in ovarian carcinoma (24-26). In addition, lysophospholipase 1, which hy-drolyzes lysophosphatidylcholine, as well as the Na+/H+ exchanger regulatory factor (SLC9A3R1), which induces cytoskeleton reorganization, were preferentially overex-pressed in CSIII tumors (27).
Enhanced tumor expression of genes characteristically expressed by stromal cells, such as collagen 1α2, metalloproteases 11, 12, hepsin (a trypsin-like protease) and fi-bronectin 1, may be derived from non-epi-thelial components of the tumors, as previ-ously suggested (28).
Several other genes were more expressed in CSIII tumors than in normal tissue, in-cluding ch-TOG (29), coding for a protein which could potentially lead to chromosome segregation defects, APOBEC3G (30), that can act as a DNA mutator, and CBX3, CROMOBOX homolog 3, linked to tran-scriptionally repressed heterochromatin structure (31).
pro-angiogenic effects in human pancreatic can-cer (34), as well as a BCR-ABL-dependent survival factor in chronic myeloid leukemia (35). In addition, inhibition of HMOX1 ex-pression may sensitize pancreatic cancer cells to chemotherapy (36). In contrast, in breast cancer cell lines and animal models of breast cancer, HMOX1 induction inhibits cell pro-liferation (37). Although HMOX1 expres-sion in cancers is still not well defined, our results suggest that its overexpression oc-curs in more advanced stages of breast can-cer. In addition, an increased biliverdin re-ductase A expression in tumors indicates that malignant cells may acquire a protective response to cellular stress.
A clear difference in gene expression pattern occurs at the normal to cancer transi-tion; however, most of the differentially ex-pressed genes are deregulated in tumors of both clinical stages (II and III) compared to
normal breast tissue. Differential expression of 4 of 6 genes found to be differentially expressed by cDNA microarray analysis in the CSIII tumor versus normal tissue com-parison was validated by quantitative RT-PCR in another cohort of CSIII patients, but only one of them, HMOX1, was identified as differentially expressed in CSIII tumors ex-clusively by both assays. Although the gene expression profile suggests the overlapping nature of CSII and CSIII breast cancer, it seems that about 15% of genes may be char-acteristically modulated in the latter specific clinical stage.
Acknowledgments
The authors wish to thank Mrs. Maria José Gonçalves Benevides for excellent sec-retarial help and Mrs. Cristina Piñero Grandal for figure edition.
References
1. Fisher B, Osborne CK, Margolese AG, Bloomer W. Neoplams of the breast. In: Holland IF, Frei E, Bast RC, Kufe DW, Morton DL, Weichselbaum RR (Editors), Cancer medicine. Philadelphia: Lea & Febiger; 1997. p 2349-2429.
2. Hellman S, Harris JR. Natural history of breast cancer. In: Harris JR, Lippman ME, Morrow M, Osborne CK (Editors), Diseases of the breast. Philadelphia: Lippincott Williams & Wilkins; 2000.
3. Martin KJ, Kritzman BM, Price LM, Koh B, Kwan CP, Zhang X, et al. Linking gene expression patterns to therapeutic groups in breast cancer. Cancer Res 2000; 60: 2232-2238.
4. Sorlie T, Perou CM, Tibshirani R, Aas T, Geisler S, Johnsen H, et al. Gene expression patterns of breast carcinomas distinguish tumor subclasses with clinical implications. Proc Natl Acad Sci U S A
2001; 98: 10869-10874.
5. West M, Blanchette C, Dressman H, Huang E, Ishida S, Spang R, et al. Predicting the clinical status of human breast cancer by using gene expression profiles. Proc Natl Acad Sci U S A 2001; 98: 11462-11467.
6. van’t Veer LJ, Dai H, van de Vijver MJ, He YD, Hart AA, Mao M, et al. Gene expression profiling predicts clinical outcome of breast can-cer. Nature 2002; 415: 530-536.
7. van de Vijver MJ, He YD, van’t Veer LJ, Dai H, Hart AA, Voskuil DW, et al. A gene-expression signature as a predictor of survival in breast cancer. N Engl J Med 2002; 347: 1999-2009.
8. Ma XJ, Salunga R, Tuggle JT, Gaudet J, Enright E, McQuary P, et al. Gene expression profiles of human breast cancer progression.
Proc Natl Acad Sci U S A 2003; 100: 5974-5979.
9. Sotiriou C, Neo SY, McShane LM, Korn EL, Long PM, Jazaeri A, et
al. Breast cancer classification and prognosis based on gene ex-pression profiles from a population-based study. Proc Natl Acad Sci U S A 2003; 100: 10393-10398.
10. Ramaswamy S, Tamayo P, Rifkin R, Mukherjee S, Yeang CH, Angelo M, et al. Multiclass cancer diagnosis using tumor gene expression signatures. Proc Natl Acad Sci U S A 2001; 98: 15149-15154.
11. Wang Y, Klijn JG, Zhang Y, Sieuwerts AM, Look MP, Yang F, et al. Gene-expression profiles to predict distant metastasis of lymph-node-negative primary breast cancer. Lancet 2005; 365: 671-679. 12. Folgueira MA, Carraro DM, Brentani H, Patrao DF, Barbosa EM,
Netto MM, et al. Gene expression profile associated with response to doxorubicin-based therapy in breast cancer. Clin Cancer Res
2005; 11: 7434-7443.
13. Dias Neto E, Correa RG, Verjovski-Almeida S, Briones MR, Nagai MA, da Silva W Jr, et al. Shotgun sequencing of the human tran-scriptome with ORF expressed sequence tags. Proc Natl Acad Sci U S A 2000; 97: 3491-3496.
14. Brentani H, Caballero OL, Camargo AA, da Silva AM, da Silva W Jr, Dias Neto E, et al. The generation and utilization of a cancer-oriented representation of the human transcriptome by using ex-pressed sequence tags. Proc Natl Acad Sci U S A 2003; 100: 13418-13423.
15. Wang E, Miller LD, Ohnmacht GA, Liu ET, Marincola FM. High-fidelity mRNA amplification for gene profiling. Nat Biotechnol 2000; 18: 457-459.
myoepithelial breast cells: identification of novel prognostic markers for breast cancer. Cancer Res 2004; 64: 3037-3045.
17. Saeed AI, Sharov V, White J, Li J, Liang W, Bhagabati N, et al. TM4: a free, open-source system for microarray data management and analysis. Biotechniques 2003; 34: 374-378.
18. Rhodes DR, Barrette TR, Rubin MA, Ghosh D, Chinnaiyan AM. Meta-analysis of microarrays: interstudy validation of gene expres-sion profiles reveals pathway dysregulation in prostate cancer. Can-cer Res 2002; 62: 4427-4433.
19. Livak KJ, Schmittgen TD. Analysis of relative gene expression data using real-time quantitative PCR and the 2(-Delta Delta C(T)) Method. Methods 2001; 25: 402-408.
20. Ioachim E, Charchanti A, Briasoulis E, Karavasilis V, Tsanou H, Arvanitis DL, et al. Immunohistochemical expression of extracellular matrix components tenascin, fibronectin, collagen type IV and lami-nin in breast cancer: their prognostic value and role in tumour invasion and progression. Eur J Cancer 2002; 38: 2362-2370. 21. Palacios J, Benito N, Pizarro A, Suarez A, Espada J, Cano A, et al.
Anomalous expression of P-cadherin in breast carcinoma. Correla-tion with E-cadherin expression and pathological features. Am J Pathol 1995; 146: 605-612.
22. Petersen OW, Lind NH, Gudjonsson T, Villadsen R, Ronnov-Jessen L, Bissell MJ. The plasticity of human breast carcinoma cells is more than epithelial to mesenchymal conversion. Breast Cancer Res
2001; 3: 213-217.
23. Chu PG, Weiss LM. Keratin expression in human tissues and neo-plasms. Histopathology 2002; 40: 403-439.
24. Sun HQ, Kwiatkowska K, Wooten DC, Yin HL. Effects of CapG overexpression on agonist-induced motility and second messenger generation. J Cell Biol 1995; 129: 147-156.
25. Berditchevski F. Complexes of tetraspanins with integrins: more than meets the eye. J Cell Sci 2001; 114: 4143-4151.
26. Peters DG, Kudla DM, Deloia JA, Chu TJ, Fairfull L, Edwards RP, et al. Comparative gene expression analysis of ovarian carcinoma and normal ovarian epithelium by serial analysis of gene expression.
Cancer Epidemiol Biomarkers Prev 2005; 14: 1717-1723. 27. Paradiso A, Cardone RA, Bellizzi A, Bagorda A, Guerra L,
Tomma-sino M, et al. The Na+-H+ exchanger-1 induces cytoskeletal changes
involving reciprocal RhoA and Rac1 signaling, resulting in motility and invasion in MDA-MB-435 cells. Breast Cancer Res 2004; 6: R616-R628.
28. Ramaswamy S, Ross KN, Lander ES, Golub TR. A molecular signa-ture of metastasis in primary solid tumors. Nat Genet 2003; 33: 49-54.
29. Gergely F, Draviam VM, Raff JW. The ch-TOG/XMAP215 protein is essential for spindle pole organization in human somatic cells.
Genes Dev 2003; 17: 336-341.
30. Schumacher AJ, Nissley DV, Harris RS. APOBEC3G hypermutates genomic DNA and inhibits Ty1 retrotransposition in yeast. Proc Natl Acad Sci U S A 2005; 102: 9854-9859.
31. Eissenberg JC, Elgin SC. The HP1 protein family: getting a grip on chromatin. Curr Opin Genet Dev 2000; 10: 204-210.
32. Fang J, Sawa T, Akaike T, Akuta T, Sahoo SK, Khaled G, et al. In vivo antitumor activity of pegylated zinc protoporphyrin: targeted inhibition of heme oxygenase in solid tumor. Cancer Res 2003; 63: 3567-3574.
33. Liu N, Bi F, Pan Y, Sun L, Xue Y, Shi Y, et al. Reversal of the malignant phenotype of gastric cancer cells by inhibition of RhoA expression and activity. Clin Cancer Res 2004; 10: 6239-6247. 34. Sunamura M, Duda DG, Ghattas MH, Lozonschi L, Motoi F,
Yamauchi J, et al. Heme oxygenase-1 accelerates tumor angiogen-esis of human pancreatic cancer. Angiogenesis 2003; 6: 15-24. 35. Mayerhofer M, Florian S, Krauth MT, Aichberger KJ, Bilban M,
Marculescu R, et al. Identification of heme oxygenase-1 as a novel BCR/ABL-dependent survival factor in chronic myeloid leukemia.
Cancer Res 2004; 64: 3148-3154.
36. Berberat PO, Dambrauskas Z, Gulbinas A, Giese T, Giese N, Kunzli B, et al. Inhibition of heme oxygenase-1 increases responsiveness of pancreatic cancer cells to anticancer treatment. Clin Cancer Res
2005; 11: 3790-3798.
37. Hill M, Pereira V, Chauveau C, Zagani R, Remy S, Tesson L, et al. Heme oxygenase-1 inhibits rat and human breast cancer cell prolif-eration: mutual cross inhibition with indoleamine 2,3-dioxygenase.