Journal of Engineering Science and Technology Review 7 (2) (2014) 158– 168
Research Article
A “value for money” framework to study product competitiveness in the automotive
market
C. lo Storto
Dept. of Industrial Engineering, University of Naples Federico II, Piazzale V. Tecchio n. 80, 80125 Naples, Italy
Received 20 November 2013; Accepted 10 July 2014
___________________________________________________________________________________________
Abstract
Assessing the value for money of a product is of paramount importance to get useful strategic information relative to market and technological trends and major determinants of technological innovation, and to conduct benchmarking studies and make comparison among competitive products. This paper note presents a methodological “value for money” framework to assess the market competitiveness of a passenger car. This framework uses both published data and industry expert judgements. In this framework, the value for money of a car is assumed to be dependent on the economic cost (i.e., price and fuel consumption) that the consumer has to bear when using it, and on the car technical value (PTV) which is built as a function of certain measurable features of the product. The framework is adopted to analyse a sample of 216 cars that were sold in the Italian domestic market between the 70s and the early 90s. The relationship between the car technical value, price, and fuel consumption is investigated using a translog regression equation.
Keywords:value for money, benchmarking, product technical value, automotive industry, translog regression
__________________________________________________________________________________________
1. Introduction
In developed countries, the automotive industry has always been a primary industry for the economic development. As market demand for passenger cars in western countries is stagnating or even declining and the automotive industry is undergoing a major structural change - due to continuous cost pressures created by legislative and competitive concerns, and increasing risk of economic and financial failure - the automotive companies have to focus their innovative efforts on a limited number of product development projects. Thus, a careful analysis of product performance and the impact of innovation efforts on product performance - in particular, compared to the competitors product - is unavoidable in the automotive OEMs strategic planning. Both the OEMs and their suppliers need to screen and select from their portfolio more promising innovations that meet the customer expectations and increase their perceived value for money.
Scholars have used several conceptualisation to describe the nature of products, depending on the perspective and aim of the analysis to pursue: product as a psychosocial symbol [1], product as a set of features [2], product as a set of causal concepts [3], product as offering [4], product as a satisfaction generating system [5], product as experience [6], product as technology [7], product as a set of physical actions and objects [8]. These conceptualisations of a product are complementary and none of them is dominating the others. However, the perspective to consider products as technological systems capable to deliver functions to the users could be very useful to technical managers to get a number of insights about how to make sound technical
decisions and plans when designing a new product or improving old products and, particularly, assessing the product value for money (VfM), i.e. the utility the consumers receive from every sum of money spent when they purchase and use a car. That means that the value for money of a product is based not only on the minimum purchasing price the consumers have to pay, but also on the maximum effectiveness they perceive when they buy that product.
Furthermore, this perspective may support the practice of product or technical benchmarking in a company. Product benchmarking is a valuable tool for companies that want to improve their product innovation performance, as it allows managers to judge in a highly objective and informed manner the competitiveness of their company products in comparison to products sold in the market by their competitors using benchmarking performance and product metrics to uncover effective performance drivers and improvement opportunities. The implementation of product benchmarking practices is now a well developed practice in certain industries, i.e. passenger cars, household appliances, ICT devices, etc. to design products that effectively match customers expectations, by adopting the best technological solutions available worldwide, but – at the same time – keeping costs and, consequently prices, at the minimum level [9] [10].
In this paper, by conceptualising a product as a set of technological characteristics that deliver measurable functions to the user, a methodological “value for money” (VfM) framework to analyse product competitiveness in the automotive market is presented. In this framework, a car model VfM is assumed to be dependent on its technical value (PTV) delivered to the consumers and which is built as a function of certain measurable features of the product, and the economical costs (i.e., price and fuel consumption) they have to bear when using that car.
J
estr
JOURNAL OF Engineering Science andTechnology Review
www.jestr.org
______________
* E-mail address:corrado.lostorto@unina.it
159
The VfM framework can be adopted, for instance, to compare car models in terms of their technical value in a multi-dimension features space, explore technological trends in the automotive industry and identify radical or incremental innovation trajectories, to develop scenario plans to select efficient innovation strategies, to implement technology roadmapping, and study the market structure, and identify the emergence of new product market niches [11] [12] [13] [14] [15]. Here, the framework is implemented to assess the technical value of a sample of 216 passenger car models that were sold in the Italian domestic market from the 70s to the 90s, and investigate the relationship among a car technical value and its price and fuel consumption.
The paper is structured as follows. Following this short introduction, in section 2 the value for money framework is presented; section 3 implements the framework in the Italian domestic car market, describing variables used to assess a car value for money and their measurement, and finally the translog Cobb-Douglas production function used to study the relationship between a car model technical value, and its purchasing price and fuel consumption is presented. Results relative to the implementation of the VfM framework in the Italian market are presented in section 4.
2. The “value for money” framework
The value for money framework measures the technical value of a car model and investigates how this latter depends on the car purchasing price and cost of usage. In particular, as emphasized, the framework assumes that the car technical value can be described by a number of characteristics which are either objectively measurable or subjectively measurable. The idea to conceptualize a product as a “bundle of characteristics” was suggested by Lancaster [16]. According to Lancaster [2] [16], consumers choose and buy product characteristics rather than products themselves. In fact, consumers often consider products as black boxes. In a similar manner, the hedonic price approach points out that product characteristics have different market prices and the product price reflects the prices associated to the main characteristics which describe the product that consumers consider valuable [17] [18]. Thus, there are as many utility functions associated to the product characteristics as the number of these. For example, when consumers are considering to buy one of two cars, A and B, and their decision are based only upon three characteristics – speed, comfort and safety – if they perceive that benefits associated to these three characteristics for car A are more valuable than benefits associated to the same characteristics for car B, they will buy the first car.
Since the 1980s, several scholars have proposed various technometric indexes and approaches to measure the technical value of products with the primary aim to investigate the trajectories of the technological advancement [19] [20] [21] [22] [23] [24] [25]. Coccia [26] provides a comprehensive literature analysis of these methods. Saviotti and Metcalfe [27] propose a model that distinguishes between technical and service characteristics. Technical characteristics include all technological subsystems and components that are embodied in the tangible products. For instance, for a car these characteristics are the engine type, the suspension type, the transmission, etc. Service characteristics include the set of services that the product delivers to the user. For a car these services are, for instance,
speed, safety, comfort, aesthetics, etc. Usually, one technical characteristic affects more than one service characteristic. So, there is no one-to-one mapping between the two sets of technical and service characteristics. The Saviotti and Metcalfe approach [27] requires a detailed knowledge of each technological subsystem and component and their interaction to effectively describe the technological system of a product. Further, the scholars do not take into account any economic variable. Indeed, as Saviotti and Metcalfe [27] point out, the use of economic variables in the evaluation of technical characteristics does not allow distinguishing, for instance, between a pure effect due to technological innovation and an effect due to price decrease. However, even though the rationale behind the argumentation suggested by Saviotti and Metcalfe [27] is acceptable, the economic variables (i.e., the ownership price, the manufacturing costs, the cost of product usage, etc.) cannot be disregarded from the assessment of a product value for money. In developed countries, over the last twenty years, the average price to buy a new car belonging to the low-medium market segment has risen by 100%, while the average income of the typical driver has risen by only 50%. Since the 1970s there has been an increasing effort of car manufacturers for improving fuel efficiency of cars in order to reduce the cost of usage of cars and stimulating market demand even for higher engine capacity products. For the vast majority of consumers who want reliable products at affordable prices, the price for buying the car and the operational cost for using it represent the most relevant purchasing factors.
a)
functional features (FF)
functional
performance set (FP)
functional performance categories (FPC) technological
features (TF) TF1 TF2 TF3 …TFn-1 TFn
FF1 FF2 FF3 …FFm-1 FFm
FP1 FP2 FP3 …FPr-1 FPr
FPC1 FPC2 ... FPCs-1 FPCs
b)
FPC1 FPC2 ... FPCs
functional performance categories (FPC)
product technical value
PTV
cost of product usage
product purchasing cost
product value for
money PUC
PPC
160
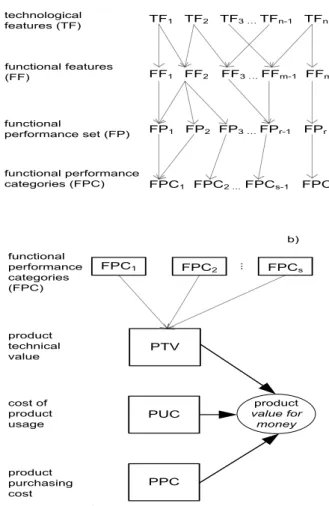
The “value for money” framework that is proposed here is based on the model developed by lo Storto [28], that was adapted from the Saviotti and Metcalfe approach [27]. This framework also takes into account technological features (TF) and functional features (FF) of a product, but adds performance measures associated to functional features (FP) and clusters this functional performance set into a number of categories (FPC) useful to describe categories of functions delivered by the product to the user (Fig. 1, a)). Measures of these functional performance categories are used to calculate the technical value of a product. In the case of a car, different technological subsystems and components such as the engine, the mechanical transmission, the suspensions, the electrical equipment, the cooling device, etc. combine to make up the product. Each subsystem and component works according to certain scientific principles and design rules. These technological features are the outcome of the choices of engineers, the technological progress, and best engineering practices used in the industry. A car is thus described by a number of technical features, such as the engine type, the transmission mechanism, the electronic or electrical equipment, etc. However, these subsystems alone are useless, and only if they are effectively integrated together provide the user with the typical functions and performance of a car. As in lo Storto [28] and Saviotti and Metcalfe [27] conceptualizations of a product, technical features relate to what a product is, while functional characteristics relate to what a product does. The users are usually fully ignorant of the technologies embodied in a car and how these subsystems work. Thus, for a passenger car user it is not relevant if a four or six cylinder engine is assembled in his car, but engine power or speed are surely more important when he decides to buy it. The set of functional performance that are linked to the functional features of the product are more easily measurable than technological features. As it has been pointed out in the literature [26], the pattern of mapping between the technical and functional features cannot be precisely identified and represented as there is no one-to-one correspondence between technical and functional features. Furthermore, using the functional features as a reference for measuring the technical value of a product might be less controversial than using the technical features [29]. For instance, a car could adopt a highly innovative component in its mechanical transmission subsystem, but at the system level (i.e., the product level) that innovation might contribute only modestly to the improvement of performance.
Economic variables, i.e. the product market price, the manufacturing costs and the cost of product usage that the users have to bear, are not included in the construction and measurement of the product technical value. Including economic measures in the calculation of a product technical value index can be misleading, as market price might not reflect the product technology and innovation rate. For instance, the Dacia Duster and the Nissan Qasqhai adopt similar technical platforms and subsystems, but the Nissan product is generally more expensive than Dacia one. Moreover, an improvement of the technological features, and consequently, the technical value of a product, might not be accompanied by an increase in the price. That usually occurs in the personal computer market where customers can buy improved products at the same or a reduced price of products sold in the market one year before. Competition on market factors can be responsible for this change of price.
Furthermore, due to commercial and marketing strategy decisions, some products can be sold at different price in different international markets. Thus, as consumers are also concerned with the price and cost they have to bear to have a product available and use it, and the purchasing decision to buy a product is influenced by the product benefit/cost ratio, the framework has included measurements for the purchasing price and the usage cost of it, too. Fig. 1, b) shows how the combination of the product technical value (PTV), cost of product usage (PUC) and cost of product purchasing (PPC) delivers “value for money” to the customer. The measurements of these variables make it possible to place a product on a 3-dimension space, i.e. the “value for money” space. This framework does not provide any ranking between products but rather it offers the opportunity to investigate the relationships between these variables.
In the following section, the framework is implemented to analyse the product “value for money” in the Italian domestic passenger car market in the temporal window that extends from early 1970s to 1990s.
3. The implementation of the VfM framework in the
Italian car market
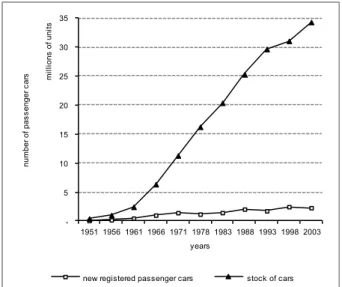
The car manufacturing has been a leading industry in Italy during the economic boom of the 1960s. Since the mid of the 1960s, the car industry characteristics continuously modified adapting to the evolution of the automobile technology and market, having a strong impact on the habits of people as to their attitude to mobility and leisure. Figures 2-4 present data relative to the Italian domestic car market from the 1950s to the 2000s. Data show that the number of new registered cars was steadily increasing until the beginning of the 1990s, making the stock of cars more and more big. However, since the end of 1990s the trend to growth of the car market in Italy slowed down, as the product became a substitution good in the purchasing behavior of many consumers.
-5 10 15 20 25 30 35
1951 1956 1961 1966 1971 1978 1983 1988 1993 1998 2003
num
ber
of
pas
s
enger
c
ar
s mi
ll
io
n
s
o
f
u
n
it
s
years
new registered passenger cars stock of cars
Fig. 2 .The number of new registered cars vs the stock of cars in the Italian domestic market from 1951 to 2003.
161
consequence of the continuous research effort to develop innovative high performing cars, increasing comfort and passenger safety, and to reduce fuel consumption and manufacturing costs, more concerned to environment needs, launching new products into the market attempting to avoid any saturation of the market. In the last decades, due to the increasing product complexity and rapid technology development, the yearly R&D costs that car manufacturers have to bear tend to be close to 4.5% of total costs of their profit and loss statement, and on average the 5% R&D costs are transferred on the final total price of a car. Then, it is important that car manufacturers rationally select more profiting products, as data show that close to 40% of all R&D expenses are absorbed by cars that do not yield the expected revenue. For this reason, the car market is particularly appealing to proof the value for money framework. Next, the VfM framework is implemented in the Italian domestic car market between the 1970s and the early 1990s, investigating the relationship between the car technical value, purchasing price, and cost of usage.
0% 10% 20% 30% 40% 50% 60%
1961 1971 1981 1991 2001
years
stock of cars/population new registered cars/population
Fig. 3. The Italian domestic passenger cars from 1951 to 2001: the stock of cars/population vs the new registered cars/population ratios.
0% 50% 100% 150% 200% 250% 300% 350%
1971 1981 1991 2001
years
trend (stock of cars/population)
trend (new registered cars/population)
Fig. 4. The Italian domestic passenger cars from 1951 to 2001: the trend of the previous two indexes.
3.1 The sample, the choice and measurement of the variables
All passenger cars were identified in the specialized literature. The cars selected for consideration were ordinary passenger cars that have been equipped with conventional spark ignition petrol engines or turbocharged spark ignition engines. Three sub-samples of petrol cars sold in the Italian domestic market were considered (37 cars sold in the market between 1970 and 1972, 82 in the years 1980-82, 97 between 1990 and 1993). Each sub-sample was selected with the aim of having a good mix of all passenger cars sold in Italy in that period. The data were collected from trade literature [30] [31]. The advantages of using published benchmarks found in the automotive press are standardization, completeness, and impartiality of measurement. However, the need to assess and compare subjectively features required the researcher to consult an expert of the automotive field.
Four functional performance categories (FPC) were considered for the measurement of the car technical value (PTV): Engine, Mobility, Safety, and Quality (Tab. 1). In particular, the Engine variable was used as a proxy for measuring the performance of the car engine, depending on the engine power and engine capacity. The Mobility category variable is a proxy that measures the car moving performance in terms of its maximum speed, acceleration and pick up functional features.
The need to take into account several operational conditions of the car suggested measuring this variable by averaging several measurements relative to the acceleration and pick up car performance. The Safety category measures the performance of the capability of a car to assure safety for the passengers and pedestrians. The measurement of this variable requested both subjective and objective evaluation of the braking performance, safety equipment, and driving quality of a car. Finally, the Quality functional performance category relates to the extent a car provides the users (passengers and driver) with expected quality standards as to the internal fittings, comfort, driving easiness, etc. Major details are reported in Tab. A.1 in the Appendix. Furthermore, the car fuel consumption and the car price were respectively included in the analysis as proxies for the cost of product usage and product purchasing cost. As to the cost of product usage, the operational costs of a car that are reported in trade literature are usually calculated assuming that the driver will travel a fixed distance every year (10,000 km), and include the cost of maintenance, ownership tax, cost of fuel consumption, depreciation. For this reason, there exists usually a strong correlation between the purchasing price of a car and the operational cost on one side, and a strong influence of the oil cost and the cost of fuel consumption. Consequently, to avoid any bias due to strong correlation between variables, in the framework fuel consumption was used as a variable for measuring the cost of product usage, and car price to measure the product purchasing cost.
Table 1. The framework variables
variable functional performance set
Functional Performance Categories
Pr
o
d
u
ct
Te
ch
n
ic
al
Va
lu
e Engine
max engine power, max engine torque, engine capacity, and car mass used for normalization
162
acceleration (several operative conditions)average acceleration
Safety braking, safety equipment, driving quality
Quality
noise, comfort, internal fittings, equipment, ventilation and climatization, driving easiness
Cost of Product Usage (PUC)
Fuel consumption average fuel consumption (at different speed rates)
Product Purchasing Cost (PPC)
Car price car price (1993 price index
adopted as reference)
Implementing the VfM framework in the car market required to make the following methodological assumptions, too:
• the car model functional features are measurable and/or a reasonable measure of them exists from a reliable source to generate the functional performance (FP) set [32];
• in the literature a number of analytic relationships have been suggested to aggregate measurements of functional or technical parameters to get synthetic indexes [20] [22][27][33][34][35] [36]. However, the type of relationship might affect the final measurement. Here, it is assumed that positive increments of the performance measure of the functional features of a car lead to an increase of its technical value. The geometric mean was used to aggregate the measures of the single features’ performance to get measurements for each functional performance category, while the quadratic mean was finally used to aggregate measures of the four functional performance categories. Indeed, the quadratic mean is particularly sensitive either to high or low values and makes it possible to emphasize evident differences in different operational conditions of a car. • a five points Likert-type scale was used to measure the
functional features performance set that could be measured only through subjective expert judgements. This is the case of those functional features lacking a performance measurement unit (i.e., the quality of internal fittings of a car) or more simply of those functional features lacking experimental data (i.e., the road holding quality data for the elder cars when assessing safety features). Henceforth, the calculation of the PTV, PUC and PPC measurements used both objective and subjective data.
• in order to get comparable data, the purchasing prices for all cars were measured with reference to year 1993 using the consumer price index CPI(1993).
3.2The translog production function
The Cost of Product Usage (PUC) and the Product Purchasing Cost (PPC) can be supposed to represent the resources that the consumers have to give up to use a car model and to enjoy some functions that provide them with an overall benefit measured by the Product Technical Value (PTV). Thus, both PUC and PPC variables can be considered as factors of a production function that generates value
(PTV) to the car user. A convenient way to identify a formal relationship linking together these variables is to use the Cobb-Douglas formulation (eq. 1) [37] [38] [39]:
PTV
=
kPUC PPC
α β (1)Here k is a constant which depends on the units in which inputs and outputs are measured, while α and β are constants that take into account the relative importance of PUC and PPC in delivering technical value PTV to car users. Contrarily to what is ordinarily done when estimating α and β in the production function here neither any specific assumption or constraint relative to values assumed by these constants is imposed.
The adoption of the Cobb-Douglas function allows us to make use of concepts and calculate indexes driven from the microeconomics production theory:
• iso-technical value, a curve that shows all the combinations of PUC and PPC inputs that yield the same total product technical value PTV. Each iso-technical value curve is associated with a specific level of product technical value. An iso-technical value map is a set of iso-technical value curves each of which shows the product technical value that can be achieved for any set of PUC and PPC inputs;
• average product technical valueof PUC, A(PTV)PUC, is the output per unit of PUC
PUC
PTV
A(PTV) =
PUC
, keeping the amount of PPC fixed. Similarly, the average product technical value of PPC, A(PTV)PPC, can be defined as the output per unitof PPC, PPC
PTV
A(PTV) =
PPC
, keeping the amount of PUC fixed.• marginal product technical value of PUC, M(PTV)PUC, is the additional technical value delivered to consumer as the PUC input is increased one unit
PU
(PTV)
PTV
M(PTV)
(PUC)
PUC
C
∂
=
=
α
∂
. In the sameway, the marginal product technical value of PPC, M(PTV)PPC, is the additional technical value delivered to consumer as the PPC input is increased one unit
PPC
(PTV)
PTV
M(PTV)
(PPC)
PPC
∂
=
=
β
∂
The Cobb-Douglas production function can also be written as a translog function, by taking the logarithmic of both sides of the equation for the production function (eq. 2)
ln(PTV)
=
ln(k)
+
α
ln(PUC)
+
β
ln(PPC)
(2)163
4. Results
Tab. 2 reports general descriptive statistics relative to the sample. Measurements of the VfM framework changed from 1970s to 1990s as an effect of technological innovation and market trends. Three function measures – Engine, Mobility, and Safety - remained almost steady between 1970s and 1980s, but increased from 1980s to 1990s. This improvement was particularly remarkable for Safety. The average rates of this growth were respectively 12.2%, 9.5%, and 33.2%. The Quality function measurement also rose since 1970s. The Product Technical Value followed a similar behavior. As expected, the cost of product usage decreased due to technological innovation while the purchasing price largely increased from 1980s to 1990s. Data also show a great variance of market prices to purchase cars.
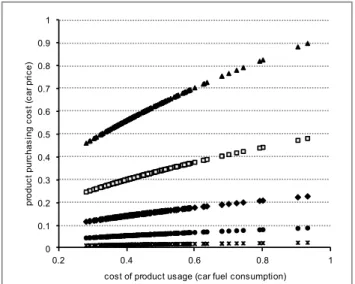
Tab. 3 shows the outcome of the translog regression analysis performed to estimate the function parameters. All parameters are highly significant and the amount of variance explained by the estimated function is statistically acceptable. Figures 5-9 show the indexes’ plots that allow grasping the behavior of this function. In particular, Fig. 5 shows the map of the “iso-technical value” curves that plot PPC as a variable dependent on PUC for fixed values of PTV. For convenience, five curves have been plotted, assuming PTV1=0.330, PTV2=0.461, PTV3=0.592, PTV4=0.723, PTV5=0.854, where 0.330 and 0.854 are respectively the minimum and maximum measurements for PTV. The first and the final curves are thus the boundary curves of the iso-technical value curves map. When the PTV measure is low, PPC appears not to be sensitive to any change of PUC. Generally, car models having a low technical value have a low purchasing price too, independently of their cost of usage that may be either low or high. That is the case, for instance, of the Citroen AMI 8 or the Citroen 2CV special respectively sold in the 1970s and 1980s, or even the FIAT 500 (cc 700) that consumers were buying in the Italian market in the early 1990s.
Table 2. Sample statistics
variable
years
sample
1970s 1980s 1990s
mean (st.dev.) mean (st.dev.) mean (st.dev.) mean (st.dev.)
Engine 0.373
(0.093) 0.375 (0.098) 0.421 (0.121) 0.395 (0.110)
Mobility 0.383
(0.066) 0.399 (0.083) 0.437 (0.108) 0.414 (0.095)
Safety 0.516
(0.045) 0.523 (0.064) 0.697 (0.093) 0.600 (0.116)
Quality 0.560
(0.046) 0.694 (0.072) 0.782 (0.073) 0.710 (0.105)
PTV 0.448
(0.052) 0.480 (0.068) 0.559 (0.089) 0.510 (0.088)
PUC 0.494
(0.075) 0.457 (0.102) 0.424 (0.103) 0.448 (0.102)
PPC 0.062
(0.038) 0.096 (0.094) 0.134 (0.153) 0.107 (0.122)
Table 3. The regression analysis outcome
variable parameter t p level
intercept -0.139 -5.984 0.000
lnPUC -0.147 -4.227 0.000
lnPPC 0.267 23.277 0.000
F=402.25 p level < 0.000 R sq.=0.790
-0.1475 0.2673
PTV= 0.8696PUC PPC
Data analysis reveals the presence of a threshold for the product technical value that is between 0.330 and 0.461 below which was necessary to pay a higher purchasing price in order to buy cars having a greater PTV. When PTV increases, the iso-technical value curves rotate around the axes origin, and PPC becomes more sensitive to any PUC increase. Thus, in this case, for a fixed PTV value if the purchasing price of a car model rises, the cost of its product usage may remarkably increase. That sounds like a paradox, as it happens that consumers will pay a higher purchasing price and have to bear higher costs of usage for a car that offers the same technical value of cheaper cars! When the technical value of a car rises, the consumer has to pay not only for enjoying the technical functions of that car, but also for enjoying some other non technical features, i.e. the brand of the product or the OEM.
0 0.1 0.2 0.3 0.4 0.5 0.6 0.7 0.8 0.9 1
0.2 0.4 0.6 0.8 1
pr oduc t pur c has ing c os t (c ar pr ic e)
cost of product usage (car fuel consumption)
PTV=0.330 PTV = 0.461 PTV = 0.592 PTV = 0.723 PTV = 0.854
Fig. 5. The plot of the product purchasing cost (PPC) vs the cost of product usage (PUC)
164
with the slope of the tangent that remains almost constant. Henceforth, the car technical value has the same sensitiveness to changes of its cost of usage, independently of the car purchasing price. Anyway, when the cost of usage of a car is very low, the PTV becomes slightly more sensitive to changes of PUC measurements, and the slopes of the tangents to curves reduce, with higher curves of the map bending clockwise. Thus, a remarkable reduction of fuel consumption is associated to a growth of the car technical value. But, this PTV increase is higher for more expensive cars that benefit more after a reduction of their cost of usage.
0.3 0.4 0.5 0.6 0.7 0.8 0.9 1.0 1.1
0.2 0.4 0.6 0.8 1.0
PT
V
cost of product usage (car fuel consumption)
PPC = 0.0805 PPC = 0.1773 PPC = 0.3709 PPC = 0.7580 PPC = 1.000
Fig. 6.The plot of the product technical value (PTV) vs the cost of product usage (PUC)
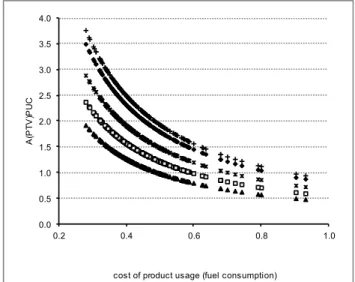
Fig. 7 shows the plot of the average technical value relative to PUC, for fixed values of PPC. The A(PTV)PUC is a measure of the average technical value that each unit of cost of usage is delivering to car users. The map of curves appears rather dense, and as expected, the dependent variable is very sensitive to changes of the cost of car usage, particularly when the purchasing price is growing. However, when the cost of usage diminishes (i.e., from PUC=0.6) the map of curves tends to widen and bend clockwise amplifying the effect of a reduction of the cost of car usage upon the level of A(PTV). So, again, the most expensive cars are more sensitive to changes of the cost of usage. When the car purchasing price largely increases, a reduction of the fuel consumption is able to carry up substantially the average technical value of a car.
Fig. 8 plots the average technical value vs the purchasing price of a car model. As in the previous case, the A(PTV)PPC is measuring the average technical value that a car is delivering to users for every money unit (€). Several classes of cost of car usage were considered. However, all curves in the map overlap. The average technical value is therefore independent of the fuel consumption rate. Diminishing the purchasing price of a car contributes to increasing the average technical value per purchasing price unit delivered to consumers. But, when the price to buy a car grows, the average technical value sharply decreases. Finally, Fig. 9 illustrates the graph of the marginal technical value of PPC, M(PTV)PPC, vs PPC. The marginal technical value is a measure of the productivity of the last unit money
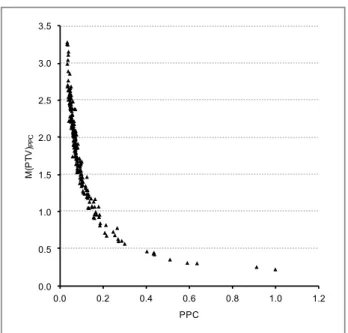
added to the car purchasing price. This plot clearly shows that when the purchasing price of a car increases the spur to the growth of PTV is more and more feeble. In particular, the M(PTV)PPC sharply decreases for those cars having a cheap purchasing price. Vice versa, a small reduction of the purchasing price for those cars in the cheapest market segments contributes to a substantial increase of the marginal technical value, and, consequently, is associated to a higher PTV.
0.0 0.5 1.0 1.5 2.0 2.5 3.0 3.5 4.0
0.2 0.4 0.6 0.8 1.0
A(
PT
V)
PU
C
cost of product usage (fuel consumption)
PPC = 0.0805 PPC = 0.1773 PPC = 0.3709 PPC = 0.7580 PPC = 1.000
Fig. 7. The plot of the A(PTV)PUC vs the cost of product usage (PUC)
0.0 2.0
4.0
6.0 8.0
10.0 12.0
14.0
0.0 0.2 0.4 0.6 0.8 1.0
A(
PT
V)
PPC
PPC
PUC=0.3601 PUC=0 .4 4 1 7 PUC=0.6050 PUC=0 .7 6 8 3
165 0.0
0.5 1.0 1.5 2.0 2.5 3.0 3.5
0.0 0.2 0.4 0.6 0.8 1.0 1.2
M(
P
T
V
)PPC
PPC
Fig. 9 - The plot of the M(PTV)PPC vs the product purchasing cost (PPC)
5. Conclusion
This paper has proposed a methodological framework to assess the “value for money” of products. This framework has been implemented to analyse a sample of 216 cars that were sold in the Italian domestic market between the 1970s and the early 1990s. The framework assumes that the value for money of a car is dependent on the purchasing price and cost of usage that the consumer has to bear for using it, and the car technical value that is a function of certain measurable features of the car, i.e. Engine, Mobility, Safety, and Quality. The relationship between the car technical value, price, and cost of usage was investigated using a translog linear regression equation. The framework has the advantage of simplicity, and it uses a set of both objective and subjective measurable functional features.
This framework can be adopted for several purposes, i.e. to identify some benchmarks in the market, to keep trace of technology and technology advance in the market, to identify the features on which the manufacturers should most focus. Even though the primary aim of this paper was to illustrate the rationale and the main characteristics of the framework, its implementation on a sample of 216 cars sold in the Italian domestic market between the early 1970s and the early 1990s offers the opportunity to infer some interesting
insights. This framework – given the specificity of the sample that collects cars sold between 1970s and 1990s – has not taken into account environmental concerns, i.e. tailpipe emissions, carbon dioxide production, and recycling. Until the 1990s environmental concerns were not challenging and innovation effort in this field was limited. Anyway, the framework is very flexible and both parameters that measure the extent to which a car is environment respectful or any other measure of functional feature may be easily introduced. This paper has showed how the VfM framework can be used to identify general trends and development trajectories in the automotive market, as well as in other technology intensive industries. Nevertheless, the framework can also be purposefully used to identify benchmarks for comparing products. For instance, the generation of the map of the iso-purchasing price curves associated to the price classes of the car market segments, makes it possible to assess how much a car model is distant from an ideal car of the market segment which that model is classified in. This benchmarking analysis also allows assessing whether a car model is placed in the map in the proximity of the ideal car model of its market segment or it is closer to the ideal car model that identifies the contiguous market segment. This investigation might be useful to better focus the real competitive domain of a certain car model. A further utilization of the framework is related to the comparison of groups of products, i.e. car models gathered in clusters according to the temporal window they were sold in the market, in order to explore any changes occurred in the “structure” of the value for money (the parameters or the functional form). In this way, the functional features that contribute most to generate value can more effectively be studied.
The development of the framework has privileged a “neutral” perspective. Indeed, no weights have been used to aggregate partial performance measurements and measurements of the functional performance categories to get the final product technical value measure. As a deliberated choice, all measurements were supposed to have a unit weight, without introducing any weighting system at all. Many times, variable weights are usually the outcome of a subjective judgment that cannot be easily justified. Anyway, the framework flexibility allows introducing a weighting system that accounts for the preferences that consumers have either for certain functional categories or some functional features. Even, the framework can incorporate more sophisticated aggregating functions to develop the VfM measurements.
______________________________ References
[1] Levy SJ, Symbols for Sale, Harvard Business Review 37 (1959) July-August 117-124
[2] Lancaster K, Consumer Demand: A New Approach, Columbia University Press, New York, 1971
[3] Urban GL, Hauser JR, Design and Marketing of New Products, Prentice-Hall, Englewood Cliffs, NJ, 1980
[4] Levitt T, Marketing Success Through Differentiation of Anything, Harvard Business Review 58 (1980) 83-91
[5] Levitt T, Marketing Intangible Products and Product Intangibles,
Harvard Business Review 59 (1981) May-June, 94-102
[6] Holbrook MB, Hirshman EC, The Experiential Aspects of Consumption: Consumer Fantasies, Feelings, and Fun, Journal of Consumer Research 9 (1982) 132-140
[7] Capon N, Glazer R, Marketing and Technology: A Strategic Coalignment, Journal of Marketing 51 (1987) 1-14
[8] Czepiel JA, Competitive Marketing Strategy, Simon & Shuster Custom Publishing, Upple Saddle River: NJ, 1992
166 [10] Panwar A, Nepal B, Jain R, Prakash Yadav O, Implementation of
benchmarking concepts in Indian automobile industry – an empirical study, Benchmarking: An International Journal 20 (6) (2013) 777–804
[11] Fähling J, Huber MJ, Böhm F, Krcmar H, Leimeister JM, Scenario planning for innovation development: an overview of different innovation domains, International Journal of Technology Intelligence and Planning 8 (1) (2012) 75-94 [12] Ledwith A, Martini A, Nicholas J, Nosella A, Exploring radical
innovation search practices, International Journal of Technology Intelligence and Planning 8 (4) (2012) 389-405
[13] lo Storto C, Discovering Technological Strategies Through Patent Analysis: Insights from the Optical Memory Industry, Advanced Science Letters 19 (2) (2013) 634-637
[14] lo Storto C, Benchmarking the patent portfolio: A study of the Italian wind energy manufacturing industry, Advanced Materials Research 838-841 (2014) 3212-3217
[15] Zweck A, Holtmannspotter D, Technology roadmapping: turning hype into a systematic process, International Journal of Technology Intelligence and Planning 5 (1) (2009) 55-72 [16] Lancaster KJ, A New Approach to Consumer Theory, Journal of
Political Economy 74 (1966) 132-157
[17] Griliches Z, (Ed.) Price Index and Quality Change, Harvard University Press, Cambridge: MA, 1971
[18] Saviotti PP, An Approach to the Measurement of Technology Based on the Hedonic Price Method and Related Methods,
Technological Forecasting and Social Change 27 (1985) 309-334 [19] Ayres RU, Empirical Measures of Technological Change at the Sectoral Level, Technological Forecasting and Social Change 27 (1985) 229-247
[20] Dodson EN, Measurement of State of the Art and Technological Advance, Technological Forecasting and Social Change 27 (1985) 129-146
[21] Edwards KL, Gordon JT, Further Research into a Convention for Measuring the State of the Art of Products or Processes,
Technological Forecasting and Social Change 24 (1983) 153-175 [22] Esposito E, Technology Measurement: A Composite Approach,
Technological Forecasting and Social Change 43 (1993) 1-17 [23] Majer H, Technology Measurement: The Functional Approach,
Technological Forecasting and Social Change 27 (1985) 335-354 [24] Martino JP, Measurement of Technology Using Trade-Off Surfaces, Technological Forecasting and Social Change 27 (1985) 147-160
[25] Sahal D, The Generalized Distance Measure of Technology, Technological Forecasting and Social Change 9 (1976) 289-300 [26] Coccia M, Technometrics: origins, historical evolution and new
directions, Technological Forecasting and Social Change 72 (2005) 944–979
[27] Saviotti PP, Metcalfe JS, A Theoretical Approach to the Construction of Technological Output Indicators, Research Policy
13 (1984) 141-151
[28] lo Storto C, Two-Step Method Useful For Support of Technical Benchmarking Practice in the Automotive Market, Inzinerine Ekonomika-Engineering Economics, 25 (2014) 320 - 332 [29] Koh H, Magee CL, A functional approach for studying
technological progress: Application to information technology,
Technological Forecasting and Social Change 73 (2006) 1061-1083
[30] GenteMotori, Years: 1980, 1981, 1982,1991, 1992, 1993, Rusconi Editore, Milano.
[31] Quattroruote, Years: 1970, 1971, 1972, 1980,1981, 1982,1991, 1992, 1993, Editoriale Domus, Milano
[32] Merino DN, Development of a Technological S-Curve for Tire Cord Textiles, Technological Forecasting and Social Change 37 (1990) 275-291
[33] Knight KE, A Functional and Structural Measurement of Technology, Technological Forecasting and Social Change 27 (1985) 107-127
[34] Roslanowska-Plichcinska K, Measuring the Technical-technological State of Products or Processes, Technological Forecasting and Social Change 33 (1988) 63-74
[35] Saviotti PP, Stubbs PC, Coombs RW, Gibbons M, An Approach to the Construction of Indexes of Technological Change and of Technological Sophistication-The Case of Agricultural Tractors,
Technological Change and Social Change 21 (1982) 133-147
[36] Zaidman B, Cevidalli G, The Technology Efficiency Index: A Method for Measuring Process Technologies, Technological Forecasting and Social Change 35 (1989) 51-62
[37] Bridge JL, Applied Econometrics, North-Holland Publishing Company, Amsterdam, 1971
[38] Cobb CW, Douglas PH, A Theory of Production, American Economic Review 18 (1928) 139-165
[39] Ferguson CE, The Neo-Classical Theory of Production and Distribution, Cambridge University Press, New York, 1979 [40] These are normalized values. The PPC=0.0805 corresponds to a
167
Appendix
Table A.1 Measurement of variables of the VfM framework 1 2 = ⋅ i i
i ENG ENG
i i
ENG
POW TOR
ENGINE
CAP MASS
max engine power of car i =
i ENG
POW , TORiENG = max engine torque of car i, CAPiENG = engine capacity of car i, mass of car i
= i
MASS
All measurements are objective and available in trade technical literature. ENGINEi was further normalized in the range [0, 1] by dividing its measurement by the
maximum ENGINE value in sample.
(
) (
)
1
1 1 3
6 4
1 2 3 4 5 6 1 2 3 4
= ⋅ ⋅ ⋅ ⋅ ⋅ ⋅ ⋅ ⋅ ⋅ ⋅
i i i i i i i i i i i i
MAX
MOBILITY AC AC AC AC AC AC U U U U V
1= acceleration of car i in the space [0 - 1 km] i
AC ,
2= acceleration of car i after 400 m i
AC ,
3= acceleration of car i to increase speed from 0 to 60 kmh
i
AC ,
4= acceleration of car i to increase speed from 0 to 80 kmh i
AC ,
5= acceleration of car i to increase speed from 0 to 100 kmh
i
AC , AC6i= acceleration of car i to increase speed from 0 to 120 kmh,
1= pick up of car i to increase speed from 40 kmh
i
U ,
2= pick up of car i to increase speed from 70 to 80 kmh i
U ,
3= pick up of car i to increase speed from 70 to 100 kmh
i
U ,
4= pick up of car i to increase speed from 70 to 120 kmh
i
U ,
4= pick up of car i to increase speed from 70 to 120 kmh i
U , VMAX = max speed of car i
All measurements are objective and available in trade technical literature. MOBILITYi was further normalized in the range [0, 1] by dividing its measurement by the
maximum MOBILITY value in sample.
(
) (
)
1
1 1 2
2 4
1 2 3 4
= ⋅ ⋅ ⋅ ⋅ ⋅
i i i i i i i
SAFETY BRAS BQ S S S S
(
)
1 3
1 2 3
=
⋅ ⋅
i
MAX i
i i i
MIN
MASS MASS BRAS
BS BS BS BS
subjective measure of the braking quality of car i
=
i
BQ , BRASi = braking space of car i, MASSi = mass of car i, maximum car mass in sample
=
MAX
MASS ,
1 = braking space of car i at speed of 60 kmh i
BS ,
2= braking space of car i at speed of 80 kmh
i
BS , BS3i = braking space of car i at speed of 100 kmh,
3= braking space of car i at speed of 100 kmh
i
BS ,
(
)
1
3
1 2 3
minimum in sample
= ⋅ ⋅
MIN i i i
BS BS BS BS ,
1= subjective measure of the steering quality of car i
i
S ,
2= subjective measure of the visibility quality of car i i
S ,
3= subjective measure of the road holding quality of car i
i
S ,
4= subjective measure of the safety equipment quality of car i i
S
All subjective measurements were provided by expert judgment by means of a 5 levels Likert type scale in the range [0, 1]. Objective were available in trade technical literature. SAFETYi was further normalized in the range [0, 1] by dividing its measurement by the maximum SAFETY value in sample.
(
) (
)
1
1 1 3
4 5
1 2 3 4 1 2 3 4 5
= ⋅ ⋅ ⋅ ⋅ ⋅ ⋅ ⋅ ⋅ ⋅
i i i i i i i i i i i
QUALITY NO NO NO NO IQ IQ IQ IQ IQ CO
1 = internal noise level of car i at speed of 60 kmh
i
NO ,
2= internal noise level of car i at speed of 80 kmh
i
NO ,
3= internal noise level of car i at speed of 100 kmh i
NO ,
4= internal noise level of car i at speed of 120 kmh i
NO ,
1= subjective measure of the car i internal fittings quality
i
IQ ,
2= subjective measure of the car i internal ventilation and climate quality
i
IQ ,
3= subjective measure of the car i internal equipment quality i
IQ ,
4= subjective measure of the car i internal space quality i
IQ ,
5= subjective measure of the car i driving seat quality
i
IQ , COi = subjective measure of the car i travel comfort quality
All subjective measurements were provided by expert judgment by means of a 5 levels Likert type scale in the range [0, 1]. Objective were available in trade technical literature. QUALITYi was further normalized in the range [0, 1] by dividing its measurement by the maximum QUALITY value in sample.
1
2 2 2 2 2
4
+ + +
=
i i i i
i ENGINE MOBILITY SAFETY QUALITY
PTV
(
)
1
3
1 2 3
= ⋅ ⋅
i i i i
168
1= fuel consumption of car i in city driving
i
FU ,
2= fuel consumption of car i at speed of 90 kmh
i
FU ,
3= fuel consumption of car i at speed of 120 kmh
i
FU
1993
1993
100
CP(I )
= ⋅
i i
t
PPC PPC
1993
CP(I ) the 1993 consumer price index= , PPC1993i = purchasing price of car i at year 1993, purchasing price of car i sold at year t
= i t