HESSD
9, 9425–9454, 2012Regional climate models downscaling
in the Alpine area
D. Cane et al.
Title Page
Abstract Introduction
Conclusions References
Tables Figures
◭ ◮
◭ ◮
Back Close
Full Screen / Esc
Printer-friendly Version Interactive Discussion
Discussion
P
a
per
|
Dis
cussion
P
a
per
|
Discussion
P
a
per
|
Discussio
n
P
a
per
|
Hydrol. Earth Syst. Sci. Discuss., 9, 9425–9454, 2012 www.hydrol-earth-syst-sci-discuss.net/9/9425/2012/ doi:10.5194/hessd-9-9425-2012
© Author(s) 2012. CC Attribution 3.0 License.
Hydrology and Earth System Sciences Discussions
This discussion paper is/has been under review for the journal Hydrology and Earth System Sciences (HESS). Please refer to the corresponding final paper in HESS if available.
Regional climate models downscaling
in the Alpine area with Multimodel
SuperEnsemble
D. Cane1, S. Barbarino1, L. A. Renier2, and C. Ronchi1
1
Regional Agency for Environmental Protection – Arpa Piemonte, Torino, Italy
2
IPLA Spa, Torino, Italy
Received: 12 June 2012 – Accepted: 31 July 2012 – Published: 13 August 2012
Correspondence to: D. Cane ([email protected])
HESSD
9, 9425–9454, 2012Regional climate models downscaling
in the Alpine area
D. Cane et al.
Title Page
Abstract Introduction
Conclusions References
Tables Figures
◭ ◮
◭ ◮
Back Close
Full Screen / Esc
Printer-friendly Version Interactive Discussion
Discussion
P
a
per
|
Dis
cussion
P
a
per
|
Discussion
P
a
per
|
Discussio
n
P
a
per
|
Abstract
The climatic scenarios show a strong signal of warming in the Alpine area already for the mid XXI century. The climate simulations, however, even when obtained with Regional Climate Models (RCMs), are affected by strong errors where compared with observations, due to their difficulties in representing the complex orography of the Alps
5
and limitations in their physical parametrization.
Therefore the aim of this work is reducing these model biases using a specific post processing statistic technique to obtain a more suitable projection of climate change scenarios in the Alpine area.
For our purposes we use a selection of RCMs runs from the ENSEMBLES project,
10
carefully chosen in order to maximise the variety of leading Global Climate Models and of the RCMs themselves, calculated on the SRES scenario A1B. The reference observation for the Greater Alpine Area are extracted from the European dataset E-OBS produced by the project ENSEMBLES with an available resolution of 25 km. For the study area of Piedmont daily temperature and precipitation observations (1957–
15
present) were carefully gridded on a 14-km grid over Piedmont Region with an Optimal Interpolation technique.
Hence, we applied the Multimodel SuperEnsemble technique to temperature fields, reducing the high biases of RCMs temperature field compared to observations in the control period.
20
We propose also the first application to RCMS of a brand new probabilistic Multi-model SuperEnsemble Dressing technique to estimate precipitation fields, already ap-plied successfully to weather forecast models, with careful description of precipitation Probability Density Functions conditioned to the model outputs. This technique reduces the strong precipitation overestimation by RCMs over the alpine chain and reproduces
25
HESSD
9, 9425–9454, 2012Regional climate models downscaling
in the Alpine area
D. Cane et al.
Title Page
Abstract Introduction
Conclusions References
Tables Figures
◭ ◮
◭ ◮
Back Close
Full Screen / Esc
Printer-friendly Version Interactive Discussion
Discussion
P
a
per
|
Dis
cussion
P
a
per
|
Discussion
P
a
per
|
Discussio
n
P
a
per
|
1 Introduction
The Alps are a very sensitive region for the impacts of the climate change: the tem-peratures increased here more than the world average (Ciccarelli et al., 2008), and the projections for the XXI century show again an increase higher than the average.
Piedmont Region is located in North-Western, at the South-Western edge of the
5
Alpine chain. The Environmental Protection Agency of Piedmont Region is in charge of producing reliable scenarios of the variation of climatic parameters in the changing climate, to allow the evaluation of the impacts on mountain hydrology (project AC-QWA, www.acqwa.ch), on the wildfire potential (project ALPFFIRS, www.alpffirs.eu, for more details see Cane et al, 2012), on the permafrost (project PERMANET www.
10
permanet-alpinespace.eu/), on the alpine lakes (project SILMAS, www.silmas.eu), on mountain biodiversity (EU-INTERREG project “Biodiversit `a una risorsa da conser-vare”), heat waves in the Po Valley towns (Nicolella and Cane, 2012) and any other study of impacts affecting the regional environment.
The temporal scope of our work is the mid XXI century, to drive conclusions that can
15
be used to concrete adaptation measures to the climate change in a reasonable time. We then chose to focus on a single scenario, instead of a range of different scenarios, because for the time interval of interest the larger variations are among the different models, while the different scenarios do not differ so much (Randall et al., 2007).
Our evaluation is then based on Regional Climate Models (RCMs) calculated by the
20
EU project ENSEMBLES on the SRES scenario A1B basis: all the model runs refer to the same grid including Europe.
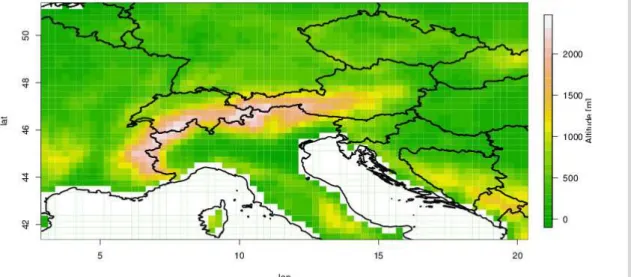
We established two study areas: the Greater Alpine Area (GAR, Fig. 1), including all the Alps (coordinates: 3.00–20.25◦E/41.50–51.25◦N), and a smaller box
cover-ing Piedmont Region (OI, Fig. 2) with higher resolution data (coordinates: 6.5625–
25
9.4375◦
E/44.0625–46.4375◦
N).
HESSD
9, 9425–9454, 2012Regional climate models downscaling
in the Alpine area
D. Cane et al.
Title Page
Abstract Introduction
Conclusions References
Tables Figures
◭ ◮
◭ ◮
Back Close
Full Screen / Esc
Printer-friendly Version Interactive Discussion
Discussion
P
a
per
|
Dis
cussion
P
a
per
|
Discussion
P
a
per
|
Discussio
n
P
a
per
|
temperature and precipitation observations (1961-present) from this dataset are avail-able at a resolution of 25 km.
For the study area of Piedmont daily temperature and precipitation observations (1957–present), collected by The Environmental Protection Agency of Piedmont Re-gion, were carefully gridded on a 14-km grid over Piedmont Region with an Optimal
5
Interpolation (OI) technique. More details can be found in Sect. 2.
As suggested by the name, the Multimodel techniques require several model outputs, which are combined together to obtain collective evaluations. Their use in the climatic simulation is recommended by the Intergovernmental Panel on Climate Change (Knutti et al., 2010).
10
The simplest Multimodel is the “Poor Man Ensemble”, which is an average of different models, without any bias correction or weighting.
In the Multimodel SuperEnsemble technique (Krishnamurti et al., 1999) the models are unbiased and weighted with an adequate set of weights calculated during the so-called training period, with comparison with the observations. This technique is widely
15
applied to weather forecast models (an example in Piedmont can be found in Cane and Milelli, 2006) and to seasonal climate forecasts (Krishnamurti et al., 2000). The stan-dard Multimodel SuperEnsemble technique is here applied to the temperature fields using the period 1961–1980 as training dataset to calculate weights and to obtain daily fields of reanalyses (1981–2000) and scenarios (1981–2050).
20
A new probabilistic Multimodel SuperEnsemble Dressing, with careful description of precipitation Probability Density Functions conditioned to the model outputs was ap-plied to the precipitation fields. This technique allows for a better correction of precip-itation biases depending from the value of the forecast precipprecip-itation. For more details, please see Sect. 2.
25
HESSD
9, 9425–9454, 2012Regional climate models downscaling
in the Alpine area
D. Cane et al.
Title Page
Abstract Introduction
Conclusions References
Tables Figures
◭ ◮
◭ ◮
Back Close
Full Screen / Esc
Printer-friendly Version Interactive Discussion
Discussion
P
a
per
|
Dis
cussion
P
a
per
|
Discussion
P
a
per
|
Discussio
n
P
a
per
|
2 Description of the technique
2.1 Regional climate models and large scale data
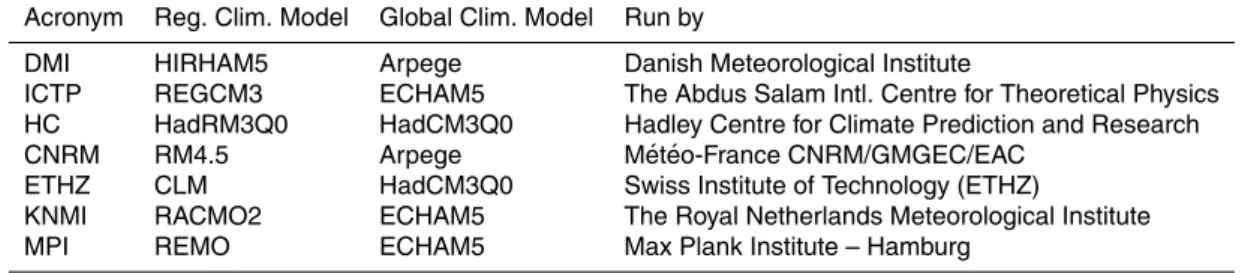
The RCMs simulations used in this paper are a selection of 7 RCMs runs from the ENSEMBLES project (Table 1), carefully chosen in order to maximise the variety of leading Global Climate Models and of the RCMs themselves, and with a data amount
5
compatible with our elaboration and storage facilities. Models descriptions can be found at http://ensemblesrt3.dmi.dk/.
For each model reanalysis runs from the ECMWF ERA-40 reanalysis (1961–2000) and scenario runs (1961–2100) on SRES scenario A1B are available on a common grid at a resolution of 25 km.
10
We interpolated the daily data from the models to the GAR and OI grids with a simple bi-linear interpolation. The use of such an interpolating technique can introduce biases, but the Multimodel techniques include a bias removal before applying the model average.
E-OBS, produced by the EU project ENSEMBLES, is a European land-only daily
15
high-resolution gridded data set for precipitation and minimum, maximum, and mean surface temperature from 1950 to the present. The data set has been designed to pro-vide the best estimate of grid box averages rather than point values to enable direct comparison with RCMs (here the 25-km resolution dataset is employed). The authors employ a three-step process of interpolation, by first interpolating the monthly
precipi-20
tation totals and monthly mean temperature using three-dimensional thin-plate splines, then interpolating the daily anomalies using indicator and universal kriging for precipita-tion and kriging with an external drift for temperature, then combining the monthly and daily estimates. Interpolation uncertainty is quantified by the provision of daily standard errors for every grid square.
HESSD
9, 9425–9454, 2012Regional climate models downscaling
in the Alpine area
D. Cane et al.
Title Page
Abstract Introduction
Conclusions References
Tables Figures
◭ ◮
◭ ◮
Back Close
Full Screen / Esc
Printer-friendly Version Interactive Discussion
Discussion
P
a
per
|
Dis
cussion
P
a
per
|
Discussion
P
a
per
|
Discussio
n
P
a
per
|
2.2 Optimal interpolation of Piedmont data
Regarding the gridded dataset of daily temperature and precipitation data over Pied-mont, an Optimal Interpolation (OI) technique is used to assimilate the row and high density ground station data, arbitrarily displaced in the region, on a selected regular three-dimensional grid map based on a background field (BF) (Kalnay, 2003).
5
Only for temperature, the background field is obtained by a linear tri-dimensional downscaling of ERA-40 archive from 1957 to 2001 and of the ECMWF objective anal-ysis from 2002 to 2009 on a selected grid (0.125◦resolution, with careful description of
the complex orography of the region).
The use of ERA-40 on the regional area is suggested by checking that the main
10
climatological signals (trends, etc.) were congruent with the signals resulted from a station subset working in the period 1950–2000 in Piedmont (Ciccarelli et al., 2008). Where this preliminary congruence checking was not clear (i.e. for precipitation) the row station data themselves provided the background field at first level of gridding process. The method enables to weight the contribute to the temperature/precipitation value
15
on each grid point from the nearest observation data, through suitable parameters. A careful modulation of these parameters as a function of the data density and the use of an external background field help to achieve the time homogeneity and the spatial coherence of the final dataset.
2.3 Standard Multimodel SuperEnsemble technique
20
The conventional SuperEnsemble forecast (Krishnamurti et al., 2000) constructed with bias-corrected data is given by
S =O+
N X
i=1
HESSD
9, 9425–9454, 2012Regional climate models downscaling
in the Alpine area
D. Cane et al.
Title Page
Abstract Introduction
Conclusions References
Tables Figures
◭ ◮
◭ ◮
Back Close
Full Screen / Esc
Printer-friendly Version Interactive Discussion
Discussion
P
a
per
|
Dis
cussion
P
a
per
|
Discussion
P
a
per
|
Discussio
n
P
a
per
|
whereFi is thei-th model forecast,Fi is the mean of thei-th forecast over the training
period,Ois the observed mean over the training period,ai are regression coefficients obtained by a minimisation procedure during the training period, andN is the number
of forecast models involved.
The calculation of the parametersai is given by the minimisation of the mean square 5
deviation in the training periodT .
G=
T X
k=1
(Sk −Ok)2 (2)
By derivation ∂a∂G
i =
O we obtain a set of N equations, where N is the number of
models involved. We then solve these equations using Gauss-Jordan method (Press et al., 1992).
10
A scheme of the technique can be found in Fig. 3.
The standard Multimodel SuperEnsemble technique was applied to the temperature fields using the period 1961–1980 as training dataset to calculate weights and to obtain daily fields of reanalyses (1981–2000) and scenarios (1981–2050).
2.4 Probabilistic Multimodel SuperEnsemble dressing
15
A new probabilistic Multimodel SuperEnsemble Dressing, with careful description of precipitation Probability Density Functions (PDFs) conditioned to the model outputs was applied to the precipitation fields.
For each model we evaluated the PDF of observations conditioned to the model fore-cast in the training period, we fitted the obtained PDFs with a Weibull distribution (after
20
HESSD
9, 9425–9454, 2012Regional climate models downscaling
in the Alpine area
D. Cane et al.
Title Page
Abstract Introduction
Conclusions References
Tables Figures
◭ ◮
◭ ◮
Back Close
Full Screen / Esc
Printer-friendly Version Interactive Discussion
Discussion
P
a
per
|
Dis
cussion
P
a
per
|
Discussion
P
a
per
|
Discussio
n
P
a
per
|
The PDFs are then weighted with the inverse of the Continuous Ranked Probability Score of the models in the training period to obtain a “Multimodel PDF”.
Figure 4 shows an example of our technique evaluated on an ensemble of 4 models. For any given value of precipitation forecasted by the model, a model-specific PDF is evaluated (here shown in blue, red, green and black), and the final Multimodel PDF
5
is obtained with the correct weights (in pink). The vertical lines represent the original “deterministic” value, while the green vertical line associated with the Multimodel dis-tribution is the average of the Multimodel PDF. The obtained average value can differ significantly from the rude average of the input models (the so-called Poor Man En-semble), but the availability of a bias-corrected PDF allows also to widen the ensemble
10
spread, trying to correct the under-dispersion of the multi-model ensemble (in this ex-ample).
This technique allows for a better correction of precipitation biases depending from the value of the forecast precipitation. For more details and a verification on weather forecast models, please refer to Cane and Milelli (2010).
15
The Probabilistic Multimodel SuperEnsemble Dressing technique was applied to the precipitation fields using the period 1961–1980 as training dataset to calculate weights and to obtain daily fields of reanalyses (1981–2000) and scenarios (1981–2050).
For any given day a value is extracted randomly from the PDF so-obtained to give a unique time series of precipitation. The use of a random extraction is justified by
20
the large number of the samplings (∼25 000 in the considered period) and by the
HESSD
9, 9425–9454, 2012Regional climate models downscaling
in the Alpine area
D. Cane et al.
Title Page
Abstract Introduction
Conclusions References
Tables Figures
◭ ◮
◭ ◮
Back Close
Full Screen / Esc
Printer-friendly Version Interactive Discussion
Discussion
P
a
per
|
Dis
cussion
P
a
per
|
Discussion
P
a
per
|
Discussio
n
P
a
per
|
3 Results
3.1 High resolution data in Piedmont
We tested the technique on the past data, splitting the control period of the models into two halves: the first one (1961–1980) used as training period, the second one (1981–2000) as forecast period.
5
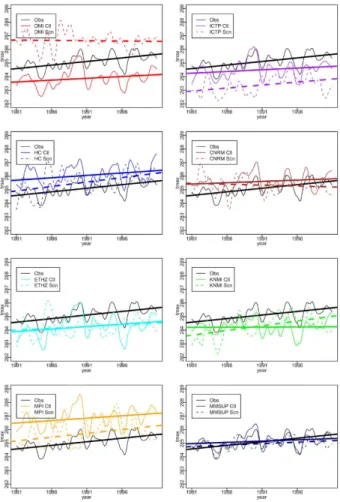
We decomposed the models and Multimodel time series in the trends and seasonal component with the Seasonal Decomposition of Time Series by LOESS (Cleveland et al., 1990) and compared them with the observation series.
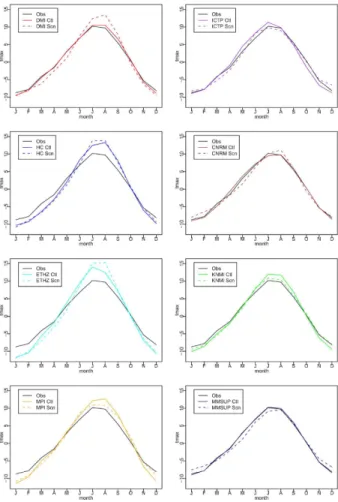
The Multimodel SuperEnsemble temperature fields show a very good reduction of model biases (Fig. 5) and an almost perfect reproduction of the temperature monthly
10
statistics (Fig. 6). In this paper we show only the validation results of the maximum temperature, but those of minimum temperature have identical skill. Please notice that, in the control period, the reanalyses and scenario runs from the models show not only strong biases towards the observed temperature, but, more worrying, the trends sometime differ in a very significant way, and the reanalysis and scenario runs from the
15
same model very often show a different behaviour.
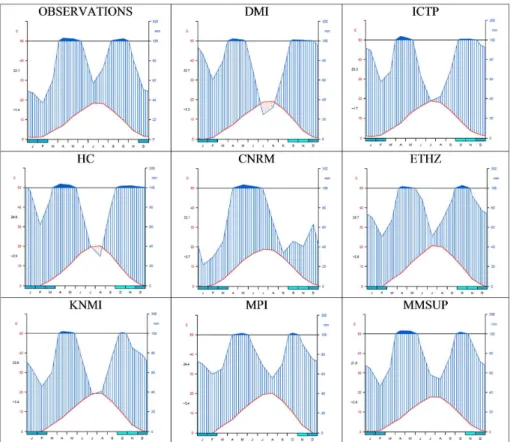
The Walter and Lieth (1960–1967) diagrams referred to precipitation produced by cli-mate models show very strong biases (up to 200 % during winter months) in the Alpine region when compared with observations. In Fig. 7 we compare the Walter and Lieth diagrams after removing each model yearly averaged bias, to obtain a fair comparison
20
with Multimodel which is almost unbiased. Multimodel does not show very large biases in any month and reproduces quite well the precipitation annual distribution, both in time and amount. Only two input models out of seven have quite comparable skill, not taking in account their large average biases.
Nevertheless, the Multimodel post-processing of precipitation allows correcting the
25
HESSD
9, 9425–9454, 2012Regional climate models downscaling
in the Alpine area
D. Cane et al.
Title Page
Abstract Introduction
Conclusions References
Tables Figures
◭ ◮
◭ ◮
Back Close
Full Screen / Esc
Printer-friendly Version Interactive Discussion
Discussion
P
a
per
|
Dis
cussion
P
a
per
|
Discussion
P
a
per
|
Discussio
n
P
a
per
|
On the other hand, it is less effective in reproducing the observed average number of consecutive wet periods defined as more than 5 days with precipitation larger than 1 mm. Being that in the Southern Alps the probability of having a dry day (and therefore to extract a dry day and interrupt a wet days series) is much higher than the probability of having a wet day (and then to interrupt a dry day series), the probabilistic sampling
5
from the Multimodel PDF can introduce a gap in a continuous series of wet days. We are evaluating a technique to avoid this problem by substituting the “white noise” ran-dom number generation used to extract the values from the distribution with a function describing the correct correlation between the consecutive days of rain, but this work is still ongoing.
10
Figures 9–11 show the difference between the Multimodel SuperEnsemble scenario data averaged over the period 2031–2050 with respect to the period 1981–2000, as a function of the season (comparison was made on the scenario for better consistency, but the scenario is very close to observations). The scenario projection shows a sig-nificant increase of the temperatures over the region. This increase is shown also by
15
the original RCMs, but the post-processed data allow a better characterization of the alpine region, with an increasing and more realistic variance of temperature variations as a function of the altitude, thanks to the calibration with observations.
In particular, maximum temperatures averaged in the study area show significant increase in winter (+0.8◦C), spring (
+1.4◦C), summer (
+1.6◦C) and autumn (
+1.2◦C 20
limited to the mountains). Maximum temperatures during spring and summer increase more on the plains than in the mountains.
Minimum temperatures show significant increase in winter (+1.1◦C), spring
(+1.3◦C), summer (
+1.8◦C) and autumn (
+1.3◦C limited to the mountains). Minimum
temperatures during autumn and winter increase more on the plains than in the
moun-25
tains.
HESSD
9, 9425–9454, 2012Regional climate models downscaling
in the Alpine area
D. Cane et al.
Title Page
Abstract Introduction
Conclusions References
Tables Figures
◭ ◮
◭ ◮
Back Close
Full Screen / Esc
Printer-friendly Version Interactive Discussion
Discussion
P
a
per
|
Dis
cussion
P
a
per
|
Discussion
P
a
per
|
Discussio
n
P
a
per
|
few differences among mountains and plains and in autumn, (−26 mm month−1limited
to the mountains).
3.2 The Greater Alpine area perspective
To enlarge our perspective, we applied the same techniques to the whole Alpine areas included in the GAR region. As mentioned above, the reference observations were
5
extracted from the E-OBS dataset, and a preliminary comparison was made with the higher resolution gridded dataset covering Piedmont Region to check their compatibility over the common geographical area. Very few meteorological stations used to produce the two dataset are in common, so they can be considered independent each other.
The two datasets agree very well in the trends of maximum and minimum
temper-10
atures and also maximum temperature absolute value, while the OI minimum tem-peratures are warmer than the E-OBS ones by almost 1◦C. The di
fferences can be explained only partially with a different average elevation of the two datasets, and will be the object of a further investigation.
Anyway, we are mainly interested in variations rather than absolute values, then the
15
strong agreement between the dataset trends in temperature allows for a comparison. Precipitations agree quite reasonably if we take the average over the whole common area, but when we look at specific points in the higher mountains the climate regime described by the two dataset is quite different, then the comparison is more difficult.
First of all, we repeated the validation of the Multimodel results in the control period,
20
with the same agreement already shown for the high resolution dataset.
Figures 12–14 show the difference between the Multimodel SuperEnsemble sce-nario data averaged over the period 2031–2050 with respect to the period 1981–2000, as a function of the season.
The minimum and maximum temperatures show an increasing trend everywhere,
25
HESSD
9, 9425–9454, 2012Regional climate models downscaling
in the Alpine area
D. Cane et al.
Title Page
Abstract Introduction
Conclusions References
Tables Figures
◭ ◮
◭ ◮
Back Close
Full Screen / Esc
Printer-friendly Version Interactive Discussion
Discussion
P
a
per
|
Dis
cussion
P
a
per
|
Discussion
P
a
per
|
Discussio
n
P
a
per
|
the major increases occur in the Southern part of the dominium, with temperature increases up to 2◦
C/50 yr in the Po valley.
If we compare the results in Piedmont with the OI ones, we can see that the GAR signal is similar but weaker and flatter, with less emphasis on the Alpine chain.
As in the OI case, the annual precipitation average over the GAR area does not
5
vary in a significant way, and a significant decrease can be seen only in spring. The timing of the precipitation decrease differs from that observed on the OI grid, and this mismatch can arise from the different precipitation regimes as seen by the two observa-tion datasets. The decrease shown by the GAR data is quite light compared to the one described by the high resolution dataset. We cannot then drive a definitive conclusion
10
about the precipitation behaviour from these two different evaluations.
4 Conclusions and future developments
Multimodel techniques can be used fruitfully to better evaluate the climatic parameters in complex orography regions. Multimodel SuperEnsemble provides a good estimation of temperature and data in Piedmont, with a very good reduction of the biases and a
15
good reproduction of the monthly variations. We introduce here the first application of a new probabilistic Multimodel SuperEnsemble Dressing to precipitation, providing a reasonably good estimation of the precipitation regime in Piedmont.
We evaluated and validated the Multimodel results on two independent datasets, the E-OBS dataset and an high resolution Optimal Interpolation of the Piedmont station
20
data.
Regarding the common geographical area of the two calibration datasets (Piedmont), the temperatures show similar behaviour in the mid-XXI century scenario, with a gen-eral increase compared with the control period, significant in all the seasons except for autumn. The OI data show stronger increases in the higher elevation, while the E-OBS
25
HESSD
9, 9425–9454, 2012Regional climate models downscaling
in the Alpine area
D. Cane et al.
Title Page
Abstract Introduction
Conclusions References
Tables Figures
◭ ◮
◭ ◮
Back Close
Full Screen / Esc
Printer-friendly Version Interactive Discussion
Discussion
P
a
per
|
Dis
cussion
P
a
per
|
Discussion
P
a
per
|
Discussio
n
P
a
per
|
On the other hand, precipitation variations in the scenario depend more on the ob-servations used for the calculation of the Multimodel. In both calibrations, precipitation is not projected to change significantly at an annual scale, while at a seasonal scale we found a decrease in summer precipitation with the OI dataset and in spring for the E-OBS dataset.
5
As concerns the Greater Alpine Region, the projection to the mid XXI century shows a quite uniform temperature increase between plain and mountain regions in all the seasons, except than in spring, when the increase is significant only in the mountains. Precipitation does not show any significant annual variation, and on a seasonal basis it shows a significant decrease in spring only.
10
We are evaluating a technique to better describe the correlation of the daily precipita-tion and to allow a more correct random extracprecipita-tion of a given day from the Multimodel-corrected PDF.
Several impact studies are ongoing with the use of these data, about mountain hy-drology, wildfire potential, permafrost, alpine lakes biology, mountain biodiversity, heat
15
waves.
Acknowledgements. This work was partially funded by the European Project ALP FFIRS under the European Regional Development fund of the Alpine Space Program, reference number 15-2-3-IT, and by the European Union FP7 Integrated Project ACQWA (project reference 212250).
The ENSEMBLES data used in this work was funded by the EU FP6 Integrated Project EN-20
HESSD
9, 9425–9454, 2012Regional climate models downscaling
in the Alpine area
D. Cane et al.
Title Page
Abstract Introduction
Conclusions References
Tables Figures
◭ ◮
◭ ◮
Back Close
Full Screen / Esc
Printer-friendly Version Interactive Discussion
Discussion
P
a
per
|
Dis
cussion
P
a
per
|
Discussion
P
a
per
|
Discussio
n
P
a
per
|
References
Cane, D. and Milelli, M.: Weather forecasts obtained with a Multimodel SuperEnsemble Tech-nique in a complex orography region, Meteorol. Z., 15, 207–214, 2006.
Cane, D. and Milelli, M.: Can a Multimodel SuperEnsemble technique be used for precipitation forecasts?, Adv. Geosci., 25, 17–22, doi:10.5194/adgeo-25-17-2010, 2010.
5
Cane, D., Wastl, C., Barbarino, S., Renier, L., Schunk, C., and Menzel, A.: Fire potential evalu-ation in the climatic scenario: an Alpine area perspective, Agr. Forest. Meteorol., submitted, 2012.
Ciccarelli, N., von Hardenberg, J., Provenzale, A., Ronchi, C., Vargiu, A., and Pelosini, R.: Climate variability in north-western Italy during the second half of the 20th century, Global 10
Planet. Change, 63, 185–195, 2008.
Cleveland, R. B., Cleveland, W. S., McRae, J. E., and Terpenning, I.: STL: A seasonal-trend decomposition procedure based on loess, J. Official Stat., 6, 3–73, 1990.
Haylock, M. R., Hofstra, N., Klein Tank, A. M. G., Klok, E. J., Jones, P. D., and New, M.: A European daily high-resolution gridded dataset of surface temperature and precipitation, J. 15
Geophys. Res.-Atmos., 113, D20119, doi:10.1029/2008JD010201, 2008.
Kalnay, E.: Atmospheric modeling, data assimilation and predictability, Cambridge Univ. Press, 341 pp., 2003.
Knutti, R., Abramowitz, G., Collins, M., Eyring, V., Gleckler, P. J., Hewitson, B., and Mearns, L.: Good Practice Guidance Paper on Assessing and Combining Multi Model Climate Projec-20
tions, in: Meeting Report of the Intergovernmental Panel on Climate Change Expert Meeting on Assessing and Combining Multi Model Climate Projections, edited by: Stocker, T. F., Qin, D., Plattner, G.-K., Tignor, M., and Midgley, P. M., IPCC Working Group I Technical Support Unit, University of Bern, Bern, Switzerland, 2010.
Krishnamurti, T. N., Kishtawal, C. M., LaRow, T. E., Bachiochi, D. R., Zhang, Z., Williford, C. 25
E., Gadgil, S., and Surendran, S.: Improved weather and seasonal climate forecasts from Multimodel SuperEnsemble, Science, 285, 1548–1550, 1999.
Krishnamurti, T. N., Kishtawal, C. M., LaRow, T., Bachiochi, D., Zhang, Z., Williford, C. E., Gadgil, S., and Surendran, S.: Multi-model superensemble forecasts for weather and sea-sonal climate, J. Climate, 13, 4196–4216, 2000.
HESSD
9, 9425–9454, 2012Regional climate models downscaling
in the Alpine area
D. Cane et al.
Title Page
Abstract Introduction
Conclusions References
Tables Figures
◭ ◮
◭ ◮
Back Close
Full Screen / Esc
Printer-friendly Version Interactive Discussion
Discussion
P
a
per
|
Dis
cussion
P
a
per
|
Discussion
P
a
per
|
Discussio
n
P
a
per
|
Nicolella, M. and Cane, D.: Indices bio-meteorologiques en Piemont: evaluation de l’impact du changement climatique avec down-scaling de modeles climatiques regionaux, Proceedings of the Association Internationale de Climatologie, XXV `eme Colloque, September 2012. Press, W. H., Flannery, B. P., Teukolsky, S. A., and Vetterling, W. T.: Numerical Recipes in
Fortran, Cambridge University Press, Cambridge, p. 256, 1992. 5
Randall, D. A., Wood, R. A., Bony, S., Colman, R., Fichefet, T., Fyfe, J., Kattsov, V., Pitman, A., Shukla, J., Srinivasan, J., Stouffer, R. J., Sumi, A., and Taylor, K. E.: Cilmate Models and Their Evaluation, in: Climate Change 2007: The Physical Science Basis, Contribution of Working Group I to the Fourth Assessment Report of the Intergovernmental Panel on Climate Change, edited by: Solomon, S., Qin, D., Manning, M., Chen, Z., Marquis, M., Averyt, K. B., 10
Tignor, M., and Miller, H. L., Cambridge University Press, Cambridge, UK and New York, NY, USA, 2007.
Ronchi, C., De Luigi, C., Ciccarelli, N., and Loglisci, N.: Development of a daily gridded climato-logical air temperature dataset based on a optimal interpolation of ERA-40 reanalysis down-scaling and a local high resolution thermometers network, Poster presentation at 8th EMS 15
Annual Meeting and 7th European Conference on Applied Climatology, Amsterdam, The Netherlands, 2008.
HESSD
9, 9425–9454, 2012Regional climate models downscaling
in the Alpine area
D. Cane et al.
Title Page
Abstract Introduction
Conclusions References
Tables Figures
◭ ◮
◭ ◮
Back Close
Full Screen / Esc
Printer-friendly Version Interactive Discussion
Discussion
P
a
per
|
Dis
cussion
P
a
per
|
Discussion
P
a
per
|
Discussio
n
P
a
per
|
Table 1.The models used in the Multimodel SuperEnsemble evaluation.
Acronym Reg. Clim. Model Global Clim. Model Run by
DMI HIRHAM5 Arpege Danish Meteorological Institute
ICTP REGCM3 ECHAM5 The Abdus Salam Intl. Centre for Theoretical Physics HC HadRM3Q0 HadCM3Q0 Hadley Centre for Climate Prediction and Research CNRM RM4.5 Arpege M ´et ´eo-France CNRM/GMGEC/EAC
ETHZ CLM HadCM3Q0 Swiss Institute of Technology (ETHZ)
HESSD
9, 9425–9454, 2012Regional climate models downscaling
in the Alpine area
D. Cane et al.
Title Page
Abstract Introduction
Conclusions References
Tables Figures
◭ ◮
◭ ◮
Back Close
Full Screen / Esc
Printer-friendly Version Interactive Discussion
Discussion
P
a
per
|
Dis
cussion
P
a
per
|
Discussion
P
a
per
|
Discussio
n
P
a
per
|