UNIVERSIDADE DE SÃO PAULO
FACULDADE DE ECONOMIA, ADMINISTRAÇÃO E CONTABILIDADE DEPARTAMENTO DE ECONOMIA
PROGRAMA DE PÓS-GRADUAÇÃO EM ECONOMIA
Diamonds are Forever
Marcelo Sacchi de Carvalho
Orientador: Prof. Dr. Mauro Rodrigues Junior
São Paulo - Brasil
2016
Long-Run Effects of Mining Institutions in Brazil
Os Diamantes são Eternos
Prof. Dr. Marco Antonio Zago Reitor da Universidade de São Paulo
Prof. Dr. Adalberto Américo Fischmann
Diretor da Faculdade de Economia, Administração e Contabilidade
Prof. Dr. Hélio Nogueira da Cruz Chefe do Departamento de Economia
Prof. Dr. Márcio Issao Nakane
MARCELO SACCHI DE CARVALHO
Dissertação apresentada ao Departamento de Economia da Faculdade de Economia, Ad-ministração e Contabilidade da Universidade de São Paulo como requisito parcial para a obtenção do título de Mestre em Ciências.
Orientador: Prof. Dr. Mauro Rodrigues Junior
Versão Original
São Paulo - Brasil 2016
Diamonds are Forever
Long-Run Effects of Mining Institutions in Brazil
Os Diamantes são Eternos
FICHA CATALOGRÁFICA
Elaborada pela Seção de Processamento Técnico do SBD/FEA/USP
Carvalho, Marcelo Sacchi de.
Diamonds are forever: long-run effects of mining institutions in Brazil /
Marcelo Sacchi de Carvalho. – São Paulo, 2016.
65 p.
Dissertação (Mestrado) – Universidade de São Paulo, 2016.
Orientador:Mauro Rodrigues Junior.
1. Desenvolvimento econômico. 2. Instituições. 3. Economia política. I. Universidade de São Paulo. Faculdade de Economia, Administração e Contabilidade. II. Título.
Acknowledgements
A meus familiares, professores, colegas e amigos. Cada um à sua maneira contribuiu
Ş Mestre não é quem sempre ensina, mas quem de repente aprende.”
Abstract
This paper uses a regression discontinuity approach to investigate whether a set of colonial
policies adopted in the Diamond District have long-run impacts on development. Results
show that the treatment efect is positive on household income, adult literacy and light
density from satellite images. I also explore potential channels through which this historical
event might be leading to these positive outcomes. I use contemporary census data to show
that treated areas have higher urbanization rates. I also present evidence from 1872 and
1890 census data that areas inside the District have persistently higher human capital levels.
Using a geospatial road location database and vector data constructed from historical
maps, I Ąnd that observations inside the DistrictŠs historical boundaries used to have less
dense road networks but this is not true today. Additionally I use data from the 1830s
and from the 1872 census to show that slavery was more intense in treated villages but
after the decline of diamond extraction this diference vanished.
Resumo
Este artigo usa a técnica de regressão descontínua para investigar se um conjunto de
políticas coloniais adotado no Distrito Diamantino tem efeitos de longo prazo sobre o
desenvolvimento econômico. Os resultados mostram que o tratamento tem efeito positivo
sobre renda por domicílio, alfabetização de adultos e densidade de luz obtida através de
imagens de satélite. Eu também exploro potenciais canais de transmissão através dos quais
esse evento histórico poderia gerar esses resultados positivos Eu uso dados do Censo de
2010 para mostrar que áreas tratadas têm taxa de urbanização mais alta. Eu também
apresento evidência a partir dos Censos de 1872 e 1890 de que área dentro do Distrito
tinham nível de capital humano persistentemente mais alto. Usando uma base geoespacial
de localização de estradas e dados vetoriais construídos a partir de mapas históricos, eu
encontro que observações dentro dos limites históricos do Distrito tinham redes viárias
menos densas originalmente, mas que isso não é verdade hoje em dia. Adicionalmente,
eu uso dados dos anos 1830 e do Censo de 1872 para mostrar que havia mais escravidão
em paróquias tratadas, mas que com o declínio da extração dos diamantes essa diferença
desapareceu.
List of Figures
Figure 1 Ű Timeline of the DistrictŠs History . . . 15
Figure 2 Ű Household Income . . . 26
Figure 3 Ű % Adult Literacy . . . 27
Figure 4 Ű log(1 + Luminosity) . . . 27
Figure 5 Ű Luminosity Dummy. . . 30
Figure 6 Ű 2010 Road Density . . . 41
Figure 7 Ű 1820 Road Density . . . 41
Figure 8 Ű 1927 Road Density . . . 43
Figure 9 Ű Mapa da Demarcação Diamantina - 1776 . . . 56
List of Tables
Table 1 Ű Balancing tests . . . 25
Table 2 Ű Development Outcomes - Baseline SpeciĄcations . . . 28
Table 3 Ű Development Outcomes II - Baseline SpeciĄcations . . . 29
Table 4 Ű Urbanization and Public Services . . . 33
Table 5 Ű Slavery in 1830 . . . 35
Table 6 Ű Slavery in 1872 . . . 36
Table 7 Ű Literacy in 1872 . . . 38
Table 8 Ű Literacy in 1890 . . . 38
Table 9 Ű Contemporary Infrastructure Provision - Baseline SpeciĄcations . . . 40
Table 10 Ű Historical Infrastructure Provision . . . 42
Table 11 Ű Development Outcomes - Alternative SpeciĄcations. . . 52
Table 12 Ű Development Outcomes II - Alternative SpeciĄcations . . . 53
Contents
1 Introduction . . . 13
2 Diamond District . . . 15
2.1 Historical Background . . . 15
2.2 The Border Assignment . . . 19
3 Effects on Long-Run Development . . . 21
3.1 Data . . . 21
3.2 Georeferencing the Border . . . 22
3.3 Estimation Framework . . . 23
3.4 Estimation Results . . . 26
4 Channels of Persistence . . . 31
4.1 Urbanization . . . 31
4.2 Slavery . . . 34
4.3 Human Capital . . . 37
4.4 Infrastructure . . . 39
5 Concluding Remarks . . . 45
Bibliography . . . 47
Appendix A . . . 51
13
1 Introduction
In this paper, I examine the long-run impacts of a set of institutions that existed
for about a century in a part of colonial Brazil. When diamonds were discovered within its
domains, the Portuguese Crown singled the area out, creating speciĄc de jure institutions
in order to extract the largest possible surplus from the mineral. The Diamond District
(Distrito Diamantino, in Portuguese) existed for about a century from 1731 until 1832,
spanned approximately 4000 ��2 1
and was subject to policies that difered from the rest
of the colony. Although the rules speciĄc to the diamond-mining area varied along time,
they had a constant objective: maximize metropolitan control in order to avoid smuggling,
extract rents and limit supply. The discrete change at the DistrictŠs border suggests that a
Regression Discontinuity approach might be used to evaluate its efects.
Also, this event attracted a large population and determined the initial settling of the area.
The presence of this natural resource led to higher urbanization rates, which might have
persisted until today. Therefore, this paperŠs contribution is twofold. First, I contribute
to the literature that explores historical quasi-experiments to understand the role of
institutions in long-run development. The efect of historical events on modern economic
outcomes has generated a signiĄcant body of literature in recent years 2
. Following the
seminal contributions of Acemoglu, Johnson e Robinson (2001), Acemoglu, Johnson e
Robinson (2002) and Glaeser e Shleifer (2002), later studies have focused on explaining
the channels through which history might inĆuence present outcomes. For example, Dell
(2010) estimates that districts subject to forced labor in colonial Peru are relatively
underdeveloped today, especially through land tenure and infrastructure provision. Nunn
(2008) shows that African ethnicities more intensely afected by the slave trade are poorer
and Nunn e Wantchekon (2011) Ąnd this can be explained by having developed a culture
of mistrust.
I also contribute to the branch of research that investigates how initial factor endowments
might afect spatial equilibria in the long-run. Theoretical research in economic geography
1
Roughly the size of Rhode Island
2
14
has shown that the possibility of multiple spatial equilibria arise in the presence of increasing
returns to scale (KRUGMAN,1991) or externalities (GLAESER et al., 1992). Meanwhile,
empirical work has found that population and economic activity concentrations tend to
persist over long periods of time. Hence, the location of economic activity might itself be
a channel through which historical events are transmitted over time. For example, Davis e
Weinstein (2002) Ąnd that Japanese cities reverted to prewar population trends even after
being heavily bombarded in World War II. Redding, Sturm e Wolf (2011) show evidence
of historical dependence in industrial location for airport hubs in reuniĄed Germany. More
signiĄcantly to our case, Bleakley e Lin (2012) show that path-dependence in the spatial
distribution of economic activity can exist even if the initial locational advantage has long
faded.
In Chapter 2, I provide an overview of the DistrictŠs history. Chapter 3 discusses the
identiĄcation strategy and presents estimated efects on contemporary development. In
15
2 Diamond District
2.1
Historical Background
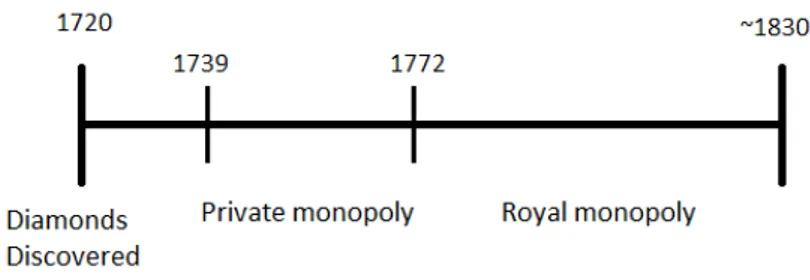
Figure 1 Ű Timeline of the DistrictŠs History
The discovery of diamond mines in colonial Brazil was oicially notiĄed to Lisbon
in 1729. The date of the actual discovery is uncertain, but believed to be around 1720.
The region was located in the Province of Minas Gerais, already experiencing a gold boom
since the previous century. This particular area also mined gold, but it was quite marginal
in the gold-mining context. Its distance to the main gold area around the provincial capital
Vila Rica was 400 km along the Caminho dos Diamantes1
(DiamondsŠ Path), which was
only built in the 1730s. Another evidence of its limited importance before diamonds is
that in 1738 the Comarca do Serro do Frio, which contained the District and the whole
northern half of the Province, had a population of less than 10 thousand (FURTADO,
2008, p.41) (and an area comparable to the United KingdomŠs)2. In spite of the areaŠs
isolation, the presence of diamonds attracted a great deal of attention from the authorities
in Lisbon. Controlling this resource was important not only for its proĄtability but also
due to the prestige that diamonds could confer: according to Mawe (1813), Şalthough
small stones are suiciently abundant to be within the reach of a moderate expenditure
(...), those of a larger size are, and ever have been, rare; and of the most celebrated for
magnitude and beauty, the whole number in Europe scarcely amounts to half a dozen, all
1
http://www.institutoestradareal.com.br/caminhos/diamantes/
2
16
of which are in the possession of sovereign PrincesŤ.
Diamonds were at Ąrst extracted using simple techniques like panning (using a pan to
wash away sediments from a stream bed). The institutional framework that was set up to
regulate diamond mining was initially copied from the gold context: placer deposits were
to be divided in lots that could be bought by anyone with the means to explore them. The
government would collect, besides this initial payment, a tax on each slave used and 20%
of the extracted minerals in kind (the Quinto, literally a Ąfth) (RODRIGUES, 2014). It
quickly became evident that these rules were inadequate for the new product. Physical
diferences made it more diicult to control diamond production and avoid smuggling.
Also, in the gold context the Ąfth was charged in foundries which made it inadequate for
diamonds.
For these reasons, it was decided to set up a new system. In 1734, the DistrictŠs boundaries
were Ąrst demarcated, encircling the places where diamonds were known to occur. At
the same time, the Crown tried to discourage extraction by raising the per capita tax on slaves working in mines. This measure was motivated by international prices being
greatly afected by the DistrictŠs production. Indeed, in 1751 an insider of this market
observed that prices had been so low that Şthe public, and likewise the traders in them,
were so apprehensive of the Brazil mines producing an inexhaustible store; judging from
thence, the world would scarcely think Diamonds worth any consideration, especially as
jewelers so undervalued themŤ (JEFFRIES, 1751). Until the discovery of Brazilian mines,
diamonds were found exclusively in India and Borneo. Brazilian diamonds Ćooded the
market so intensely, though, that in the early XIX century the European market was
Şalmost wholly dependant on Brazil, for its supply of DiamondsŤ (MAWE, 1813). French
physicist Dieulafait(1871, p. 71) reports data that illustrate the size of this efect: a one
carat stone was sold for 545 francs in 1606, but only for 202 in 1750.
Since the higher tax rate on slaves was still unable to limit production, the authorities
decided to halt production completely between 1734 and 1739, while also creating a new
government department called Diamond Administration to run the District. It is quite
17
on the market: oicial correspondence from Lisbon that reached the colony in 1734 said
that His Majesty was providing for Şthe means through which diamonds can recover their
value, which has been so low due to their great abundanceŤ (Biblioteca Nacional, 1960).
Production restarted in 1739 under a new institutional arrangement, becoming the
monopoly of a private investor or group that purchased from the Crown exclusive rights
of extraction inside the District for a period of time. The kingŠs secretary Alexandre de
Gusmão had ordered in a letter to colonial oicials that Şthe extraction of diamonds should
be done by a company, limiting the number of slaves (up to 400) and marking the right
sites to be explored, which cannot be exceededŤ (CORTESÃO,1952). These regulations
had the intention to limit production and to ensure the availability of stones for future
contracts. The private contractsŠ period lasted for 31 years, with 6 contracts being awarded
during this time.
Although the institutional framework designated an oicial to regulate and oversee the
extraction of diamonds in the name of the King, historical evidence suggests that private
contractors had some ability to circumvent regulations regarding slave quotas and
explo-ration sites, and that this was done at least in some occasions. These practical diiculties
led to a progressive tightening of metropolitan policies. In 1745 it was decided to control
access at the DistrictŠs boundary in order to avoid unauthorized mining, allowing entrance
exclusively through the 6 guarded outposts. In 1753, diamond trade was made a monopoly
by the king, which was granted to a private Ąrm. Regarding this decision the Marquis of
Pombal, secretary of State under King José I, stated that the intent was to avoid Şthe
imminent ruin to which are exposed the contract and trade of diamonds from Brazil, not
only for disorders committed in their administration and handling, with private interests
superseding the public good; but also for the considerable contraband that has caused
great damageŤ (Arquivo Público Mineiro,1753).
This process of increasing state control reached its climax in 1771 when, allegedly to
avoid frauds and smuggling, the Crown decided to extract the stones directly, creating a
state-owned company called Royal Diamond Extraction, which had a legal monopoly on
18
into efect inside the District subjecting its population to an even narrower control. This
period, that lasted until the 1830s, has been described as the most extreme example of
colonial despotism in Portuguese America, creating a de jure system that standed out
even in comparison to the surronding areas, subject to the already repressive gold-mining
regulations (TORRES, 1980). Furthermore, Boxer (1962) describes the District in this
period as Şa colony within a colony, cut of from the rest of Brazil by a legal and
adminis-trative barrierŤ and outside observer Saint-Hilaire (1833) saw the District at the time of
his visit as Şalmost a separate state, amidst the vast Empire of BrazilŤ.
On the other hand, residents of the District still had other sources of income, even while
being oicially excluded from extracting diamonds. They could mine gold in the streams
where diamonds were not present and could rent their slaves to the Royal Extraction, as it
had already been done in the private contracts period (FURTADO, 2008). Also, it seems
the Crown did not manage to extract all the surplus from the mineral: contemporary
observers were surprised by how rich the District was, especially considering its isolation
(SAINT-HILAIRE, 1833); and the constant change in regulations suggests that it might
not have been possible to fully control the product in the Ąrst place. A report sent from
the Diamond Administration in its Ąnal years supports this view by saying that Şlots of
mines (...) are secretly explored by gold-diggers, whose punishment is as impracticable
as guarding the sealed lots.Ť (SANTOS, 1976, p. 425). The same document also provides
evidence that diamond mines were almost exhausted at this point: Şthere are no streams
in this demarcation that have not been already mined, and most of the current extraction
is based on the residuals left by former contractorsŤ, adding that exploring these sites
required investing large sums (SANTOS, 1976, p. 427).
After Brazil became independent from Portugal in 1822, successive changes ended the
system created in colonial times. In 1831 the town of Tejuco was promoted to village,
which meant it now had its own municipal chamber; it would become a municipality in
1838. The Diamond Administration was extinguished in October 1832 by Imperial decree
(BRASIL, 1832). The Royal Extraction was oicially extinguished in 1841 (SANTOS,
19
2.2
The Border Assignment
The only explicit criterion for the borderŠs demarcation was the occurrence of
diamonds3. As the oicials sent to demarcate the District described it, Şhaving His Majesty
the King ordered me to demarcate the mineral lands of diamonds in the Comarca do Serro do Frio (...), I sought to gather the appropriate information and saw the most
part of the District; (...) so that it included sites where diamonds have been discovered,
not extending to othersŤ (Biblioteca Nacional,1960). Since the presence of diamonds is
probably correlated with other geographic variables, those factors might have indirectly
inĆuenced the assignment. For example, given that in this region diamonds were found
mostly in streams, the authorities probably took them into account. Indeed, historical
maps (see Appendix) show that some segments of the boundary encircled the headwaters
of the DistrictŠs rivers and since drainage basins are determined by topography, the borders
are probably indirectly inĆuenced by geography. Also, other geographical factors like
vegetation might have inĆuenced the assignment, even if historical documents do not
mention them.
Another possibility is that the borderŠs location was inĆuenced by human factors, such
as previous settlement patterns. This is will not be possible to test due to the paucity of
data on human settling before the discovery of diamonds, but historical evidence suggests
this is not the case. First because prior to the discovery of diamonds this was quite a
marginal area in the mining context, so the region was sparsely populated (as discussed in
Section 2.1). Secondly, the events that followed suggest that residentsŠ interests would not
be taken into account anyway if there was any conĆict with metropolitan objectives.
Santos (1976, p. 34) describes in detail the process of demarcating the diamond-producing
area. The Ąrst demarcation in 1734, made by royal envoy Martinho de Mendonça and
Intendant Raphael Pires Pardinho, was based on 6 marks, following natural landmarks to
make them easily recognizable. The limits were extended in 1739, under the oversight of
provincial governor Gomes Freire de Andrade to include mines that had been discovered
3
20
afterwards. This second demarcation, which was described verbally by the author4 is
consistent to what can be seen in the maps used. Therefore, we can be conĄndent that for
most of the DistrictŠs existence, its borders remained stable.
4
21
3 Effects on Long-Run Development
3.1
Data
Diamond District’s Borders:Historical (see Ągures 9 and 10 maps that show
the study area are available in Costa et al. (2002). Using some features as control points
to georeference the maps in ArcGIS it is possible to correct distortions and digitalize the
boundary. I further discuss the georeferencing process in section 3.2. The maps used to
draw the border, called Mapa da Demarcação Diamantina - 1776 (Map of the Diamond
Demarcation) and Mapa da Demarcação Diamantina acrescentado até o Rio Pardo - 1784
(Map of the Diamond Demarcation including the Pardo River) were both produced during
the Royal Diamond Extraction period. Since they were created for the authorities in
Lisbon under royal command, it is reasonable to believe these maps were made to be as
accurately as possible. Both maps display natural features like rivers and hills, towns,
guard posts and roads, as well as the District border.
Contemporary Development Outcomes: Household income and adult literacy taken
from the Brazilian 2010 Population Census (IBGE, 2011), at the Census tract level.
Household income is measured as the average among private households within each tract.
Literacy is measured as the percentage of people above 40 years of age that are able to
read and write a simple note.
I will also use light density obtained from the Defense Meteorological Satellite ProgramŠs
Operational Linescam System as a proxy for local economic development (HENDERSON;
STOREYGARD; WEIL, 2012). In this data the unit of observation will be pixels of the
satellite image. I will test efects both on the intensive and on the extensive margin (that
is, the probability of a pixel being lit).
It is important to notice that most of the contemporary urban centers in this region already
existed in colonial times 1 and are shown on the historical maps, so even if there were
still some uncertainty in the borderŠs location it would not make a diference in treatment
1
22
status for most lit pixels and Census tracts2.
Geographical Covariates: River locations obtained from IBGE (2010) vector Ąles and
elevation from the SRTM satellite image data (JARVIS et al., 2008). River density is
measured as the total length in meters within each tract or pixel divided by its area in square
kilometers. Elevation is measured in meters within pixels of 3 arc-second (approximately
90 �2
). From the raw elevation data I have also calculated terrain slope and ruggedness 3
for each pixel using ArcGIS and aggregated them to the light density pixels and census
tracts levels.
3.2
Georeferencing the Border
In order to use the information that historical maps contain in a GIS, it is necessary
to assign them coordinates Ąrst (ie, to georeference them). The general idea is that you
have a picture Ąle that is missing spatial reference, but as long as you can correctly identify
the location of some of its points, the software is able to project that picture to the
coordinate space. For example, you can match towns in the old map to their locations
in the contemporary map (each one of these is called a control point). If you do this for
enough control points, then the historical map is projected over the coordinate space
by minimizing errors through an adjustment process of your choice. Obviously the least
accurate the map, the more diicult it is to georeference it because you are not only
superposing it to the ŞrealŤ map, but actually correcting its imperfections (this is usually
the case with old maps).
In our case, since possible control points are not evenly distributed across each map, the
georeferencing alone tended to result in some uncertainty in some segments of the border.
Fortunately, though, the same segments have been deĄned according to natural features.
By exploring this, it becomes possible to greatly improve the borderŠs precision. When the
2
For example, the historical maps show that the urban area then known as Arraial do Tejuco was inside the District. This place today is the city of Diamantina, so I know that the observations within it are treated even if there is some marginal uncertainty in the location of the border.
3
I have measured ruggedness using the Vector Ruggedness Measure introduced bySappington, Longshore
e Thompson(2007), because it is less correlated with slope than other measures. It is an index that
23
adjustment is complete, I create a line shapeĄle from the reshaped border.
Since choosing a diferent polynomial might alter the results, I drew more than one border
for each map, one for each of the nonlinear adjustment methods available in ArcGIS:
2nd and 3rd order polynomials, and spline (which matches each control point exactly,
stretching everything located between them). Taking advantage of the natural landmarks
used to demarcate the District, the border remains fairly stable across diferent adjustment
methods.
3.3
Estimation Framework
Being a part of the DistrictŠs historical area is a discontinuous and deterministic
function of geographic location, suggesting we could estimate its efects using a spatial
regression discontinuity design.
The basic regression for Census tract data is:
�tm=Ð+���������t�+�t′Ñ+�(���t) +Ós+�tm (3.1)
where �tm is the outcome variable in census tract � in municipality �; ���������t is a
dummy variable that takes on value 1 if at least 90% of the tractŠs area is inside the
historical boundary and 0 if less than 10% of it is located within;�′
tis a vector of covariates
aggregated at the tract level (terrain variables and river density); Ós is a border segment
Ąxed efect and �(���t) is the RD polynomial, that controls for smooth variations along
the geographic space.
Or, for the pixel-level estimations:
�pm =Ð+���������p�+�p′Ñ+�(���p) +Ós+�pm (3.2)
with analogous deĄnitions, except that ���������p takes value 1 if at least 95% of the
pixel is inside the DistrictŠs area, 0 if no more than 5% is outside.
The RD approach requires that all relevant factors other than treatment vary smoothly at
the discontinuity. In other words, deĄning�1 and�0 as potential outcomes under treatment
24
at the DistrictŠs border. I examine this hypothesis in Table 1, testing for diferences in
terrain characteristics and river density. Since geographic data are spatially correlated,
all regressions in this table, as well as in most tables in the paper, include two kinds
of standard errors: clustered at the municipality-level in parentheses and with Conley
(1999)Šs adjusment for spatial correlation of an unknowkn form in brackets. The estimates
show that in the narrower bands (12.5, 10 and 7.5 km), the samples are indeed balanced.
Although terrain ruggedness is statistically diferent between subsamples in some cases,
this point estimate is quite small considering that the index is measured in percentage
points, so its theretical range is from 0 to 100.
In order to adequately identify the treatment efect it is important to correctly adjust the
polynomial so that nonlinear variations along the border are not mistaken for discontinuous
efects. Following Dell (2010), I tested multiple speciĄcations for the polynomial. Since
the running variable is two-dimensional (latitude and longitude), I used polynomials of
order up to 3 in geographical coordinates4
. However I found that collapsing the running
vector to a single dimension (ie, measuring the distance from the border)5
and adding Ąxed
efects for border segments produced more stable estimates. Additionally considering that
controlling for high-order polynomials might lead to poor estimates (GELMAN; IMBENS,
2014), I will in most cases use samples within 12.5, 10 and 7.5 km from the border and
control for polynomials of up to 1st order.
4
For example, the cubic polynomial in longitude (x) and latitude (y) is:x3
+y3
+x2 y+xy2
+x2
+
y2
+xy+x+y.
5
25
Table 1 Ű Balancing tests
Balancing Tests Ű RDD estimations with linear polynomials Sample within :
Sample within : <25 km from Border <15 km from Border <12.5 km from Border <10 km from Border <7.5 km from Border
Treatment Treatment Treatment Treatment Treatment
Panel A : Census Tracts
Altitude (m) -25 (69) [51] -21 (63) [55] -23 (58) [56] -56 (57) [55] -67 (55) [60]
Slope (degrees) -2.0 (1.0)* [0.8]*** -1.6 (1.2) [1.0] -1.7 (1.6) [1.1] -0.8 (1.9) [1.3] -0.8 (2.0) [1.5]
Ruggedness (%) -0.19 (0.07)*** [0.05]*** -0.17 (0.08)** [0.06]*** -0.17 (0.10) [0.07]*** -0.08 (0.11) [0.06] -0.04 (0.11) [0.07]
River density (m/km2) 6 (171) [181] 45 (228) [212] 2 (226) [205] -185 (216) [198] -199 (264) [255]
Observations 250 141 118 98 79
Panel B : Pixels (approx. 1 sq km)
Altitude (m) -21 (48) [5]*** -11 (42) [6]* -7 (40) [7] -7 (37) [7] -1 (29) [8]
Slope (degrees) 0.1 (0.6) [0.1] -0.5 (0.7) [0.1]*** -0.8 (0.7) [0.2]*** -1.0 (0.7) [0.2]*** -0.9 (0.7) [0.2]***
Ruggedness (%) -0.02 (0.06) [0.1]** -0.06 (0.06) [0.01]*** -0.08 (0.06) [0.01]*** -0.09 (0.07) [0.02]*** -0.07 (0.06) [0.02]***
River density (m/km2) -35 (30) [22] -27 (37) [27] -29 (39) [30] -32 (51) [34] 12 (63) [40]
Observations 14861 9555 8057 6529 4904
Note: Each line reports estimates of the RD coeicients with linear polynomials. The unit of observation is the Census Tract for data in Panel A and pixels of 30 arc-second resolution ( 1 sq. km) in Panel B. Standard errors clustered at the munipality are in parentheses, and ConleyŠs in brackets. The Ąrst column
26
−.6
−.4
−.2
0
.2
.4
log Household Income
−10000 −5000 0 5000 10000
Normalized Distance
Linear polyn (interacted), Geo. controls, Segment FE
Figure 2 Ű Household Income
3.4
Estimation Results
Table 2 reports the main results for contemporary development outcomes. The
RD graphs6 for the same regressions are shown in Figures 2and 3. Results indicate that
the District has a strong efect of about 45-69% in Household Income. Results for Adult
Literacy are quite stable, although not always signiĄcant, indicating an efect of 18-28
percentage points. Using Nighttime Lights as a proxy for local economic development
(Table 3, Figures 4and 5) also lead to positive results for the treatment, although only
signiĄcant if we consider ConleyŠs standard errors and in sme o the speciĄcations. A pixel
inside the former DistrictŠs area is on average 18% brighter and is 3.6% more likely to
have any light in it. For robustness checks, alternative speciĄcations are reported in the
Appendix: Tables11 and 12.
6
27
−30
−20
−10
0
10
20
% Adult Literacy
−10000 −5000 0 5000 10000
Normalized Distance
Linear polyn (interacted), Geo. controls, Segment FE
Figure 3 Ű % Adult Literacy
−.2
−.1
0
.1
.2
.3
log Luminosity
−10000 −5000 0 5000 10000
Normalized Distance
No polyn, Geo. controls, Segment FE
28
Table 2 Ű Development Outcomes - Baseline SpeciĄcations
2010 Census Data
Linear Polynomial in Distance
Dependent variable: Log(Household Income) % Adult Literacy
Sample within: 12.5 km from Border
Treatment 0.32 15.0
(0.18)* (10.6)
[0.17]* [10.1]
Observations 109 109
Sample within: 10 km from Border
Treatment 0.45 18.2
(0.20)** (12.2)
[0.20]** [10.9]*
Observations 93 93
Sample within: 7.5 km from Border
Treatment 0.69 28.3
(0.19)*** (11.8)**
[0.23]*** [11.4]**
Observations 76 76
Geo. Controls Yes Yes
Border FE Yes Yes
Municipality cluster Yes Yes
Note: Standard errors clustered at the municipality level and according to Conley are in parentheses and brackets, respectively. *, ** and *** indicate signiĄcance at the 10%, 5% and 1% level, respectively.
29
Table 3 Ű Development Outcomes II - Baseline SpeciĄcations
Light Density
Linear Polynomial in Distance
Dependent variable: Log(1 + Luminosity) Luminosity Dummy
Sample within: 12.5 km from Border
Treatment 0.12 0.021
(0.24) (0.048)
[0.06]** [0.012]*
Observations 8057 8057
Sample within: 10 km from Border
Treatment 0.12 0.021
(0.23) (0.046)
[0.06]* [0.013]
Observations 6529 6529
Sample within: 7.5 km from Border
Treatment 0.13 0.020
(0.20) (0.041)
[0.07]* [0.015]
Observations 4904 4904
Geo. Controls Yes Yes
Border FE Yes Yes
Municipality cluster Yes Yes
Note: Standard errors clustered at the municipality level and according to Conley are in parentheses and brackets, respectively. *, ** and *** indicate signiĄcance at the 10%, 5% and 1% level, respectively.
30
−.04
−.02
0
.02
.04
.06
Luminosity Dummy
−10000 −5000 0 5000 10000
Normalized Distance
Linear polyn (interacted), Geo. controls, Segment FE
31
4 Channels of Persistence
This chapter uses diferent kinds of data in order to investigate how the historical
treatment might be causing the positive efects found in Chapter3. Section4.1uses further
Census variables to investigate whether the degree of urbanization might be generating
those outcomes. Section 4.2 evaluates whether diferent intensities in slave labor might
explain the reduced form efect. Section 4.3 evaluates through Census data from the 19th
century if there have been persistent diferences in human capital. Finally, Section 4.4
investigates the provision of a public good, associated with market access: road networks.
To do that I combine contemporary road location data with additional historical maps to
see how road provision evolved since colonial times.
4.1
Urbanization
The distribution of population and economic activity in space might be afected by
locational advantages (natural resources, proximity to other markets, climates suitable to
agriculture) or agglomeration efects, whether derived from increasing returns to scale as in
Krugman (1991) or from externalities like in Glaeser et al.(1992). Some empirical papers
provide evidence of persistence in spatial distribution even after severe population shocks
(DAVIS; WEINSTEIN, 2002;MALONEY; CAICEDO,2016), showing the importance of
natural endowments. Others, such as Bleakley e Lin (2012) and Severnini (2014) show
that the distribution of economic activity persists even after the initial advantages have
disappeared or become obsolete, rendering evidence in support of agglomeration efects.
Since, as discussed in Section 2.1, diamond production has long ceased to be a major
economic activity in the study area, Ąnding evidence that urbanization is a relevant
channel of persistence in this case would necessarily arise from agglomeration efects. I
try to shed light on this issue by investigating whether treated areas are more urbanized
today, according to data from the 2010 Census. Table 4shows that census tracts in the
32
populated1. Also, households within them have more access to several public utilities
typically associated with cities, such as water supply and electricity, and waste and sewage
collection. They are also more likely to be located in paved streets, with public lights and
without open sewers (ie, with sanitation).
The results in this section are reinforced by historical evidence that circulation across
the DistrictŠs border was limited during its existence2
. Therefore, anyone who wanted
to take advantage of the agglomeration economies and locational advantages inside the
demarcation were likely to choose to live in the District.
1
Results for demographic density are similar if the sample is restricted to urban tracts.
2
In addition to the aforementioned presence of soldiers in the gates,Santos(1976, p. 187) points out that after 1782 crossing the DistrictŠs border required a passport and documents proving that the person had some business or issue to attend in a speciĄc destination. Also, an outside observer wrote in his diary that Şclose to thearraial [Paraúna] there is an outpost where a corporal controls passports.
33
Table 4 Ű Urbanization and Public Services
2010 Census Data
Dependent variable: Urban % Water % Sewage Collection % Waste Collection % Electricity % Street Light % Paved Road % No Open Sewer Demographic Density
Sample within: 12.5 km from Border
Treatment 19.7 17.6 19.5 38.6 8.4 27.2 39.4 24.3 1230
(19.6) (19.1) (19.1) (19.3)* (3.8)** (16.0) (14.8)** (15.3) (513)**
[20.9] [17.3] [19.7] [18.1]** [5.2] [20.1] [18.4]** [20.0] [512]**
Observations 118 109 109 109 109 109 109 109 116
10 km from Border
Treatment 35.4 25.5 35.1 47.0 11.0 38.1 51.0 34.5 1771
(18.6)* (15.8) (20.0) (18.4)** (3.4)*** (17.1)** (14.1)*** (16.8)* (522)***
[21.5] [17.0] [19.0]* [18.2]** [6.1]* [20.1]* [19.1]*** [19.8]* [595]***
Observations 98 93 93 93 93 93 93 93 97
7.5 km from Border
Treatment 68.5 42.7 53.0 67.0 12.9 65.8 78.4 66.3 1978
(20.3)*** (11.7)*** (12.2)*** (11.9)*** (3.7)*** (19.5)*** (15.5)*** (19.1)*** (568)***
[20.1]*** [17.1]** [18.6]*** [19.7]*** [6.6]* [19.0]*** [18.6]*** [19.2]*** [476]***
Observations 79 76 76 76 76 76 76 76 79
Geo. Controls Yes Yes Yes Yes Yes Yes Yes Yes Yes
Border FE Yes Yes Yes Yes Yes Yes Yes Yes Yes
Municipality cluster Yes Yes Yes Yes Yes Yes Yes Yes Yes
Note: Standard errors in parentheses clustered at the municipality level. *, ** and *** indicate signiĄcance at the 10%, 5% and 1% level, respectively. All regressions include geographic controls (terrain and river density), as well as border segment Ąxed efects and linear polynomials in distance. Urban is a dummy variable which takes value 1 if the census tract is classiĄed as urban by IBGE. Demographic density is measured as the number of people perkm2
34
4.2
Slavery
In this section I investigate whether slave labor intensity could be related to the
long-run diferences in economic development found in Section 3.4. A substantial body
of literature has shown that slavery and, more generally, forced labor are detrimental
to development long after having been abolished 3
. Since we have seen that treated
observations are more developed in the long-run and that the Crown actively tried to limit
diamonds extraction by controlling the number of slaves employed in it, this is potentially
an important channel of transmission.
To investigate that, I use microdata from lists of the population of the Province of Minas
Gerais in the 1830s (NPHED-UFMG, 2010), right at the end of the DistrictŠs existence.
The data set is organized by community and household, and contain information such as
status (free, slave or ex-slave), occupation, age and race. The dependent variable to be
tested is a dummy that takes value 1 if the individual was a slave. Table 5 shows that a
random individual was 16 to 25% more likely to be a slave if he or she lived inside the
District. Therefore, despite oicial attempts to limit slave labor in diamond extraction,
slaves were still a larger proportion of the population in treated areas. This is not surprising
if we consider that the authorities could never fully extract the surplus from diamonds,
and that in this context a slave was an important asset (they were, after all, employed in
all kinds of manual labor, not only diamond-mining). Hence, it seems that the wealth that
stayed in the diamond-producing area was at least partially invested in slaves.
I also used data from the Ąrst national Census (Diretoria Geral de Estatística Ű DGE,
1874?) to track how slavery intensity evolved after the District ended. These data are
crucial since it was the only oicial census to count slaves (its successor took place in
1890, 2 years after slavery was abolished). Unfortunately, though, the most disaggregated
level is the paróquia so I could only compare the percentage of slaves in each subsample.
Table6reports mean tests for 4 diferent samples and we can see there are no statistically
signiĄcant diferences across subsamples.
For comparison purposes, while the proportion of slaves relative to the general population
3
35
Table 5 Ű Slavery in 1830
Efect on Slave dummy (1830 microdata) Panel A: No Polynomial
Treatment 0.16
(0.07)* Panel B: Linear Polynomial in Distance
Treatment 0.25
(0.003)*** Border FE Yes
Border segments 4 Parish clusters 11 Controls Yes Observations 23854
Note: Controls: age, altitude, slope, ruggedness and river density. Standard errors clustered at the Parish level are in parentheses. *, ** and *** denote signiĄcance at the 10%, 5% and 1% levels respectively.
was on average 16% for both 1872 subsamples, in the 1830 data the proportions for treated
and untreated locations were 47% and 23% respectively. Therefore, the evidence suggests
that in the 40 years following the end of the District, slave labor declined in the region as
a whole but a lot more sharply in treated villages, becoming roughly equal 16 years before
abolition. Therefore, it seems unlikely that slavery is driving the reduced form results.
Either way, since it was more intensive in treated villages, following the literature in the
36
Table 6 Ű Slavery in 1872
Sample within:
60 km 45 km 30 km 15 km
Inside Outside s.e. Inside Outside s.e. Inside Outside s.e. Inside Outside s.e.
1872 Slave proportion (%) 16.0 16.0 (3.2) 16.0 16.3 (3.4) 16.0 15.4 (4.1) 16.0 14.9 (3.9)
Observations 4 16 4 11 4 6 4 4
37
4.3
Human Capital
Another possible channel of transmission is human capital, since the initial presence
of diamonds might have attracted a speciĄc proĄle of immigrants. Also, the District was
more urbanized and the Crown had to establish a substantial bureaucratic apparatus to
control the resource. It is possible that this initial human capital shock was transmitted to
subsequent generations and this could be partially responsible for the diferent contemporary
outcomes.
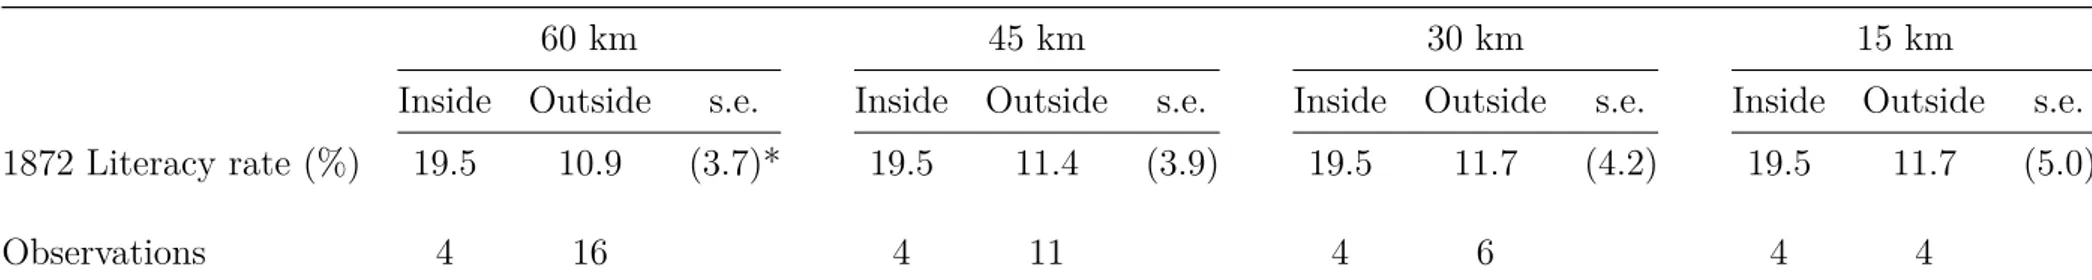
I try to address this question by analizing literacy rates in the 1872 and 1890 censuses
(Diretoria Geral de Estatística Ű DGE,1874?;Diretoria Geral de Estatística Ű DGE,1898).
Both data are available at the paróquia level and in 1872 it represents the proportion of
literacy among non-slaves. Mean tests are reported in Tables 7 and 8, and the results are
fairly stable across diferent samples and over time. These estimates suggest a treatment
efect of about 10 percentage points in literacy rates, even decades after the District had
ceased to exist. If we compare these results with the contemporary ones in Tables 2 and
11, we can see that this diference is very persistent through time.
Considering the discussion in Section 4.1, we can speculate that this path-dependence
38
Table 7 Ű Literacy in 1872
Sample within:
60 km 45 km 30 km 15 km
Inside Outside s.e. Inside Outside s.e. Inside Outside s.e. Inside Outside s.e.
1872 Literacy rate (%) 19.5 10.9 (3.7)* 19.5 11.4 (3.9) 19.5 11.7 (4.2) 19.5 11.7 (5.0)
Observations 4 16 4 11 4 6 4 4
Note: The unit of observation is the Parish (Parochia), the level below municipalities at the 1872 census. Standard errors allowing for unequal variances across groups are in parentheses. ***, ** and * denote, respectively, signiĄcance at the 1%, 5% and 10% levels.
Table 8 Ű Literacy in 1890
Sample within:
40 km
30 km
10 km
Inside Outside
s.e.
Inside Outside
s.e.
Inside Outside
s.e.
1890 Literacy rate (%)
17.8
9.6
(3.8)*
17.8
9.9
(4.0)*
20.8
11.2
(4.1)**
Observations
10
16
10
10
8
4
39
4.4
Infrastructure
Another possible channel that could be driving the results is physical infrastructure.
To test this hypothesis I will focus on a speciĄc public good that might lead to diferent
development paths through market access: road networks. In order to test whether its
provision is diferent under treatment, I will use data from diferent sources which allows
us to see how it evolved over time. For contemporary provision I use vector data on road
locations from (IBGE,2010). Georeferencing Mappa. . . (18--), an early-19th century4 map
of an area that includes the District, and municipal maps from 19275 available in Minas
Geraes - Serviço de Estatística Geral (Secretaria de Agricultura) (1927), I was also able to
generate analogous data for these other points in time. The 1800s map is shown in Figure
11 and the ones from 1927 are avalable online6. The 1927 maps include 3 kinds of road:
automobile roads (estrada de automóvel, with only 2 short stretches in the sample), cart roads (estrada carroçável) and pathways (caminhos, the vast majority). The map from the 1800s does not explain what exactly its roads are, but judging from the early 20th
century map it is reasonable to assume they are all caminhos. From these continuous data
I measured road density per pixel in meters per ��2, and estimated treatment efects
through spatial RD.
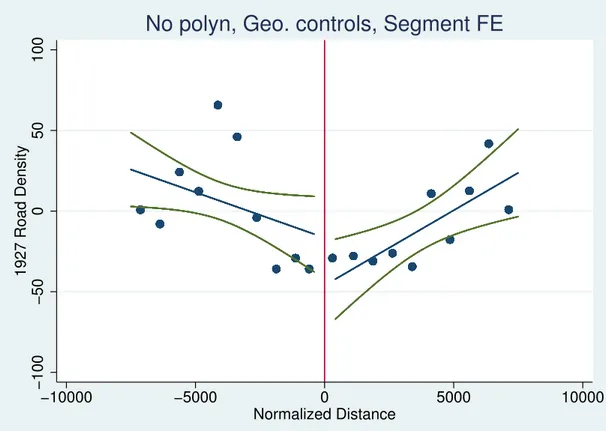
Table9 and Figure 6show it is hard to say there is any efect on contemporary roads. On
the other hand, estimates presented in Table 10and Figure7suggest this was not the case
when the District still existed. Although imprecisely estimated, the efect is consistently
negative and marginally signiĄcant in the narrowest sample. Although somewhat surprising
given the DistrictŠs importance, this efect is not hard to explain since it is very likely that
colonial authorities limited road building inside the District to avoid smuggling (as we
have seen before, for most of the time crossing the border was only allowed through 6
guarded outposts). For the 1927 data in Table 10 and Figure 8, the treatment efect is
more precisely estimated and even stronger.
4
The exact date of this map is unknown, but since it shows the District, it cannot be more recent than 1830.
5
Only parts of 4 1920s municipalities were located within 15 km of the DistrictŠs border: Conceição, Curvello, Diamantina and Serro.
6
40
Table 9 Ű Contemporary Infrastructure Provision - Baseline SpeciĄcations
Road Density (m per sq. km) 2010 Data Polynomial Linear in Distance Sample within: 12.5 km from Border
Treatment 23.4
(12.1)* [14.4] Observations 8057
Sample within: 10 km from Border
Treatment 11.3
(18.0) [16.5] Observations 6529
Sample within: 7.5 km from Border
Treatment -9.7
(23.1) [19.3] Observations 4904 Geo. Controls Yes
Border FE Yes
Municipality cluster Yes
Note: Standard errors clustered at the municipality level and according to Conley are in parentheses and brackets, respectively. *, ** and *** indicate signiĄcance at the 10%, 5% and 1% level, respectively.
All regressions include geographic controls (terrain and river density), border FE and linear polynomials in distance.
Put together, these estimations suggest the Portuguese underprovided transport
infras-tructure in the District to enhance control over diamonds, and it would take more than
a century after Independence for the area to catch up to the surroundings. Over time,
however, road provision inside the former District seems to be catching up, probably
because there was a suppressed demand due to its higher urbanization rate. It is important
to notice that BrazilŠs highways were built after 1927, so it is likely that 20th century
policy-makers identiĄed this suppressed demand for transport infrastructure and directed
41
−50
0
50
100
log Luminosity
−10000 −5000 0 5000 10000
Normalized Distance
No polyn, Geo. controls, Segment FE
Figure 6 Ű 2010 Road Density
−40
−20
0
20
40
60
1820 Road Density
−10000 −5000 0 5000 10000
Normalized Distance
No polyn, Geo. controls, Segment FE
42
Table 10 Ű Historical Infrastructure Provision
Road Density (m per sq. km) - Historical Data 1820 Pathways 1927 Roads Polynomial Linear in Distance
Sample within: 12.5 km from Border
Treatment -4.8 -59.1
(15.0) (22.7)** [12.2] [15.0]***
Observations 7511 8057
Sample within: 10 km from Border
Treatment -15.9 -64.0
(17.1) (22.1)*** [13.8] [16.4]***
Observations 6137 6529
Sample within: 7.5 km from Border
Treatment -26.3 -26.0
(27.3) (26.8) [16.6] [18.6]
Observations 4639 4904
Geo. Controls Yes Yes
Border FE Yes Yes
Municipality cluster Yes Yes
Note: Standard errors clustered at the municipality level and according to Conley are in parentheses and brackets, respectively. *, ** and *** indicate signiĄcance at the 10%, 5% and 1% level, respectively.
43
−100
−50
0
50
100
1927 Road Density
−10000 −5000 0 5000 10000
Normalized Distance
No polyn, Geo. controls, Segment FE
45
5 Concluding Remarks
This paper explores a probably exogenous source of institutional variation in the
Diamond District of colonial Brazil to estimate its efects on long-run development and
analyze potential channels of persistence. I estimate that households inside the DistrictŠs
historical boundaries are at least 40% richer and that adult literacy rates area at least 15%
higher. Using nighttime lights data as a proxy for local economic development, I show that
1��2
pixels inside the treated area are 3.6% more likely to be have any light in them, and
have 18% brighter lights on average. Then I investigate 4 possible channels of persistence,
which allow me to test diferent theories of economic development: urbanization, human
capital, slave labor and physical infrastructure.
I Ąnd that, even though the natural resource that made it attractive has long been
exhausted, the areas inside the District are still more urbanized. This supports the idea
that agglomeration economies might indeed be an important mechanism in explaining
path-dependence in the spatial distribution of population and economic activity. I could
not test if this could be due to increasing returns to scale, but I do present evidence that
human capital is persistently higher among residents of the former District (suggesting
that externalities might be playing a role).
I also document that slavery was more intense inside the District at Ąrst, which is consistent
with the idea that treated areas were richer since slaves were an important asset in this
society. This diference, however, had already disappeared only 4 decades after the DistrictŠs
end. Therefore, it does not seem that this channel is relevant in this context. If it did have
any contemporary efects it would probably attenuate the reduced form estimated efect,
since slavery has been shown in the literature to cause underdevelopment.
Finally, I show evidence that road provision was originally lower inside the District, and it
remained so even after a hundred years. These results are not present in contemporary
data, suggesting that the higher concentration of population and economic activity pressed
47
Bibliography
ACEMOGLU, D.; GARCÍA-JIMENO, C.; ROBINSON, J. A. Finding Eldorado: Slavery and long-run development in Colombia. Journal of Comparative Economics, v. 40, n. 4, p. 534Ű564, 2012. Disponível em: <http://ideas.repec.org/a/eee/jcecon/v40y2012i4p534-564. html>. 34
ACEMOGLU, D.; JOHNSON, S.; ROBINSON, J. A. The Colonial Origins of Comparative Development: An Empirical Investigation. American Economic Review, v. 91, n. 5, p. 1369Ű1401, December 2001. Disponível em: <http:
//ideas.repec.org/a/aea/aecrev/v91y2001i5p1369-1401.html>. 13
ACEMOGLU, D.; JOHNSON, S.; ROBINSON, J. A. Reversal Of Fortune: Geography And Institutions In The Making Of The Modern World Income Distribution. The Quarterly Journal of Economics, v. 117, n. 4, p. 1231Ű1294, November 2002. Disponível
em: <http://ideas.repec.org/a/tpr/qjecon/v117y2002i4p1231-1294.html>. 13
Arquivo Público Mineiro. Alvará de lei, porque Sua Majestade há por bem tomar debaixo da sua real proteção o contrato dos diamantes do Brasil, e fazer exclusivo o comércio das referidas pedras na forma que nele se declara. In: Secretaria de Governo da Capitania (Seção Colonial). BELÉM - LISBOA:
Arquivo Público Mineiro, 1753. SG-CX.05-DOC.34. Disponível em: <http: //www.siaapm.cultura.mg.gov.br/modules/brtacervo/brtacervo.php?cid=569>. 17
Biblioteca Nacional. Do Descobrimento dos Diamantes, e Diferentes Methodos, que se tem Praticado na sua Extracção. Rio de Janeiro: Divisão de Publicações e Divulgação, 1960. v. 80. (Anais da Biblioteca Nacional, v. 80). 17,19
BLEAKLEY, H.; LIN, J. Portage and Path Dependence. The Quarterly Journal of Economics, v. 127, n. 2, p. 587Ű644, 2012. Disponível em: <https://ideas.repec.org/a/
oup/qjecon/v127y2012i2p587-644.html>. 14,31
BOXER, C. The Golden Age of Brazil, 1695-1750: Growing Pains of a Colonial Society. Published in Companyöperation with the Sociedade de Estudos Históricos Dom Pedro Segundo, Rio de Janeiro, by the University of California Press, 1962. (CAL.: Univ. of California Press). ISBN 9780520015500. Disponível em:
<https://books.google.com.br/books?id=IRRR7gaMZxMC>. 18
BRASIL. Decreto de 25 de outubro de 1832. Extingue a Junta da Administração Diamantina do Tejuco, e crea uma nova Administração na villa de Tejuco. In: Coleção de Leis do Império do Brasil - 1832. [s.n.], 1832. I, pt. 1, p. 174.
Disponível em: <http://www2.camara.leg.br/legin/fed/decret_sn/1824-1899/ decreto-37341-25-outubro-1832-563874-norma-pl.html>. 18
BRUHN, M.; GALLEGO, F. A. Good, Bad, and Ugly Colonial Activities: Do They Matter for Economic Development? The Review of Economics and Statistics, v. 94,
n. 2, p. 433Ű461, May 2012. Disponível em: <http://ideas.repec.org/a/tpr/restat/ v94y2012i2p433-461.html>. 34
48
CORTESÃO, J. Alexandre de Gusmão e o Tratado de Madrid: 1695-1735. Rio de Janeiro:
Ministério das Relações Exteriores, 1952. Part II, Tome II. 17
COSTA, A. G. et al. Cartografia das Minas Gerais : da capitania a província. Belo
Horizonte: Editora UFMG, 2002. ISBN 8570413289. 21
DAVIS, D. R.; WEINSTEIN, D. E. Bones, bombs, and break points: The geography of economic activity. American Economic Review, v. 92, n. 5, p. 1269Ű1289, December 2002.
Disponível em: <http://www.aeaweb.org/articles?id=10.1257/000282802762024502>. 14,
31
DELL, M. The Persistent Efects of PeruŠs Mining Mita. Econometrica, v. 78, n. 6, p. 1863Ű1903, November 2010. Disponível em: <http://ideas.repec.org/a/ecm/emetrp/ v78y2010i6p1863-1903.html>. 13, 24,34
DIEULAFAIT, L. Diamants et pierres précieuses, par Louis Dieulafait,... Hachette, 1871.
Disponível em: <http://babel.hathitrust.org/cgi/pt?id=nyp.33433090765060>. 16
Diretoria Geral de Estatística Ű DGE. Recenseamento do Brazil em 1872. Typ. de G. Leuzinger e Filhos, Rio de Janeiro, 1874? v. 8, 9. Disponível em:
<http://biblioteca.ibge.gov.br/biblioteca-catalogo?view=detalhes&id=225477>. 34, 37
Diretoria Geral de Estatística Ű DGE. Sexo, raça e estado civil, nacionalidade, filiação culto e analphabetismo da população recenseada em 31 de dezembro de 1890. Rio de Janeiro: Oicina da Estatística, 1898. Disponível em: <http:
//biblioteca.ibge.gov.br/biblioteca-catalogo.html?view=detalhes&id=225487>. 37
FURTADO, J. F. O Livro da Capa Verde: o regimento diamantino de 1771 e a vida no Distrito Diamantino no periodo da Real Extração. Sao Paulo, SP, Brasil Belo Horizonte,
Brasil: Annablume Pos Graduacao em Historia, UFMG, 2008. ISBN 9788574197975. 15,
17, 18, 19
GELMAN, A.; IMBENS, G. Why High-order Polynomials Should not be Used in Regression Discontinuity Designs. [S.l.], 2014. (Working Paper Series, 20405). Disponível
em: <http://www.nber.org/papers/w20405>. 24
GLAESER, E. L. et al. Growth in cities. Journal of Political Economy, v. 100, n. 6, p. 1126Ű1152, 1992. Disponível em: <http://dx.doi.org/10.1086/261856>. 14, 31
GLAESER, E. L.; SHLEIFER, A. Legal origins. The Quarterly Journal of Economics,
v. 117, n. 4, p. 1193Ű1229, 2002. Disponível em: <http://qje.oxfordjournals.org/content/ 117/4/1193.abstract>. 13
HENDERSON, J. V.; STOREYGARD, A.; WEIL, D. N. Measuring economic growth from outer space. American Economic Review, v. 102, n. 2, p. 994Ű1028, 2012. Disponível
em: <http://www.aeaweb.org/articles.php?doi=10.1257/aer.102.2.994>. 21
IBGE. Base cartográfica contínua ao milionésimo. [S.l.], 2010. 1:1000000. Disponível em:
<http://www.visualizador.inde.gov.br/>. 22, 39
49
JARVIS, A. et al. Hole-filled seamless SRTM data V4. 2008. International Centre for
Tropical Agriculture (CIAT).ℎ���://����.���.�����.���. 22
JEFFRIES, D. A Treatise on Diamonds and Pearls: In which Their Importance is Considered: and Plain Rules are Exhibited for Ascertaining the Value of Both: and the True Method of Manufacturing Diamonds. C. and J. Ackers, 1751. Disponível em:
<https://books.google.com.br/books?id=--U4AAAAMAAJ>. 16
KRUGMAN, P. Increasing Returns and Economic Geography. Journal of Political Economy, v. 99, n. 3, p. 483Ű99, June 1991. Disponível em: <https:
//ideas.repec.org/a/ucp/jpolec/v99y1991i3p483-99.html>. 14, 31
MALONEY, W. F.; CAICEDO, F. V. The persistence of (subnational) fortune. The Economic Journal, Wiley Online Library, 1 2016. ISSN 1468-0297. Disponível em:
<http://dx.doi.org/10.1111/ecoj.12276>. 31
MAPPA da freguesia da Villa do Príncipe ...: que contem a nordeste a applicação do rio Preto; no centro a demarcação Diamantina, encravada nesta, e em parte da freguesia do Rio Vermelho ao Oriente; e a sueste o territorio da Villa do Principe, Itambé, Rio do Peixe e Guanhans. 18ŰŰ. 1 mapa ms, desenho a tinta nanquim, 45 x 33,5. Disponível em: <http://objdigital.bn.br/objdigital2/acervo_digital/div_cartograĄa/cart512349/ cart512349.jpg>. 39
MAWE, J. A Treatise on Diamonds and Precious Stones, Including Their History -Natural and Commercial: To which is Added Some Account of the Best Methods of Cutting and Polishing Them. Longman, Hurst, Rees, Orme, and Brown, 1813. Disponível em:
<https://books.google.com.br/books?id=ahcxAAAAMAAJ>. 15, 16
Minas Geraes - Serviço de Estatística Geral (Secretaria de Agricultura). Album Chorographico Municipal do Estado de Minas Geraes. Bello Horizonte. Imprensa Oicial, 1927. Disponível em: <http://www.albumchorographico1927.com.br/>. 39
NPHED-UFMG. População nas Listas Nominativas de Minas Gerais na década de 1830 Poplin-Minas-1830 1.0. [S.l.], 2010. Disponível em:<http://www.nphed.cedeplar.ufmg.br>.
34
NUNN, N. Slavery, Inequality, and Economic Development in the Americas: An Examination of the Engerman-Sokoloff Hypothesis. [S.l.], 2007. Disponível em:
<http://ideas.repec.org/p/pra/mprapa/4080.html>. 34
NUNN, N. The Long-Term Efects of AfricaŠs Slave Trades. The Quarterly Journal of Economics, v. 123, n. 1, p. 139Ű176, 02 2008. Disponível em: <http: //ideas.repec.org/a/tpr/qjecon/v123y2008i1p139-176.html>. 13
NUNN, N. The Importance of History for Economic Development. Annual Review of Economics, v. 1, n. 1, p. 65Ű92, 05 2009. Disponível em: <http: //ideas.repec.org/a/anr/reveco/v1y2009p65-92.html>. 13
NUNN, N.; WANTCHEKON, L. The Slave Trade and the Origins of Mistrust in Africa.
American Economic Review, v. 101, n. 7, p. 3221Ű52, December 2011. Disponível em:
50
REDDING, S. J.; STURM, D. M.; WOLF, N. History and Industry Location: Evidence from German Airports. The Review of Economics and Statistics, v. 93, n. 3, p. 814Ű831, August 2011. Disponível em: <https://ideas.repec.org/a/tpr/restat/v93y2011i3p814-831.html>.
14
RODRIGUES, C. M. Os mapas das pedras brilhantes: a cartografia dos sertanistas, dos engenheiros militares e dos padres matemáticos sobre o Distrito Diamantino do Serro do Frio (1714-1771). Dissertação (Mestrado) Ů Universidade Federal de Minas Gerais, 2014.
16
SAINT-HILAIRE, A. de. Voyage dans le district des diamants et sur le littoral du Brésil.
[s.n.], 1833. Disponível em: <https://books.google.fr/books?id=t9uuu0HqmBgC>. 18
SANTOS, J. F. dos. Memórias do distrito diamantino da Comarca do Serro do Frio.
fourth. [S.l.]: São Paulo: USP, 1976. 18, 19,20, 32
SANTOS, M. M. D. dos; SEABRA, M. C. T. C. de. Motivação toponímica da comarca do serro frio: estudo dos registros setecentistas e oitocentistas em mapas da capitania de minas gerais. 2009. 21
SAPPINGTON, J. M.; LONGSHORE, K. M.; THOMPSON, D. B. Quantifying landscape ruggedness for animal habitat analysis: A case study using bighorn sheep in the mojave desert. The Journal of Wildlife Management, Blackwell Publishing Ltd, v. 71, n. 5, p.
1419Ű1426, 2007. ISSN 1937-2817. Disponível em: <http://dx.doi.org/10.2193/2005-723>.
22
SEVERNINI, E. R. The Power of Hydroelectric Dams: Agglomeration Spillovers. [S.l.], 2014. Disponível em: <https://ideas.repec.org/p/iza/izadps/dp8082.html>. 31
SILVA, D. da et al. Os diários de Langsdorff -. SciELO - Editora FIOCRUZ, 1997. ISBN 9788575412442. Disponível em: <https://books.google.com.br/books?id= hW0uBAAAQBAJ>. 32
TORRES, J. d. O.História de Minas Gerais. Editora Lemi, 1980. (História de Minas Gerais,
51
52
Table 11 Ű Development Outcomes - Alternative SpeciĄcations
2010 Census Data
No polynomial
Dependent variable: Log(Household Income) % Adult Literacy
Sample within: 12.5 km from Border
Treatment 0.09 11.7
(0.10) (7.3)
[0.08] [5.9]*
Observations 109 109
Sample within: 10 km from Border
Treatment 0.15 12.7
(0.12) (8.1)
[0.10] [7.4]*
Observations 93 93
Sample within: 7.5 km from Border
Treatment 0.15 11.3
(0.11) (8.9)
[0.10] [8.2]
Observations 76 76
Geo. Controls Yes Yes
Border FE Yes Yes
Municipality cluster Yes Yes
Note: Standard errors clustered at the municipality level and according to Conley are in parentheses and brackets, respectively. *, ** and *** indicate signiĄcance at the 10%, 5% and 1% level, respectively.
53
Table 12 Ű Development Outcomes II - Alternative SpeciĄcations
Light Density
No polynomial
Dependent variable: Log(1 + Luminosity) Luminosity Dummy
Sample within: 12.5 km from Border
Treatment 0.17 0.036
(0.13) (0.027)
[0.03]*** [0.005]***
Observations 8057 8057
Sample within: 10 km from Border
Treatment 0.18 0.038
(0.14) (0.027)
[0.03]*** [0.006]***
Observations 6529 6529
Sample within: 7.5 km from Border
Treatment 0.18 0.036
(0.16) (0.031)
[0.03]*** [0.007]***
Observations 4904 4904
Geo. Controls Yes Yes
Border FE Yes Yes
Municipality cluster Yes Yes
Note: Standard errors clustered at the municipality level and according to Conley are in parentheses and brackets, respectively. *, ** and *** indicate signiĄcance at the 10%, 5% and 1% level, respectively.
54
Table 13 Ű Contemporary Infrastructure Provision - Alternative SpeciĄcations
Road Density (m per sq. km) 2010 Data
Polynomial No
Sample within: 12.5 km from Border
Treatment 63.1
(11.3)*** [7.4]*** Observations 8057
Sample within: 10 km from Border
Treatment 62.1
(10.7)*** [8.4]*** Observations 6529
Sample within: 7.5 km from Border
Treatment 57.5
(8.4)*** [9.3]*** Observations 4904 Geo. Controls Yes
Border FE Yes
Municipality cluster Yes
Note: Standard errors clustered at the municipality level and according to Conley are in parentheses and brackets, respectively. *, ** and *** indicate signiĄcance at the 10%, 5% and 1% level, respectively.
55
56
57
58