Abstract—With the rapid development of information and communication technology and the well constructed wireless network environment, mobile shopping has been one of critical consumer behaviors in e-commerce. In previous works, researchers have developed lots of dimensions or models to measure the service quality of mobile shopping. However, they did not identify the key factors for increasing customer loyalty. Besides, traditional feature selection methods need domain knowledge which is hard to be obtained from experts to assist them to select important features. Therefore, this work aims to propose a new method called IS-DT method which combined I-S model and decision tree to extract useful factors in mobile shopping for improving loyalty. Finally, an actual case will be provided to illustrate the effectiveness of our proposed method.
Index Terms—Feature Selection, Mobile Shopping, Customer Royalty, Decision Tree, Importance-Satisfaction Model
I. INTRODUCTION
In recent years, with the rapid development of information and communication technology, popularization of mobile devices, and the well constructed environment of wireless network, mobile commerce (M-commerce) has been one of critical consumer behaviors in the internet. People can use mobile devices to complete business transactions anywhere and anytime. In M-commerce, there are lots of successful application domains such as mobile bank [1, 2, 3], ticket purchase [4], mobile payment [5], mobile learning [6], mobile games [7], and mobile shopping (M-shopping) [8, 9, 10, 11]. Among them, mobile shopping has been viewed as one of critical markets that have very high potentials of growth.
Due to the increasing shopping behaviors, M-shopping customers expected to high level of service quality. Lu et al. [13] thought mobile service providers do not only provide services, but also focus on improving the service quality. Therefore, researchers have paid attentions on service quality of M-shopping. They modified conventional SERVQUAL to make PZB model suitable for measuring the M-shopping service quality [2, 13, 14, 15]. Several models have been
Manuscript received December 30, 2011. This work was supported in part by the National Science Council of Taiwan, R.O.C.
*L.-S. Chen is an associate professor with the Department of Information Management, Chaoyang University of Technology, Taichung 41349, Taiwan (phone: 886-4-23323000ext7752; fax: 886-4-23304902; e-mail: [email protected]).
Y.-Y. Yang is a graduate student of Department of Information Management, Chaoyang University of Technology, Taichung 41349, Taiwan (e-mail: [email protected]).
developed to completely measure all dimensions of M-shopping service quality. However, these works did not focus on identifying the key factors for increasing customer loyalty. Royal customers are always the major source of profit margin.
Besides, feature selection methods aim to identify relevant attributes. In general, feature selection technique could be considered as a data pre-process step and it has been widely used to reduce dimensionality of data, to decrease computational cost, and to remove irrelevant attributes and noise for improving classification performance [26]. Basically, results of feature selection need domain knowledge which is hard to be obtained from experts to assist us to select important features.
Therefore, this work aims to propose a new method called IS-DT method which combined I-S model and decision tree to extract useful factors in mobile shopping for improving loyalty of customers. Finally, an actual case will be provided to illustrate the effectiveness of our proposed method.
II. RELATED WORKS
A. Service Quality Factors in Mobile Shopping
This study aims to select important attributes for increasing royalty of customers. Therefore, we attempt to build a factor set by surveying all related works. In fact, according to the available literatures, the works regarding service quality factors of M-commerce can be divided into three groups. They are analyzing customer intentions, literature induction, and the process of mobile shopping.
The works in the first group aim to discover customers’ purchase intentions and behaviors by using Technology Acceptance Model (TAM). For examples, Lu and Su [9] used TAM and find the important factors are mobile skillfulness, anxiety, enjoyment, usefulness, and compatibility. Kuo and Yen [12] utilized the TAM incorporated personal innovativeness and perceived cost to recognize consumers’ behavioral intention to use mobile value added services. They found personal innovativeness, perceived usefulness, perceived ease of use, perceived cost, and attitude are crucial factors. In 2011, Carlson and O’Cass [17] aimed to build theoretical frameworks of e-service quality. They focused on e-service quality and whether elements of e-service quality should be viewed by dimensions, as antecedents to a global evaluation of e-service quality, or as a formative configuration to predict behavioral intentions. The factors listed in their model are graphic quality, clarity of layout, attractiveness of selection, information quality, ease-of-use, technical quality, reliability, functional benefit, emotional benefit, global e-service quality, and customer satisfaction.
Identifying Key Factors for Increasing Royalty
of Customers in Mobile Shopping Services
The works in the second group inducted dimensions of e-service from literature review. For instances, Su et al. [18] summarized 29 e-service quality factors of electronic commerce from couples of related works. Lu et al. [13] modified SERVQUAL model to build a multidimensional and hierarchical model of mobile service quality. Their model includes three dimensions. They dimensions and its sub-dimensions are interaction quality (attitude, expertise, problem solving, information), environment quality (equipment, design, situation), and outcome quality (punctuality, tangibles, valence). Ladhari [19] first reviewed literatures regarding e-service quality and reported various scales for measuring e-service quality. The work of Ladhari aimed to summarize the methodological issues related to the development of e-service quality scales and to discuss the dimensionality of the e-service quality. They found the most common used factors are reliability/fulfillment, responsiveness, web design, ease of use/usability, privacy/security, and information quality/benefit. Ding et al. [20] presented e-SELFQUAL to examine the quality of online self-services in e-retailing. Their e-SELFQUAL can be used to examine the relationships between online service quality and customer satisfaction, as well as loyalty in e-retailing.
In the third group, researchers focus on the demand of service quality in the process of online transactions. For examples, Bauer et al. [21] developed a transaction process-based scale for measuring service quality. They recognized five discriminant quality dimensions involving functionality/design, enjoyment, process, reliability and responsiveness. In 2007, Heim and Field [22] examined relationships between e-service process attributes and e-service quality factors. They attempted to identify potential drivers of e-service quality which managers could utilize to improve their operations. They confirmed that the major dimensions for influencing e-service quality are website design, reliability, security/privacy, and customer services.
B. Feature selection
Feature selection can be considered as choosing a subset of features that can result in a highest classification performance [27]. A number of soft computing approaches, such as neural networks [28], genetic algorithms (GA) [29], decision tree [30], rough sets [31], and correlation analysis [30] have been widely used to remove irrelevant, unnecessary, and redundant attributes. However, when applying these feature selection to real world, we need to consider computational cost and complexity.
On the other hand, decision trees are very popular methods and they have been widely applied to real world. Therefore, for the purpose of being easy used, decision tree (DT) based feature selection method have been employed to implement feature selection task in this work. A common understanding is that some learning algorithms have built-in feature selections such as decision trees [32]. When decision tree induction is used for feature selection, a tree is constructed from the given data. All attributes that don’t appear in the tree are assumed to be irrelevant. The set of attributes appearing in the tree form the reduced subset of attributes [33].
Although the effectiveness of feature selection methods have been proved in lots of published works, they still have
some problems needed to be tackled. Traditional feature selection techniques select relevant attributes based on the assumption of maximizing the overall classification accuracy. Thus, the extracted attributes are crucial for classifying data, but not always are meaningful for practice. In other words, we need domain knowledge to assist us to pick crucial factors. Therefore, the proposed IS-DT method introduces domain knowledge by integrating Importance-Satisfaction (IS) analysis to conventional data driven feature selection techniques.
C. Importance-Satisfaction Model
Importance-Performance Analysis (IPA) developed by Martilla and James [23]. The major advantages of IPA are low cost and easy to be used. According to levels of importance and perceived performance, IPA can categorize a specific service into four areas; (1) keep up the good work, (2) concentrate here, (3) low priority, and (4) possible over-skill. Yang [34] defined the performance of IPA as satisfaction, and presented Importance-Performance model (I-S model) shown as Figure 1. In I-S model, the means of the degree of importance and the satisfaction level could be employed to categorize the coordinate into four zones given as follows.
(I)Excellent zone
The quality factors located in this zone are those that customers viewed as important, and for which the performance is satisfactory. We should continue these factors to retain loyal customers.
(II)To be improved zone
The quality elements located in this zone are those that considered as important, but they don’t satisfy our customers. Therefore, we need to improve these factors immediately.
(III) Surplus zone
Customers think the attributes listed in this zone are not very important, but they are quite satisfactory. The company should relocate resources from these factors to other important attributes, for example, the attributes in “to be improved zone”.
(IV) Care-free zone
Customers don’t this the quality attributes listed in this zone are important. In addition, they also have a low satisfaction level. Thus, we do not need to worry about these attributes.
III. PROPOSED METHODOLOGY
The implemental procedure of the proposed IS-DT methodology in this study can be illustrated as Figure 1. It contains 8 steps and they are defining service quality factors of mobile shopping, designing and modifying questionnaire, collecting data, customer needs analysis (I-S model), feature selection, synthetic analysis, and identifying crucial quality factors and drawing conclusions. The details of this procedure have been given as bellow.
In step 2, every defined factor will expand to a pair of questions to survey the perceived satisfaction and importance.
Step 3: Modify the questionnaire
The designed questionnaire will be given for a small group of customers. And, based on their responses, we can modify the I-S questionnaire.
Figure 1 Implemental procedure of the proposed methodology
Step 4: Collect data
In step 3, we attempt to collect some representative data by sampling. Those who have some experiences of mobile shopping will been required to respond our questionnaire. Step 5: Customer needs analysis (I-S model)
There are four sub-steps for implementing I-S analysis in this step. The purpose of this step is to analyze the collected data by applying I-S analysis. The results of IS analysis can tell us the quality factors belong to which area. In this study, we try to use the results of I-S analysis to be our domain knowledge for assisting us to select important attributes. These sub-steps are listed as follows.
Step 5.1: Compute mean values of importance and satisfaction for individual quality factor.
Step 5.2: Compute overall mean values of importance and satisfaction.
Step 5.3: Categorize quality factors in I-S model.
Step 5.4: Give scores for different I-S category. The corresponding scores and its I-S category have been provided as follows.
I-S category Score Excellent zone 4 To be improved zone 3 Surplus zone 2 Care-free zone 1
Step 6: Build decision tree
Step 6.1: Use 5-fold cross validation experiment and construct a decision tree for each fold of data. Step 6.2: Compute the occurrence frequency of features in
nodes.
Step 6.3: Pick a tree whose performance is the best and rank features by its attribute usage.
Step 6.4: Give scores. The corresponding scores and its intervals of attribute usage have been provided as follows.
Attribute usage Score
75%~100% 4 50%~75% 3 25%~50% 2 0%~25% 1 Step 7: Feature selection
In this step, the score of I-S category multiplied by the score of DT attribute usage is our base for feature selection.
Step 8: Draw a conclusion
Finally, we can draw conclusions based on the results of steps 5~7.
IV. EXPERIMENT RESULT
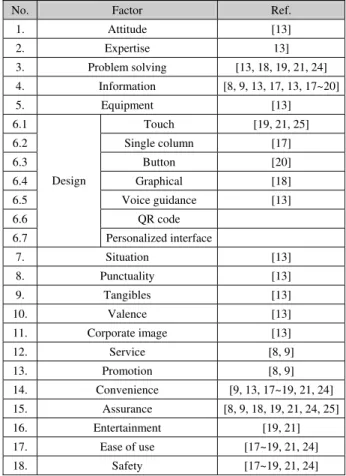
Table 1 The defined service quality factors of mobile shopping
No. Factor Ref.
1. Attitude [13]
2. Expertise 13]
3. Problem solving [13, 18, 19, 21, 24] 4. Information [8, 9, 13, 17, 13, 17~20]
5. Equipment [13]
6.1 Touch [19, 21, 25]
6.2 Single column [17]
6.3 Button [20]
6.4 Graphical [18]
6.5 Voice guidance [13]
6.6 QR code
6.7
Design
Personalized interface
7. Situation [13]
8. Punctuality [13]
9. Tangibles [13]
10. Valence [13]
11. Corporate image [13]
12. Service [8, 9]
13. Promotion [8, 9]
14. Convenience [9, 13, 17~19, 21, 24] 15. Assurance [8, 9, 18, 19, 21, 24, 25]
16. Entertainment [19, 21]
17. Ease of use [17~19, 21, 24]
18. Safety [17~19, 21, 24]
A. Service quality factors of mobile shopping
After reviewing couples of related works, we combined all mentioned service quality factors and then define 20 service 1. Define service quality
elements of mobile shopping
2. Design questionnaire
3. Modify questionnaire
6. Construct decision tree
7. Feature selection 4. Collect data
5. I-S analysis
quality factors for further analysis. Table 1 provides a summary of these defined factors and its support references. In design factor, we divide this factor into several sub-factors according to the uniqueness of mobile shopping.
B. The Results
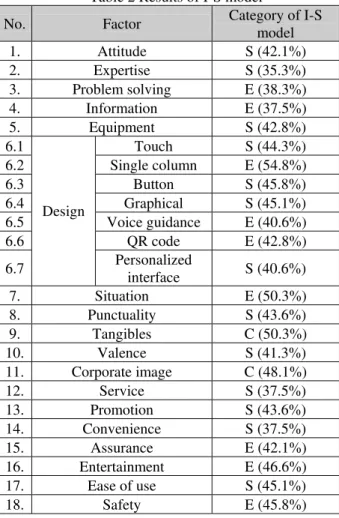
We collected data from August to September, 2011. 250 questionnaires have been returned. And 100 of them are valid. Then, we implement I-S analysis. Results can be found in Table 2. In this table, 9 service quality factors, including Problem solving, Information, Single column, Voice guidance, QR code, Situation, Assurance, Entertainment, and Safety have been considered as excellent. Customers think these factors are important and they are satisfied for their performances. We should continue these factors to retain loyal customers.
And 13 factors such as Attitude, Expertise, Equipment, Touch, Button, Graphical, Personalized interface, Punctuality, Valence, Service, Promotion, Convenience, and Ease of use have viewed as surplus. Customers do not think these factors are very important, but they are quite satisfactory. The company should relocate resources from these factors to other important attributes. In addition, other factors are care free.
Table 2 Results of I-S model
No. Factor Category of I-S
model
1. Attitude S (42.1%)
2. Expertise S (35.3%)
3. Problem solving E (38.3%)
4. Information E (37.5%)
5. Equipment S (42.8%)
6.1 Touch S (44.3%)
6.2 Single column E (54.8%)
6.3 Button S (45.8%)
6.4 Graphical S (45.1%)
6.5 Voice guidance E (40.6%)
6.6 QR code E (42.8%)
6.7
Design
Personalized
interface S (40.6%)
7. Situation E (50.3%)
8. Punctuality S (43.6%)
9. Tangibles C (50.3%)
10. Valence S (41.3%)
11. Corporate image C (48.1%)
12. Service S (37.5%)
13. Promotion S (43.6%)
14. Convenience S (37.5%)
15. Assurance E (42.1%)
16. Entertainment E (46.6%)
17. Ease of use S (45.1%)
18. Safety E (45.8%)
Next, we implement five fold cross validation experiment to the collected for constructing decision trees. Table 3 listed all results of these five folds. Among them, fold 3 has the best performance. And this tree has been selected for feature selection.
Table 3 Results of five fold cross validation experiments Experiment Fold 1 Fold 2 Fold 3 Fold 4 Fold 5
Overall
accuracy 44.40% 48.10% 59.30% 53.80% 53.80% All attributes that appear in the tree are assumed to be relevant. Table 4 listed the set of attributes appearing in the tree. According to the attribute usage of every feature, we can rank these selected features.
Table 4 The selected factors by decision tree
Rank Factor Attribute usage
1 2 Expertise 100%
2 9 Tangibles 100%
3 4 Information 47%
4 15 Assurance 47%
5 1 Attitude 33%
6 6.6 QR code 25%
7 16 Entertainment 25%
Table 5 provides the summary of our IS-DT model. All factors whose score multiplications are above mean value will be selected. Therefore, we selected 12 important factors for improving customer royalty. They are Attitude, Expertise, Problem solving, Information, Single column, Voice guidance, QR code, Situation, Tangibles, Assurance, Entertainment, and Safety.
Table 5 Results of IS-DT feature selection method No. I-S Score DT Score Multiplicatio
n Selection
1. S 2 33% 2 4 ◎
2. S 2 100% 4 8 ◎
3. E 4 0% 1 4 ◎
4. E 4 47% 2 8 ◎
5. S 2 0% 1 2
6.1 S 2 0% 1 2
6.2 E 4 0% 1 4 ◎
6.3 S 2 0% 1 2
6.4 S 2 0% 1 2
6.5 E 4 0% 1 4 ◎
6.6 E 4 25% 2 8 ◎
6.7 S 2 0% 1 2
7. E 4 0% 1 4 ◎
8. S 2 0% 1 2
9. C 1 100% 4 4 ◎
10. S 2 0% 1 2
11. C 1 0% 1 1
12. S 2 0% 1 2
13. S 2 0% 1 2
14. S 2 0% 1 2
15. E 4 47% 2 8 ◎
16. E 4 25% 2 8 ◎
17. S 2 0% 1 2
V. CONCLUSIONS
This study aims to propose a new IS-DT feature selection method to identify critical service quality factors for customer royalty in mobile shopping. Our model not only can identify important factors of mobile shopping, but also integrate domain knowledge during the process of selecting important attributes. Experimental results indicate that we can efficiently recognize unique service quality factors in mobile shopping.
In our research, Attitude, Expertise, Problem solving, Information, Single column, Voice guidance, QR code, Situation, Tangibles, Assurance, Entertainment, and Safety have been identified as important features. It’s especially true for some unique functions or settings for mobile devices, for examples, situation, entertainment and design factors including Single column, Voice guidance, QR code. They can directly influence customer royalty. In addition, safety and entertainment are also critical factors. Others general factors such as Attitude, Expertise, Problem solving, Information, Tangibles, Assurance are considered as fundamental factors for e-service. To discover the relationship between service quality factors might be a potential direction of future works in mobile shopping.
REFERENCES
[1] V. Ratten, “Mobile banking innovations and entrepreneurial adoption decisions,” International Journal of E-Entrepreneurship and Innovation, vol. 2, no. 2, pp. 27-38, 2011.
[2] T. Zhou, “Examining the critical success factors of mobile website adoption,” Online Information Review, vol. 35, no. 4, pp. 636-652, 2011.
[3] S. Alkibsi, and M. Lind, “Service quality dimensions within technology-based banking services,” International Journal of Strategic
Information Technology and Applications, vol. 2, no. 3, pp. 36-83,
2011.
[4] Y. S. Wang, and Y. W. Liao, “Understanding individual adoption of mobile booking service: An empirical investigation,” CyberPsychology & Behavior, vol. 11, no. 5, pp. 603-605, 2008. [5] X. Chen, “The applications of mobile payment,” Communications in
Computer and Information Science, vol. 66, no. 10, pp. 62-67, 2010.
[6] N. F. Al-Mushasha, and S. Hassan, “A Model for Mobile Learning Service Quality in University Environment,” International Journal of
Mobile Computing and Multimedia, vol. 1, no. 1, pp. 70-91, 2009.
[7] Y. Liu, and H. Li, “Exploring the impact of use context on mobile hedonic services adoption: An empirical study on mobile gaming in China,” Computers in Human Behavior, vol. 27, no. 2, pp. 890-898, 2011.
[8] J. H. Wu, and Y. M. Wang, “Development of a tool for selecting mobile shopping site: A customer perspective,” Electronic Commerce
Research and Applications, vol. 5, no. 3, pp. 192-200, 2006.
[9] H. P. Lu, and Y. J. Su, “Factors affecting purchase intention on mobile shopping web sites,” Internet Research, vol. 19, no. 4, pp. 442-458, 2009.
[10] J. Aldás-Manzano, C. Ruiz-Mafé, and S. Sanz-Blas, “Exploring individual personality factors as drivers of m-shopping acceptance,”
Industrial Management & Data Systems, vol. 109, no. 6, pp. 739-757,
2009.
[11] C. T. Lin, W. C. Hong, Y. F. Chen, and Y. Dong, “Application of salesman-like recommendation system in 3G mobile phone online shopping decision support,” Expert Systems with Applications, vol. 37, no. 4, pp. 8065-8078, 2010.
[12] Y. F. Kuo, and S. N. Yen, “Towards an understanding of the behavioral intention to use 3G mobile value-added services,” Computers in
Human Behavior, vol. 25, no. 1, pp. 103-110, 2009.
[13] Y. Lu, L. Zhang, and B. Wang, “A multidimensional and hierarchical model of mobile service quality,” Electronic Commerce Research and Applications, vol. 8, no. 5, pp. 228-240, 2009.
[14] H. Chang, and S. Chen, “The impact of customer interface quality, satisfaction and switching costs on e-loyalty: Internet experience as a
moderator,” Computers in Human Behavior, vol. 24, no. 6, pp. 2927-2944, 2008.
[15] Z. Deng, Y. Lu, K. K. Wei, and J. Zhang, “Understanding customer satisfaction and loyalty: An empirical study of mobileinstant messages in China,” International Journal of Information Management, vol. 30, no. 4, pp. 289-300, 2010.
[16] T. S. Li, “Feature selection for classification by using a GA-based neural network approach,” Journal of the Chinese Institute of Industrial Engineers, vol. 23, no. 1, pp. 55-64, 2006.
[17] J. Carlson, and A. O'Cass, “Developing a framework for understanding e-service quality, its antecedents, consequences, and mediators,” Managing Service Quality, vol. 21, no. 3, pp. 264-286, 2011. [18] C. T. Su, C. S. Lin, and T. L. Chiang, “Systematic improvement in
service quality through TRIZ methodology: An exploratory study,” Total Quality Management, vol. 19, no. 3, pp. 223-243, 2008. [19] R. Ladhari, “Developing e-service quality scales: A literature review,”
Journal of Retailing and Consumer Services, vol. 17, no. 6, pp. 464-477, 2010.
[20] X. Ding, P. Hu, and O. Sheng, “e-SELFQUAL: A scale for measuring online self-service quality,” Journal of Business Research, vol. 64, no. 5, pp. 508-515, 2011.
[21] H. H. Bauer, T. Falk, and M. Hammerschmidt, “ETransQual: A transaction process-based approach for capturing service quality in online shopping,” Journal of Business Research, vol. 59, no. 7, pp. 866-875, 2006.
[22] R. G. Heim, and M. J. Field, “Process drivers of e-service quality: Analysis of data from an online rating site,” Journal of Operations Management, vol. 25, no. 5, pp. 962-984, 2007.
[23] J. A. Martila, and J. C. James, “Importance-performance analysis,” Journal of Marketing, vol. 2, no. 1, pp. 77-79, 1977.
[24] A. Parasuraman, V. A. Zeithaml, and A. Malhotra, “E-S-Qual: A multiple-item scale for assessing electronic service quality,” Journal of
Service Research, vol. 7, no. 3, pp. 213-233, 2005.
[25] R. Gregory, and M. Joy, “Process drivers of e-service quality: Analysis of data from an online rating site,” Journal of Operations Management, vol. 25, no. 5, pp. 962-984, 2007.
[26] B. Li, S. Xu, and J. Zhang, “Enhancing clustering blog documents by utilizing author/reader comments,” In Proceedings of the 45th Annual Southeast Regional Conference, 2007
[27] J. Gomez-Sanchis, L. Gomez-Chova, N. Aleixos, G. Camps-Valls, and C. Montesinos-Herrero, “Hyperspectral system for early detection of rottenness caused by Penicillium digitatum in mandarins,” Journal of
Food Engineering, vol. 89, no. 1, pp. 80-86, 2008.
[28] C. T. Su, J. H. Hsu, and C. H. Tsai, “Knowledge mining from trained neural network,” Journal of Computer Information Systems, pp. 61-70, 2002.
[29] F. Zhu, and S. Guan, “Feature selection for modular GA-based classification,” Applied Soft Computing, vol. 4, no. 4, pp. 381-393, 2004.
[30] K. Y. Chen, L. S. Chen, M. C. Chen, and C. L. Lee, “Using SVM based method for equipment fault detection in a thermal power plant,”
Computers in Industry, vol. 62, no. 1, pp. 42-50, 2011.
[31] R. W. Swiniarski, and L. Hargis, “Rough sets as a front end of neural-networks texture classifiers,” Neurocomputing, vol. 36, no. 1, pp. 85-102, 2001.
[32] J. R. Quinlan, “C4.5: Programs for machine learning,” Morgan-Kaufmann, San Francisco, 1993.
[33] J. Han, and M. Kamber, “Data mining: Concepts and techniques,” Academic Press, San Diego, 2001.
[34] C. C. Yang, “The refined Kano’s model and its applications,” Total