DRIVERS OF KNO
WLEDGE ECONOMY IN THE EU’S
DEVELOPING COUNTRIES
Burja Vasile
Professor Ph.D., e-mail: vasileburja@yahoo.com
Burja Camelia
Associate Professor Ph. D., e-mail: cameliaburja@yahoo.com
University „ 1 Decembrie 1918” of Alba Iulia
Abstract
The new EU Member States have made important efforts to achieve an economic growth based on accumulation of knowledge according with principles and realities of developed countries. After accession, Romania has initiated an extensive restructuring process in entire society. The main purpose of this study is to
appreciate the knowledge based economy’s features in Romania, comparative to other countries which joined
later the EU. In this respect, the study aimed to evaluate the state of knowledge economy depending by a group of elements which refer to the following areas: innovation system, education and ICT. The research methodology was based on the econometric analysis of a representative panel data for the twelve new member states of the EU. Results highlight that for the analyzed countries, education system and the R&D activity had positively affected the economic growth, but the education factors had a stronger impact on the knowledge economy dynamics
Key words: knowledge economy, economic growth, education, regression analysis.
JEL Classification: D83, I25, O15
1. Introduction
Europe 2020 strategy suggests a new economic development vision, based on smart, sustainable and inclusive growth. First of the three priority objectives of the strategy aims thedeveloping an economy based on knowledge and innovation (EC 2010). Achieving this objective involves the development of the innovation
process, improving the education system and the digital society’s implementation.
The development processes based on knowledge and innovation are specific to the advanced countries, but a real economic convergence and social inclusion will not be achieved only if all countries promote suitable politics and strategies, based on use of the human capital as efficiently as possible (World Bank, 2007).
World Bank has presented since 1995, a ranking of the world’s countries classified by their capacity to
generate and manage the knowledge, this way proving the available potential of each country to build, maintain or develop a Knowledge based economy (KE). According to the 2012 situation, from the new joined countries to the EU, only Estonia, Czech Republic, Hungary and Slovenia are better prepared for the transition to knowledge based economy, while Romania and Bulgaria recorded reduced performances in this direction (World Bank, 2012).
This research seeks to identify the relevance and the time manifestation of the specific processes of knowledge economy in the new joined countries to the EU, including Romania. In order to achieve this objective, there were used econometric modelling techniques. Investigation undertaken resulted in two models of analysis which express the interacting relationship between economic growth and some specific elements of the knowledge and innovation processes. The exogenous variables identified as statistical significant for the econometric models, express the drivers which can play a key role in knowledge economy implementation and social progress. The usefulness of the research consists in that it identifies and evaluates the key factors of economic development which have to be aimed by the decision makers in Romania and in the other EU new Member States, in order that the worldwide vision of KE to become a reality across Europe. The analysis model proposed in the paper contributes to the economic theory and practice enhancement in the area of the performance analysis of some economic-social systems, in order to evolve to a higher level of development.
The paper contains five sections. The paper contains five sections. The following section includes the
presentation of the theoretical framework which motivates the empirical investigation of the KE in the EU’s new
2. Literature review
The new vision of Europe’s economic growth proposed a dynamic and incentive development
framework for all the EU countries, in which the knowledge become a vital force for development (Fattahi and Barkhordari, 2012).
The modern economic theories grant an important role to human capital in order to explain the economic development of the countries. The high qualified labour force facilitates the usage of the high productivity technologies, so that, it results the acceleration of the economic growth of a country (Acemoglu and Zilibotti, 2001). The human capital investment in KE is a key source that is why education is considered the
pathway to increase the population’s general quality and training of a segment of skilled labour force, able to
promote new ideas and to develop the knowledge. A recent economic research revealed that in the open economies, there are more interconnections and the economic development is affected both by the knowledge stock, and by the technology stock provided by the foreign direct investment and international trade (Sonmez and Sener, 2009).
Other studies evaluated the development level of KE by using some indicators which take in consideration elements such as: property rights, political institutions, trade freedoms, competitiveness, entrepreneurship, government effectiveness etc (Watkins, 2008), or R&D expenditure from abroad, youth educational attainment levels and investments in ICT (Karagiannis, 2007).
Relatively recent studies concerning the situation of KE in USA put in evidence that knowledge
creation’s specific elements are knowledge, innovation and entrepreneurship (Camp, 2005) and they used the KE
indexes to measure the performance. These indexes are build based on some indicators such as, workforce education, industry R&D and fast growth firms (Watkins, 2008).
Another possibility of appreciating the development level of a country in KE terms is based on a methodology developed by the World Bank. According to this methodology, it is considered that Knowledge Economy is essentially related to modality of knowledge creation and application, so that the transition of the countries to this economy depends on the progresses made in the following directions: improving the economical
and institutional regime, stimulating the research and innovation, improving educational system’s performances,
developing the Information and Communication Technology (World Bank, 2008). These are considered pillars of the knowledge economy contributing to increase the quality of labour force, development of innovative processes, growing the competitiveness and the economic efficiency in conditions of decreasing the negative consequences on environment and society.
Many indicators which characterize KE pillars are synthesised in an aggregate indicator known as Knowledge Economy Index (KEI). KEI measures the performance recorded by a country in education, innovation system, ICT and economic and institutional regime. Another indicator used to evaluate the KE is Knowledge Index (KI), which takes into account only the first three pillars.
3. Theoretical framework
3.1. Data and analysis methodology
The main objective of this paper aims at analysing the transition of Romania to knowledge economy in the last decade, in comparison with the countries which joined to the EU in the 2004 and 2007. In order to accomplish this objective, the paper tries to give answers to certain questions such as: What are the significant factors which can stimulate the development of the EU new Members States to Knowledge Economy? Does this pattern specific of economic growth in the developed countries manifest in the other countries of EU? What is the state of Knowledge Economy in Romania?
The first requirement is to identify the key factors related to the KE and possibilities to measure their impact. In this paper, the identification of key factors needed in the analysis of the KE for the EU new countries, was made based on the researches in the field and the directions of performance evaluation for the KE,
established by World Bank’s methodology (2007).
The determinant factors were selected from the elements related with knowledge and innovation
processes for which the EU’s database contains information for longer periods of time, and also it was used information concerning the education’s quality, reported by the United Nations (UNDP).
In order to express the functional form of the relationship between Knowledge Economy and its determinant factors, it was used the regression analysis applied to a data panel made from Czech Republic, Estonia, Cyprus, Latvia, Lithuania, Hungary, Malta, Poland, Slovenia, Slovakia, Bulgaria and Romania -, for which information regarding the period 2000 – 2011 was recorded. The study uses ordinary lest square approach to conduct the analysis.
The indicator used for monitoring the development stage of KE for the new member countries of EU is
“Gross Domestic Product per capita”. This indicator evaluates the performance recorded by a society in its
to the price differentials and obtaining some results which aren’t affected by the differing price levels of countries.
The relationship between knowledge dynamics and the economic-social systems of the national economies can be expresses with a large range of variables which facilitate production, diffusion and use of knowledge (Affortunato et al., 2010). From the numerous specific aspects of the KE, were selected a smaller number of indicators in order to avoid the collinearity between variables. They have a statistical significance for the phenomenon studied and aim at domains such as innovation system, education and ICT; they are the independent variables which are used in analysis model for the knowledge economy (Eurostat).
The impact of innovative processes on the variation of the economic growth of the 12 countries was studied using a group of indicators from the theme Science, technology and innovation of the European
Commission database. By these, the indicator “Gross Domestic Expenditure on R&D by all sectors” (GERD)
was identified as being significant. The financing of the R&D can be made from many sources such as, industry, government, education, private non-profit sector and from abroad. Financing research and development by the business enterprise sector should prevail. There are some other variables to illustrate the innovation environment,
namely: “Venture capital investments”, “High-tech exports”, “Employment in knowledge-intensive service
sectors”,“Patents”, “Human resources in science and technology”. But some of these variables have incomplete
data series for the period of analysis in ones of the countries, or they are not statistically significant.
The influence of the education system on KE was tested using the following variables: “Education index” calculated by United Nations and ranging between 0 and 1, with a maximum level of education’s quality for 1 (UNDP); “Tertiary educational attainment” indicator which is used to express the size of population with
higher qualification who can contribute to the development of knowledge; “Graduates (ISCED 5-6) in maths,
science and technology fields”; “Graduates (ISCED 5-6) in science, mathematics and computing field”.
Regarding the importance of ICT for the Knowledge Economy’s progress, this is obvious, but the data
series concerning the indicators specific for this domain offer information only for short periods of time, so they could not be used in this analysis.
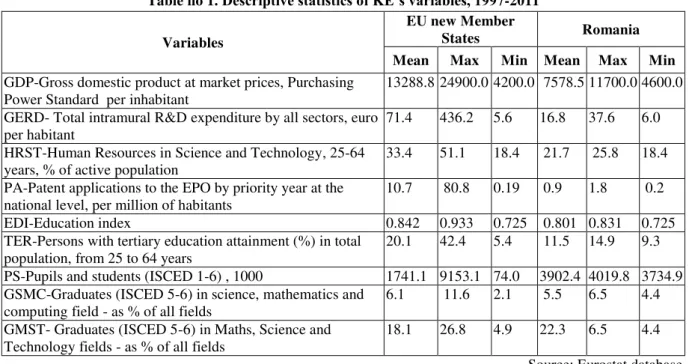
Table no 1. Descriptive statistics of KE’s variables, 1997-2011
Variables
EU new Member
States Romania
Mean Max Min Mean Max Min
GDP-Gross domestic product at market prices, Purchasing Power Standard per inhabitant
13288.8 24900.0 4200.0 7578.5 11700.0 4600.0
GERD- Total intramural R&D expenditure by all sectors, euro per habitant
71.4 436.2 5.6 16.8 37.6 6.0
HRST-Human Resources in Science and Technology, 25-64 years, % of active population
33.4 51.1 18.4 21.7 25.8 18.4
PA-Patent applications to the EPO by priority year at the national level, per million of habitants
10.7 80.8 0.19 0.9 1.8 0.2
EDI-Education index 0.842 0.933 0.725 0.801 0.831 0.725 TER-Persons with tertiary education attainment (%) in total
population, from 25 to 64 years
20.1 42.4 5.4 11.5 14.9 9.3
PS-Pupils and students (ISCED 1-6) , 1000 1741.1 9153.1 74.0 3902.4 4019.8 3734.9 GSMC-Graduates (ISCED 5-6) in science, mathematics and
computing field - as % of all fields
6.1 11.6 2.1 5.5 6.5 4.4
GMST- Graduates (ISCED 5-6) in Maths, Science and Technology fields - as % of all fields
18.1 26.8 4.9 22.3 6.5 4.4
Source: Eurostat database
The data presented in Table 1 allow the evaluation of Romania’s position based on the specific KE indicators, within countries that had recently joined to the EU.
Between 1997 and 2011, Romania recorded a relative reduce economic development, having an average level of GDP by 7578 PPS per inhabitant, which is 1.7 times smaller than the average indicator in the new Member States.
In the field of research, development and innovation, it can be mention the very low level of research and development expenses, with an average level of 16.8 euro per inhabitant (over 4 times lower than the average level of GERD in the new Member States) and the very small number of patent applications, about 11 times lower than the average level of the same indicator in the analyzed countries.
The educational system has also some limits, but the differences comparative to the other countries are
2010 and 2011 and a minimum level of 0.725 in 2000, which highlights a positive trend of education’s quality.
But in all the years, “Education index” is smaller than its average level on the group of countries (0.842).
Although in Romania the average number of pupils and students was 2.2 times bigger in comparison with the mean indicator of the new Member States, Romania benefits of a smaller share of persons with tertiary education and graduates in mathematics, science, computing and especially, in technology fields.
On this basis, it was found that during the analyzed period, Romania had a less favourable situation for some of the main indicators of innovation and knowledge processes in comparison with the other countries. But at the national level, it recorded a significant progress of economic and social development. Most of the analyzed
indicators had high dynamics which however weren’t enough to reduce the development gaps against the other
countries.
3.2. Model specification
The analysis method used in order to establish the link between KE’s specific variables and economic
development of the new Member States is econometrical modelling, through which is specified the general regression function having the following form:
it
e
it
X
n
b
it
X
b
it
X
b
a
it
Y
1
2
...
(1)in which: Yit is the dependent variable through which is measured the general performance of a country’s
economy;
a - equation’s intercept;
Xit - independent variables which expresses various aspects of knowledge economy;
b1,b2…bn - regression coefficients;
eit - error term;
işi t - cross-section dimension and period of time.
By using some relevant variables for the KE indicators, resulted the following econometric models which will be used in the regression analysis:
M1:
GDP
it
a
b
1
GERD
it
b
2
EDI
it
b
3
TER
it
e
it
(2)M2:
GDP
it
a
b
1
GERD
it
b
2
PA
it
b
3
TER
it
GMST
it
e
it
(3)in which: GDP is Gross Domestic Product per capita;
GERD - Total intramural R&D expenditure by all sectors; EDI - Education index;
TER - Persons with tertiary education attainment; PA - Patent applications to the EPO;
GMST - Graduates in Math, science and technology.
The estimates are referring to the group of the 12 countries which joined later to the EU for the period 2000-2011 using the Pooled Least Squares method with cross-section fixed effects. Using the fixed effect specification in regression we can identify the effects of determinant factors of KE which are specific in each country and are constant over time. The estimates made have robust coefficient standard errors (White cross-section and covariance technique).
The quality of estimates was verified using some specific statistical tests. In all situations that have been studied, the value of F statistic is higher than F critical value (p value 0), which shows that the regression models are relevant for the analyzed phenomenon. Also, the Durbin-Watson statistic around 2, proves the validity of the models because the residuals are not autocorrelated.
A test which has been used in order to verify the stationarity of residual variables was the unit root test. The results obtained show that residuals of the analyzed group of countries are stationary.
The econometric analysis made in order to verify the quality of data and of regression functions that were used highlights that regression models have a good explanatory power regarding the link between Knowledge economy of the EU new Member States and some characteristic elements of the R&D and education systems.
4
.
Estimation results and discussions - The determinant factors of knowledge economy
The empirical observations for the selected countries highlight the existence of some KE characteristic factors which can influence the economic development of the assembly group of countries and of each state. The regression models have a high explanatory power, being relevant for studying the relationship between KE characteristics and economic growth.
The regression analysis reveals that in most of the new joined countries to the EU, KE variables had influenced the GDP indicator. This fact highlights the manifestation of a type of economic-social development which meets some of the characteristics of a knowledge based economy. The changes manifested especially in the last decade led to the development of some processes to change the modality by which the production factors contribute to value creation, pointing out strong economic benefits attributable to human capital education.
For the analyzed group of countries, the “Education Index” exerted a significant and positive influence
on the GDP per capita. This aspect proves that for the new Member States, the quality of the national education
systems is a decisive factor of development. The other factors aren’t statistically significant (model 1).
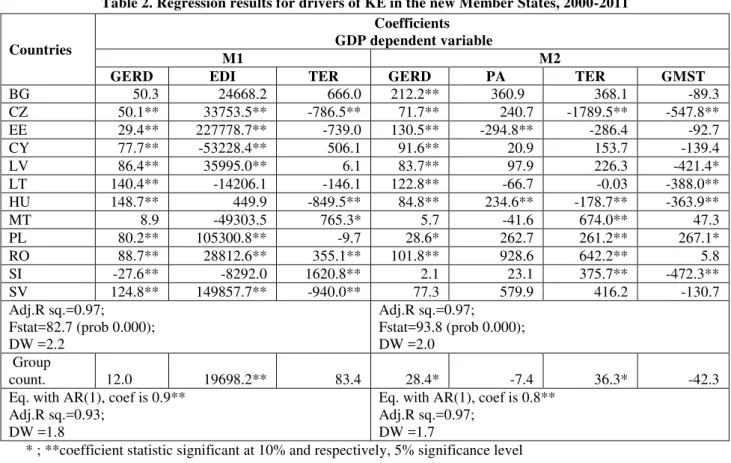
Table 2. Regression results for drivers of KE in the new Member States, 2000-2011
Countries
Coefficients GDP dependent variable
M1 M2
GERD EDI TER GERD PA TER GMST
BG 50.3 24668.2 666.0 212.2** 360.9 368.1 -89.3 CZ 50.1** 33753.5** -786.5** 71.7** 240.7 -1789.5** -547.8** EE 29.4** 227778.7** -739.0 130.5** -294.8** -286.4 -92.7 CY 77.7** -53228.4** 506.1 91.6** 20.9 153.7 -139.4 LV 86.4** 35995.0** 6.1 83.7** 97.9 226.3 -421.4* LT 140.4** -14206.1 -146.1 122.8** -66.7 -0.03 -388.0** HU 148.7** 449.9 -849.5** 84.8** 234.6** -178.7** -363.9** MT 8.9 -49303.5 765.3* 5.7 -41.6 674.0** 47.3 PL 80.2** 105300.8** -9.7 28.6* 262.7 261.2** 267.1* RO 88.7** 28812.6** 355.1** 101.8** 928.6 642.2** 5.8 SI -27.6** -8292.0 1620.8** 2.1 23.1 375.7** -472.3** SV 124.8** 149857.7** -940.0** 77.3 579.9 416.2 -130.7 Adj.R sq.=0.97;
Fstat=82.7 (prob 0.000); DW =2.2
Adj.R sq.=0.97;
Fstat=93.8 (prob 0.000); DW =2.0
Group
count. 12.0 19698.2** 83.4 28.4* -7.4 36.3* -42.3 Eq. with AR(1), coef is 0.9**
Adj.R sq.=0.93; DW =1.8
Eq. with AR(1), coef is 0.8** Adj.R sq.=0.97;
DW =1.7
* ; **coefficient statistic significant at 10% and respectively, 5% significance level Source: Own calculations on data from Eurostat
According to the model 2, the economic growth was also stronger influenced by the size of population’s
segment with tertiary educational attainment and less by the impact of the research and development activities for which the financing funds were considerably reduced. Despite this, the indicator referring at R&D, still remains an important indicator in measuring the innovation potential of a country.
A significant factor of economic development is also “Patens applications”, but their small number did not generate a significant action on GDP per capita. But the influences of the determinant factors of KE are specific to each country, being some differences in their significance degree and the way in which they act.
In the world’s developed economies in which KE is a reality, it is found that they are driven by
technological advances and human capital, knowledge being the decisive factor for the development process (World Bank, 2012). Following the example of these countries and having in view the analysis results, it asserts that also in case of the new Member States, the economic growth depends more by improvement of the
educational system’s components and by a better management of knowledge. This aspect is in accordance with
the conclusions of the other studies regarding KE (Karagiannis, 2007;Sonmez and Sener, 2009;Watkins, 2008). The analyze of regression for KE in Romania, indicated that workforce education is a factor with high statistical significance of variation of the GDP per capita and consequently has an predominant role in transition
of society to the type of economy based on knowledge. The coefficient obtained for the “Educational index”
indicator for measuring the quality of education will determine a growth of GDP with 2881 PPS per inhabitant (model 1).
Increases of the GDP indicator can be also achieved by increasing the dimension of variables GERD and TER (model 2). This way, by increasing the percentage of persons with tertiary education by 1%, the GDP per capita is predicted to increase with 335-642 PPS and increasing the financing founds for R&D with 1% may result in an addition of 88-101 PPS per capita.
For Romania, improvement of the educational system which can ensure more educated and skilled persons able to create and use better knowledge, but also stimulating the investments in research and development, are important action directions which may establish in the future a solid base to develop the economy and growth the social wellbeing of the country.
5. Conclusions
In this paper using econometric modeling it was evaluated the influence of some specific factors of knowledge economy on the economic growth. Research has shown that in countries that later joined the EU there is a strong link between economic growth, education and R & D.
The models used for analyzing the KE indicated that also in Romania, the processes specific for KE are presented. The results pointed to that in this country, the education have a predominant role in transmission of knowledge, personality formation, economic and social development, being a decisive factor to accelerate the transition to KE. For this reason, it is important that the policy for intervention in the structural mechanisms of economy to consider the high benefits which may be obtained by increasing the quality of the human capital and the investments in knowledge.
The analysis results have significance for the scientists concerned by economic growth and development and give arguments to the authorized organizations in substantiating the politic and economic decisions regarding these issues.
The research opens the way of the new approaches related to the domain of analyzing the Knowledge Economy by developing and testing of some models which evaluate the action of the significant influence factors for achieving a smart, sustainable and inclusive growth according to Europe 2020 strategy.
References
[1]. Acemoglu D., Zilibotti F., Productivity differences, Quarterly Journal of Economics, Vol. 116, p. 563-606, 2001.
[2]. Affortunato F., Buciarelli E., Ciommi M., Giulioni G., Assessing local knowledge dynamics: Regional Knowledge Economy Indicators, International Journal of Human and Social Sciences 5:11, p. 703-708, 2010
[3]. Eurostat database, http://epp.eurostat.ec.europa.eu/portal/page/portal/statistics/themes.
[4]. European Commission (EC), 2010, Europe 2020: a strategy for smart, sustainable and inclusive growth, COM(2010) 2020 final, Brussels, March.
[5]. European Commission, Europe 2020 strategy, 2012, http://ec.europa.eu/europe2020/index_en.htm, Accessed January 2013.
[6]. Fattahi m., Barkhorday S., Regional convergence in Knowledge-based Economy, International Economic Studies, vol.39 (2), p.63-68, 2012
[7]. Karagiannis S., The Knowledge-Based Economy, Convergence and Economic Growth: Evidence from the European Union, Centre of Planning and Economic Research, No.91, 2007.
[8]. Sonmez F.D., Sener P., Effects of human capital and openness on economic growth of developed and developing countries: a panel data analysis, International Journal of Social and Human Sciences, vol.3, p.633-637, 2009.
[9]. UNDP, International Human Development Indicators database, http://hdrstats.undp.org/en/tables/ sau http://hdrstats.undp.org/en/indicators/103706.html.
[10]. World Bank, Building Knowledge Economies: Advanced Strategies for Development, Washington DC, 2007
[11]. World Bank, Measuring Knowledge in the World’s Economies, Washington DC, 2008
[12]. Watkins T.M., Building knowledge Economy Index for the fifthly states with a focus on South Carolina:
South Carolina Research Authority Knowledge Economy Index, 2008, http://etd.lib.clemson.edu/documents/1219848943/umi-clemson-1701.pdf. [13.] World Bank, KEI and KI Indexes (KAM 2012), The World Bank Group,