Spatial and temporal heterogeneity in high-grade serous ovarian cancer: a phylogenetic analysis.
Texto
Imagem
Documentos relacionados
In this study, Faith’s phylogenetic indexes and the number of evolutionary independent lineages of Carnivora were calculated at the average patch level based on
Phylogenetic analysis demonstrated that the urinary sam- ples classiied according to the pathogenic groups were grouped primarily into group D, different from previous studies
Fig. Consensus phylogenetic tree based on amino acid sequences of vault complex. The tree construction and analysis of bootstrap were performed using ClustalX 2.0 and MEGA 5.0. For
To understand the evolutionary relationships of the four different DGAT types in plant and algae species, we conducted a phylogenetic analysis using the protein se- quence of
Analyses using the LISA showed signiicant spatial clusters (high values surrounded by high values) in SERs I and V, demonstrating areas of a high number of cases exhibiting low
We took note that a number of cell lines often used as high- grade serous models or generically as ‘‘ovarian carcinoma’’ had both ARID1A mutations and immuno-profiles consistent
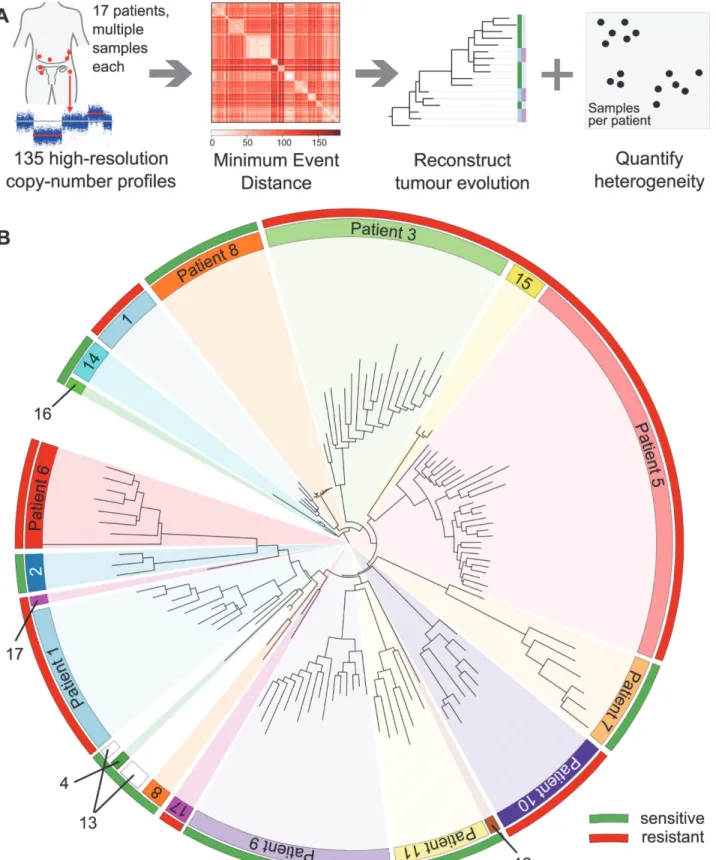
Figure 1. Evolutionary copy-number trees are reconstructed in three steps. 1) After segmentation and compression, major and minor alleles are phased using the minimum event
A low-coverage whole-genome sequencing of samples obtained from peripheral blood, H209 cell line and its derived primary xenograft was performed through shotgun whole genome ultra-
