Submitted3 August 2016
Accepted 30 September 2016
Published15 December 2016
Corresponding author
Velusamy Sundaresan, [email protected], [email protected]
Academic editor
Marion Röder
Additional Information and Declarations can be found on page 16
DOI10.7717/peerj.2638
Copyright
2016 Mishra et al.
Distributed under
Creative Commons CC-BY 4.0
OPEN ACCESS
Feasibility of nuclear ribosomal
region ITS1 over ITS2 in barcoding
taxonomically challenging genera of
subtribe Cassiinae (Fabaceae)
Priyanka Mishra1, Amit Kumar1, Vereena Rodrigues1, Ashutosh K. Shukla2and
Velusamy Sundaresan1
1Department of Plant Biology & Systematics, CSIR - Central Institute of Medicinal and Aromatics Plants, Research Center, Bangalore, Karnataka, India
2Biotechnology Division, CSIR - Central Institute of Medicinal and Aromatic Plants, Lucknow, Uttar Pradesh, India
ABSTRACT
Premise of the Study. The internal transcribed spacer (ITS) region is situated between 18S and 26S in a polycistronic rRNA precursor transcript. It had been proved to be the most commonly sequenced region across plant species to resolve phylogenetic relationships ranging from shallow to deep taxonomic levels. Despite several taxo-nomical revisions in Cassiinae, a stable phylogeny remains elusive at the molecular level, particularly concerning the delineation of species in the generaCassia, Senna and Chamaecrista. This study addresses the comparative potential of ITS datasets (ITS1, ITS2 and concatenated) in resolving the underlying morphological disparity in the highly complex genera, to assess their discriminatory power as potential barcode candidates in Cassiinae.
Methodology. A combination of experimental data and an in-silico approach based on threshold genetic distances, sequence similarity based and hierarchical tree-based methods was performed to decipher the discriminating power of ITS datasets on 18 different species of Cassiinae complex. Lab-generatedsequences were compared against those available in the GenBank using BLAST and were aligned through MUSCLE 3.8.31 and analysed in PAUP 4.0 and BEAST1.8 using parsimony ratchet, maximum likelihood and Bayesian inference (BI) methods of gene and species tree reconciliation with bootstrapping. DNA barcoding gap was realized based on the Kimura two-parameter distance model (K2P) in TaxonDNA and MEGA.
Principal Findings. Based on the K2P distance, significant divergences between the inter- and intra-specific genetic distances were observed, while the presence of a DNA barcoding gap was obvious. The ITS1 region efficiently identified 81.63% and 90% of species using TaxonDNA and BI methods, respectively. The PWG-distance method based on simple pairwise matching indicated the significance of ITS1 whereby highest number of variable (210) and informative sites (206) were obtained. The BI tree-based methods outperformed the similarity-tree-based methods producing well-resolved phylogenetic trees with many nodes well supported by bootstrap analyses.
Conclusion. The reticulated phylogenetic hypothesis using the ITS1 region mainly supported the relationship between the species of Cassiinae established by traditional morphological methods. The ITS1 region showed a higher discrimination power and
be the locus of choice. Considering the complexity of the group and the underlying biological ambiguities, the results presented here are encouraging for developing DNA barcoding as a useful tool for resolving taxonomical challenges in corroboration with morphological framework.
SubjectsBiodiversity, Conservation Biology, Evolutionary Studies, Genetics, Plant Science
Keywords Cassiinae, Evolutionary studies, Fabaceae,In-silicoapproach, Phylogenetic signal, Plant DNA barcoding, nrDNA internal transcribed spacer
INTRODUCTION
DNA barcoding is an important tool for research in biodiversity hot-spots based on the identification and standardization of specific region of the plant genome that can be sequenced routinely in diverse sample sets to identify and discriminate species from one another (Hebert et al., 2003; Gregory, 2005). The revolution introduced by DNA barcoding relies on molecularization (variability in molecular markers), computerization (transposition of the data through bioinformatics workbench) and standardization (extension of approach to diverse group) of traditional taxonomical framework to easily associate all life stages of a biological entity (Casiraghi et al., 2010). The short, variable and standardized DNA sequence can be termed as DNA barcode when it mirrors the distributions of intra- and interspecific variabilities separated by a distance called ‘DNA barcoding gap’ and characterizes conserved flanking regions for development of universal primers across highly divergent taxa (Kress et al., 2005;Savolainen et al., 2005;Hollingsworth et al., 2009).
In the past, DNA barcoding in plants has been extensively reviewed (Vijayan & Tsou, 2010;Hollingsworth, Graham & Little, 2011), but still there is a considerable debate on the consensus of the choice of a standard region (Mishra et al., 2016). Apart from the accepted
mitochondrial cytochrome oxidase I gene (COI) in animals and the nuclear ribosomal
internal transcribed spacer (nrITS) region in fungi, the search for an analogous region in plants focused attention on the plastid genome (Chase et al., 2005;Kress et al., 2005;
Nilsson et al., 2006;Fazekas et al., 2009). Subsequently, major individual candidate regions matK,rbcL,rpoB, rpoC1, and the intergenic spacers ITS,trnH-psbA,trnL-F,atpF-atpHand psbK-psbI were tested for use in plants on their discrimination capacity. Due to pitfalls and challenges associated with a single locus, the combination of loci emerged as a promising choice to obtain appropriate species discrimination (Chase et al., 2007;Kress & Erickson, 2007; Fazekas et al., 2008;CBoL Plant Working Group, 2009;Hollingsworth, Graham & Little, 2011).
DNA occurs as intercalated in the 16S–5.8S–26S region of rDNA locus and consists of ITS1, ITS2 and the highly conserved 5.8S. Also, many studies have compared the discriminatory power of ITS region in its entirety with ITS2, proposing ITS2 as an alternative barcode to entire ITS region because of sufficient variation in primary sequences and secondary structures (Chen et al., 2010;Gao et al., 2010;Han et al., 2013). Despite the problems in amplifying and directly sequencing the entire region, ITS1 has been tested as a better barcode for eukaryotic species (Wang et al., 2014) and also a successful region for the members of legume family (Yadav et al., 2016).
Fabaceae (Legumes) are the third largest family of flowering plants with Caesalpinioidae being the second largest of the three subfamilies (Irwin & Barneby, 1981). Cassiinae is a subtribe of Fabaceae in the subfamily Caesalpinioidae, comprising of three genera, viz. CassiaL. sens. str.,SennaP. Mill., andChamaecristaMoench. GenusCassiaL. sens.lat., is one of the twenty-five largest genera of dicotyledonous plant with high diversity of secondary metabolites which serve as medicinal, nutraceuticals and sustainable agriculture etc. (Singh, 2001). TinnevellySennais the second largest exported herb drug in the country and contributes significantly in the range of 5,000 metric tons per year as commercial products (Seethapathy et al., 2014). Despite several studies by many taxonomists, either on the whole family or at the genus level, there has been considerable divergence of opinion concerning the delimitations and taxonomic status of the subgenera at the molecular level. The wide variability in habit ranging from tall trees to delicate annual herbs, floral and vegetative features, pods variability, etc had made its taxonomical framework quite complex and intriguing (Singh, 2001). Cytological and karyological studies of 17 taxa of Cassia, showed no correlation between the habit and karyotype symmetry of various species (Bir & Kumari, 1982). Thus, the identification of the species has proved tricky and is rather difficult to account for the entire genetic variation existing in the genera. A robust and reliable method is crucial to discriminate plant species to secure their diversity.
Few studies inCassiahave been conducted utilizing the dominant molecular markers
(Mohanty et al., 2010), plastid and nuclear region markers for different purposes (Purushothaman et al., 2014; Seethapathy et al., 2014). The studies demonstrated the subsequent contribution of markers in assessing product adulteration in herbal drug market in India (Seethapathy et al., 2014). Although the results were not based on evolutionary relationships concept, they did indicate a potential role of different regions (markers) in resolving species complexity inCassia(Mohanty et al., 2010;Purushothaman et al., 2014).
In this study, we evaluated the potential ability of ITS regions for identifying and discriminating subtribe Cassiinae based on a representative sample consisting of approximately half of the genera. The applicability and effectiveness of ITS regions (ITS1 and ITS2) in discriminating species across the genera Cassia, SennaandChamaecrista were studied for the first time. The sufficient sequences available in GenBank with nuclear region ITS were included for analysis. The main goals of this study were as follows: (i) to infer applicability and efficacy of the ITS regions (ITS1, ITS2 and ITS1+2) as barcoding
MATERIALS AND METHODS
Taxon sampling, DNA amplification and sequencing
A total of 54 accessions of 18 species belonging to three genera viz.Cassia, Senna,and Chamaecristafrom India were examined during the study. For obtaining the sequences generated from molecular experiments in our lab, a total of 18 individuals corresponding to three different genera were collected from different geographical regions of South Western Ghats and Uttar Pradesh. The species were identified and authenticated using the morphological characters described in a monographic study on Cassiinae in India (Singh, 2001) by Dr. V. Sundaresan, Senior Scientist, Central Institute of Medicinal and Aromatic Plants, Research Centre (Bangalore). For each of the species, herbarium specimens were prepared and deposited at the Herbaria of the Central Institute of Medicinal and Aromatic
Plants (Table 1, CIMAP Communication No.: CIMAP/PUB/2016/24), Lucknow.
Legumes family produce a high diversity of secondary metabolites, which causes extreme difficulty in isolation of high-quality nucleic acids. Based on literature and commercial kits available, we attempted modification of several previously reported methods to isolate high quality DNA. Ultimately, total genomic DNA from individual accessions was extracted from the leaf tissues (dried in silica-gel) using the modified cetyl trimethyl
ammonium bromide (CTAB) protocol with necessary major modifications (Khanuja et
al., 1999) and supplementing it with the Nucleospin Plant II Maxi prep kit using the manufacturer’s protocol (MACHEREY-NAGEL, Duren Germany). The concentration of
β-mercaptoethanol and PVP (Polyvinylpyrrolidone) were increased to 2% v/v and 4%
w/v, respectively. An additional chloroform-isoamyl alcohol (96:4) purification step was performed to remove proteins and potentially interfering secondary metabolites. Isolated DNA was checked for its quality and quantity by electrophoresis on a 0.8% agarose gel and spectrophotometric analysis (NanoDrop, ND-1000, USA). The nuclear internal transcribed spacer (ITS1 and ITS2) regions of all the individuals were amplified according to PCR reaction conditions (94◦
C, 5 min; (30 cycles: 94◦
C, 1 min; 50◦
C, 1 min; 72◦
C, 1.5 min); 72◦
C, 7 min) following guidelines from the CBOL plant-working group and sequenced using universal primers ITS5a forward 5′
-CCTTATCATTTAGAGGAAGGAG-3′
and ITS4 reverse 5′
-TCCTCCGCTTATTGATATGC-3′
(Kress et al., 2005). PCR amplifications
for each primer set were carried out in a 50µl volume solution containing 1x Taq DNA
polymerase buffer, 200µM each dNTPs (dATP:dTTP:dCTP:dGTP in 1:1:1:1 parts), 10 pmol
of each primer (forward and reverse), 1 unit of Taq DNA polymerase and∼25–50 ng of
template DNA. The PCR fragment lengths were determined on a 2% agarose gel. The PCR products were purified with Nucleospin PCR purification kit (MACHEREY-NAGEL, Duren, Germany) as per the manufacturer’s instructions. Presence of the specific product was confirmed by running the purified PCR products on 2% agarose gel. All the purified PCR products were subjected to double-stranded sequencing using the Applied Biosystems Big Dye Terminator Cycle Sequencing Kit (Applied Biosystems, Foster City, CA, USA) on an ABI 3130 XL automated sequencer (Applied Biosystems).
Apart from the lab-generated sequences, all the nucleotide sequences belonging to
Table 1 Passport sheet for the samples undertaken. Sample details with GenBank accession numbers of all the samples ofCassia, Senna, and Chamaecristaused in this study. Accessions numbers marked in bold represent lab-generated sequences from the present study.
Taxon Region Collection site Voucher number (No.) GenBank (NCBI)
accessions no.
Chamaecrista absus ITS Tirunelveli, Tamil Nadu CIMAP-C010 KT279729.1
Chamaecrista absus ITS2 GenBank GenBank FJ009832.1
Chamaecrista absus ITS GenBank GenBank KC817015.1
Chamaecrista absus ITS2 GenBank GenBank FJ009832.1
Chamaecrista nigricans ITS Tuticorin, Tamil Nadu CIMAP-C011 KT279731.1
Chamaecrista nigricans ITS2 GenBank GenBank JQ301845.1
Chamaecrista nigricans ITS2 GenBank GenBank JQ301845.1
Senna uniflora ITS Tirunelveli, Tamil Nadu CIMAP-C012 KT279730.1
Senna uniflora ITS GenBank GenBank KJ605909.1
Senna uniflora ITS GenBank GenBank KJ605897.1
Senna italica ITS Tuticorin, Tamil Nadu CIMAP-C013 KT279732.1
Senna italica ITS GenBank GenBank KJ004293.1
Senna italica ITS GenBank GenBank KF815503.1
Senna hirsuta ITS Tirunelveli, Tamil Nadu CIMAP-C014 KT279733.1
Senna hirsuta ITS GenBank GenBank KJ605904.1
Cassia fistula ITS2 GenBank GenBank JQ301830.1
Senna hirsuta ITS GenBank GenBank KJ605905.1
Senna hirsuta ITS2 GenBank GenBank KJ605904.1
Senna alata ITS Kukrail, Lucknow CIMAP-C015 KT308089.1
Senna alata ITS GenBank GenBank KJ638414.1
Senna alata ITS GenBank GenBank KJ638413.1
Senna sulfurea ITS Raebareli, Lucknow CIMAP-C016 KT308090.1
Senna sulfurea ITS2 GenBank GenBank JQ301833.1
Senna siamea ITS CIMAP, Bangalore CIMAP-C017 KT308091.1
Senna siamea ITS GenBank GenBank KC984644.1
Senna siamea ITS GenBank GenBank KJ638421.1
Senna siamea ITS2 GenBank GenBank JQ301842.1
Senna obtusifolia ITS Raebareli, Lucknow CIMAP-C018 KT308092.1
Senna obtusifolia ITS GenBank GenBank GU175319.1
Senna occidentalis ITS Frlht, Bangalore CIMAP-C019 KT308093.1
Senna occidentalis ITS GenBank GenBank KJ638419.1
Senna occidentalis ITS GenBank GenBank KP092706.1
Senna occidentalis ITS2 GenBank GenBank KJ638419.1
Senna occidentalis ITS2 GenBank GenBank KP092706.1
Senna pallida ITS Raebareli, Lucknow CIMAP-C020 KT308095.1
Cassia fistula ITS2 GenBank GenBank JQ301830.1
Senna pallida ITS2 GenBank GenBank JQ301829.1
Senna auriculata ITS Frlht, Bangalore CIMAP-C021 KT308096.1
Senna auriculata ITS GenBank GenBank KJ638417.1
Table 1(continued)
Taxon Region Collection site Voucher number (No.) GenBank (NCBI)
accessions no.
Senna auriculata ITS2 GenBank GenBank JQ301838.1
Senna auriculata ITS GenBank GenBank KJ638416.1
Senna alexandrina ITS CIMAP, Lucknow CIMAP-C022 KT308097.1
Senna alexandrina ITS GenBank GenBank KF815491.1
Senna alexandrina ITS2 GenBank GenBank JQ301846.1
Senna alexandrina ITS2 GenBank GenBank JQ301846.1
Senna surattensis ITS GenBank GenBank KJ638427.1
Senna surattensis ITS GenBank GenBank KJ605903.1
Senna surattensis ITS GenBank GenBank KJ605902.1
Senna surattensis ITS2 GenBank GenBank KJ638427.1
Senna tora ITS GenBank GenBank KJ638426.1
Senna siamea ITS2 GenBank GenBank JQ301842.1
Senna tora ITS GenBank GenBank KJ638425.1
Senna tora ITS GenBank GenBank KJ638424.1
Senna tora ITS2 GenBank GenBank KJ638426.1
Senna tora ITS2 GenBank GenBank KJ638425.1
Senna tora ITS2 GenBank GenBank KJ638424.1
Cassia roxburghii ITS GenBank GenBank JX856435.1
Cassia roxburghii ITS2 GenBank GenBank JQ301841.1
Cassia javanica ITS Raebareli, Lucknow CIMAP-C023 KT338798.1
Cassia javanica ITS GenBank GenBank FJ009821.1
Cassia javanica ITS2 GenBank GenBank JQ301831.1
Cassia javanica ITS GenBank GenBank FJ980413.1
Cassia javanica ITS2 GenBank GenBank JQ301831.1
Cassia fistula ITS SCAD, Tirunelveli CIMAP-C024 KT308094.1
Cassia fistula ITS GenBank GenBank JX856431.1
Cassia fistula ITS GenBank GenBank JX856430.1
Cassia fistula ITS2 GenBank GenBank JQ301830.1
Senna surattensis ITS2 GenBank GenBank KJ638427.1
Senna surattensis ITS2 GenBank GenBank KJ638427.1
Senna pallida ITS2 GenBank GenBank JQ301829.1
Senna auriculata ITS2 GenBank GenBank JQ301838.1
Senna auriculata ITS2 GenBank GenBank JQ301838.1
Senna hirsuta ITS2 GenBank GenBank KJ605904.1
Senna hirsuta ITS2 GenBank GenBank KJ605904.1
Senna siamea ITS2 GenBank GenBank JQ301842.1
Cassia javanica ITS2 GenBank GenBank JQ301831.1
Cassia javanica ITS GenBank GenBank FJ009821.1
Cassia roxburghii ITS GenBank GenBank JX856435.1
from the NCBI based on the BLAST results. The sequences were filtered on the basis of length (less than 300 bp were omitted), lack of voucher specimens as well as verification (sequences categorised as unverified in GenBank were omitted). An effort was made to include minimum five individuals for each species, but due to unavailability of sequences for few species in the NCBI database and difficulty in obtaining the species in the field, the representatives of each species were limited to three. The GenBank accession numbers used in this study are listed inTable 1.
Data analysis
Electropherograms corresponding to raw sequences of individual accessions from both the forward and reverse primers were assembled and edited using CodonCode Aligner v.3.0.1 (CodonCode Corporation). Sequences were clipped at the end to avoid the presence of variable sites introduced by the sequencing artefacts. Due to its well-conserved nature, the 5.8S gene region was removed from any sequence so that the ITS1 and ITS2 regions could be analyzed separately and concatenated. The edited sequences were then aligned with
MUSCLE 3.8.31 on the EMBLEBI website (http://www.ebi.ac.uk) with default parameter
and adjusted manually in BioEdit v7.1.3.0 (Hall, 1999). All the variable sites were rechecked on the original trace files. To evaluate the effectiveness of ITS1, ITS2 and their combination (ITS1+2) as barcodes in the concerned genera, three widely used methods viz.
distance-based (PWG-distance), similarity-distance-based and tree-distance-based were applied.
Genetic distance-based method
To evaluate the measure of effective barcode locus, DNA barcoding gap was calculated using TaxonDNA software with a ‘pairwise summary’ function under K2P nucleotide substitution model (Meier et al., 2006). The pairwise genetic distance were calculated at the observed levels of intra- and inter-specific divergence for each barcode. To test the accurate species assignments, the distributions of the pairwise intra- and inter-specific distances with 0.005 distance intervals were generated. The histogram of distances vs. abundance were plotted to estimate the presence of any barcoding gaps. For the PWG-distance method, the genetic pairwise distance was estimated by MEGA version 6 (Tamura et al., 2013) using the Kimura two-parameter distance model (K2P) with pairwise deletion of missing sites (Kimura, 1980). Average inter-specific distance was used to characterize inter-specific divergence (Meyer & Paulay, 2005;Meier, Zhang & Ali, 2008) and ‘all’ intra-specific distance, mean ‘theta’ and coalescent depth were used to characterize intra-specific distances. Finally, the obtained inter- and intra-specific distances were plotted with frequency distribution in bin interval of 0.05 to illustrate the existing DNA barcoding gap (Meyer & Paulay, 2005;
Lahaye et al., 2008).
DNA sequence similarity-based method
sequence with all the other sequences to determine the closest match. The ‘Best match’ modules than classifies the sequences as correct and incorrect based on the indicated pair from the similar species or different species respectively. While the various equally best matches from different species are referred to be as ambiguous. The ‘Best close match’ module works on the intra-species variability criterion and considered to be the more rigorous method in TaxonDNA. The sequences classified as ‘no match’ are the results above the calculated threshold value (Meier et al., 2006).
Tree-based method
To evaluate the ability of candidate barcode to delimit the species into discrete clades or monophyletic groups, three different optimality criteria (tree-building method) viz Neighbour-joining with minimum evolution (NJ), maximum likelihood (ML) and Bayesian inference (BI) were employed. To test the reliability of the result, NJ and ML trees were constructed and compared with two different softwares: (i) In MEGA using the K2P distance as model of substitution (Tamura et al., 2013) and (ii) In PAUP 4.0 with the HKY-gamma substitution model (Swofford, 2003). The reliability of the node was assessed by a bootstrap test with 1,000 pseudo-replicates with the K2P distance options (Felsenstein, 1988). Bayesian sampling was performed in BEAST1.8 using the operators: HKY substitution model with four gamma categories, a constant-rate Yule tree prior and 10,000 chain lengths and all other priors and operators with the default settings. Coalescent tree priors were used for population-level analysis and speciation prior were applied to estimate relationships and divergence times of inter-species data. Trees were sampled for every 5,000 generations resulting in a total of 10,000 trees, and a burn-in of 50,00,000. Beast file was created using the BEAUti program v1.8.2 within Beast and performance of each run was further analysed with the program Tracer (Rambaut et al., 2014). The resulting Beast tree files were annotated through TreeAnnotator v1.8.2 and visualized and edited with FigTree v1.4.2. (Rambaut, 2014,http://tree.bio.ed.ac.uk/software/figtree). Visualization and analysis of all the resulting trees through PAUP 4.0 was done in Dendroscope3 (Huson & Scornavacca, 2012). Gaps were treated as missing data for all the phylogenetic analysis.
RESULTS
PCR amplification and sequence characteristics
The sequence characteristics of ITS regions evaluated in this study showed good success
rates (90%) for PCR amplification (ranging from 571-1153 bp with mean size∼707 bp;
gel images can bé provided on request) and sequencing in both the direction using a single primer pair ITS5a forward and ITS4 reverse. The presence of large amount of secondary metabolites, polysaccharides and polyphenolic compounds in the plants of sub-family Caesalpinioidae, hindered the isolation of pure nucleic acids. Therefore few samples had to be excluded from the study after 3–4 initial amplification attempts that failed due to the presence of inhibitory components. The present study generated 15 new sequences belonging to 15 different species of Cassia, Senna, andChamaecrista. The sequences
were submitted to NCBI (www.ncbi.nlm.nih.gov/genbank/) and corresponding GenBank
Table 2 Summary statistics for DNA alignments.
Alignments Region Residual length G+C (%) Identical sites
(%)
Pairwise identity (%)
Alignment S1 ITS1 315 57.0 % 26.3 % 82.15 %
Alignment S2 ITS2 258 63.9 % 35.8 % 77.20 %
Alignment S1+S2 ITS1+2 573 60.1 % 30.8 % 80.10 %
Notes.
Residual length, the length of the complete alignment, counting portions excluded from analysis; G+C, the G+C content of the complete (total length) alignment; Identical sites, the % of columns in the alignment for which all sequences are identical; Pairwise identity, the % of pairwise residues that are identical in the alignments, including gap versus non-gap residues, but excluding gap vs. gap residues.
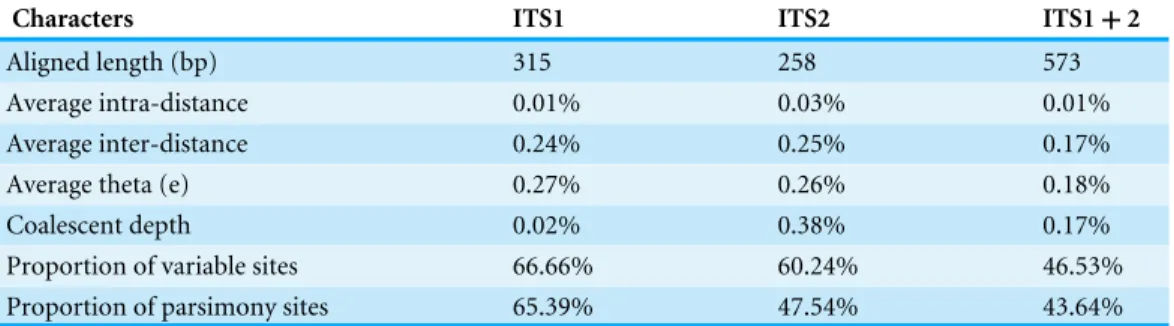
Table 3 Summary of sequence characteristics of the barcode candidates and their combinations analysed in this study.
Characters ITS1 ITS2 ITS1+2
Aligned length (bp) 315 258 573
Average intra-distance 0.01% 0.03% 0.01%
Average inter-distance 0.24% 0.25% 0.17%
Average theta (e) 0.27% 0.26% 0.18%
Coalescent depth 0.02% 0.38% 0.17%
Proportion of variable sites 66.66% 60.24% 46.53%
Proportion of parsimony sites 65.39% 47.54% 43.64%
to 18 different species ofCassia, Senna, andChamaecristafor ITS regions (ITS1 and ITS2)
were obtained from NCBI and included in the study (Table 1). The ITS1 region had
an aligned length of 315 bp (Alignment S1) which was greater than that of ITS2 with 258 bp (Table 2;Alignment S2). The combined region ITS1+2 showed an align length
of 573 bp (Alignment S3) with 80.1 % of pairwise identity (Table 2). The aligned ITS1 matrix consisted of 315 bp with 206 parsimony sites. The number of variable sites was
210. The maximum intra-specific divergence was observed among the individuals ofSenna
siameawith 0.023 PWG-distance while minimum inter-specific distances were recorded between Senna hirsutaandSenna occidentaliswith 0.039 PWG-distance. The species of genusChamaecristashowed lowest K2P distances (Table 3). Overall the summary statistics for DNA alignments and DNA sequences for the ITS dataset evaluated in this study are summarized inTables 2and3respectively.
Genetic divergence and Barcoding gap
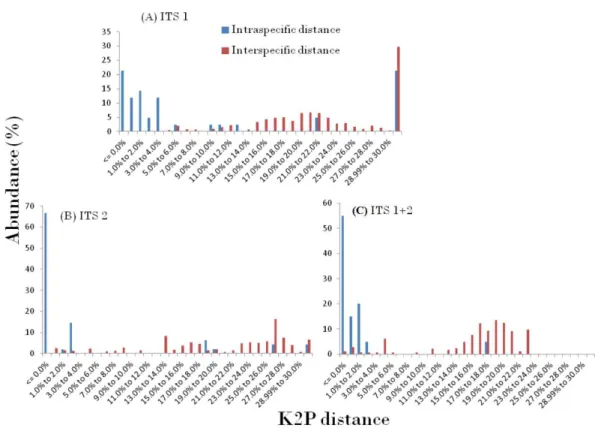
The presence of DNA barcoding gap based on the concept of an inter-specific distance being larger than the intra-specific distance for a species, directly reveals the species discrimination ability of candidate barcodes. In this study, the relative distribution of frequencies of K2P distances for three ITS datasets using TaxonDNA software showed a significant pattern with the inter-specific distance being higher and did not fully overlap with the intra-specific distance resulting in the presence of an identified barcoding gap in the genera. The observed pattern of ITS1, ITS2 and ITS1+2 results are presented inFig. 1.
Figure 1 Pairwise distance based on K2P method.Relative abundance of intra- and inter-specific Kimura-2-Parameter pairwise distance based on TaxonDNA methods considering nrITS dataset in genera Cassia, Senna, andChamaecrista.
MEGA, for ITS1 varied in the range from 0.023 to 0.000 and 0.033–1.185 respectively (Table 3).
Species discrimination based on different analytical methods
In accordance with the CBOL PWG-distance method, a favourable barcode should possess a high inter-specific divergence to distinguish different species. The result obtained through the different datasets showed significant pattern of inter-specific divergence, whereby ITS1 was concluded to be the best among the candidates. The mean pairwise inter-specific distances were found to be higher in comparison to intra-specific distances in all the barcodes, resulting in the presence of a clear barcode gap. The distance distribution range of all inter- and intra-specific distances for all markers are shown inFig. 2.
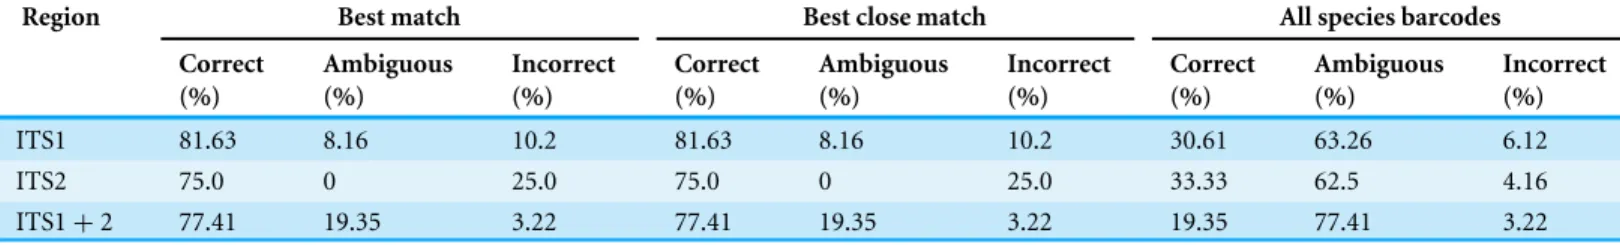
Compared with the PWG- distance method, the BM and BCM functions of TaxonDNA showed the better discrimination success. All the three datasets presented same success rate of species identification when BM was selected in comparison to BCM. The highest and same rate of discriminatory power (81.6%) was observed for ITS1 on both BM and BCM functions. The other two datasets; ITS2 and ITS1+2 datasets recovered 75.0% and 77.4%
BM respectively (Table 4).
Figure 2 Evaluation of DNA barcoding Gap.Relative distributions of intra- and inter-specific distances based on PWG-distance based methods for the three nrITS datasets in Cassiinae.xaxes relate to Kimura 2-parameter (K2P) distances arranged in intervals, and theyaxes correspond to the frequency distribu-tion.
Table 4 Identification success rates based on analysis of the ‘Best match,’ ‘Best close match’ and ‘All species barcodes’ function of TaxonDNA software for each ITS dataset.
Region Best match Best close match All species barcodes
Correct (%)
Ambiguous (%)
Incorrect (%)
Correct (%)
Ambiguous (%)
Incorrect (%)
Correct (%)
Ambiguous (%)
Incorrect (%)
ITS1 81.63 8.16 10.2 81.63 8.16 10.2 30.61 63.26 6.12
ITS2 75.0 0 25.0 75.0 0 25.0 33.33 62.5 4.16
ITS1+2 77.41 19.35 3.22 77.41 19.35 3.22 19.35 77.41 3.22
for species monophyly in all the datasets. While in the combination of ITS1+2, all the
Figure 3 Phylogenetic consensus tree constructed using bayesian inference algorithm.Phylogenetic consensus tree obtained forCassia,Senna, andChamaecristaspecies based on nrITS datasets constructed using the Bayesian inference algorithm. Representatives from individual species are abbreviated based on corresponding taxon.
were in consistent with the result obtained from the traditional morphological classification method. The clustering pattern of three different generaCassia, Senna,andChamaecrista within the subtribe Cassinae based on the nuclear ribosomal region ITS1, proved to be successful in comparison to the infrageneric clustering of taxa. The clustering of Senna tora,Senna unifloraandSenna obtusifoliaaccessions based on molecular algorithm of ITS1
complies with the morphological similarity occurs among them, while in ITS2,Senna
uniflora showed little divergence (Fig. 3). Also, we were not able to find out the clear pattern of lineage of respective species within the genus at a molecular level, as according to traditional taxonomy. Worthy to note here, that the resulting pattern within the individuals of same species and high reliability value obtained for their nodes concludes the existence of genetic similarity among them. Framing ofSenna occidentalisandSenna hirsutainto the individual cluster through ITS1, were in consistent with the key classification (Fig. 3).
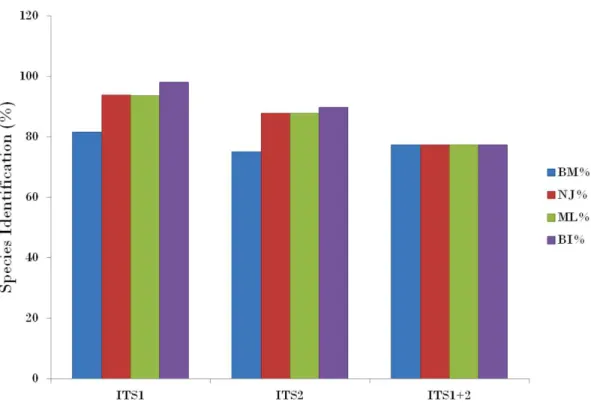
Figure 4 Comparison of species discrimination rates.Species discrimination rates of nrITS datasets based on different methods in Cassiinae. ITS1 barcode in conjunction with the Bayesian inference analysis of hierarchical tree-based method met the objectives of DNA barcoding.
similarity based and distance based methods showed that BI phylogenetic method and BM similarity methods outperformed the PWG- distance method when using these barcode loci (Fig. 4).
DISCUSSION
Discrimination success
Figure 5 Evolutionary relationships in Cassinae.Evolutionary relationships in generaCassia,Senna, andChamaecristabased on nrITS barcode constructed using the Bayesian inference algorithm. Taxon names are abbreviated (seeTable 1).
The PWG-distance method based on simple pairwise matching recommended by CBOL Plant Working Group as a universal and robust method for the assessment of clear barcoding gap indicated the significance of ITS1, thereby highest number of variable and informative sites (210 and 206, respectively) were obtained. Moreover, the rate of species discrimination is equally efficient when ITS1 and ITS2 are concatenated. These results were expected, considering the complexity of the genera and directly reflected on the performance of ITS1 and ITS2 as barcode markers inCassia, Senna,andChamaecrista. The possible reason behind the results might be the inter-specific sharing of identical sequences or failure of conspecific individuals to group together. Besides, many other aspects have also been reported for unclear barcoding gap such as imperfect taxonomy, inter-specific hybridization, paralogy and incomplete lineage sorting (Yan et al., 2015). However, ITS region has proved to be a suitable marker in authentication ofCassiaspecies in the commercial herbal market (Seethapathy et al., 2014). The strong identification ability of nuclear region ITS have been verified in many complex groups (Baldwin et al., 1995;
Moreover, the differences among the three methods compared here, have their possible cause in the theories behind their algorithms and the matter of comprehensive sampling. Thus the comparison of species resolution between studies without consideration of the methods should be avoided for one or the other reasons discussed, as species resolution is an important criterion for assessment of robust barcodes.
Biological implications of ITS based signalling in Cassiinae
The corroboration of morphological, ecological, geographical, reproductive biology and DNA sequence information paved the successful path for constructing robust taxonomy for diverged plant taxa (DeSalle, Egan & Siddall, 2005;Fazekas et al., 2009;Hollingsworth, Graham & Little, 2011). The ITS region appears to evolve more rapidly than coding regions in interpreting phylogenetic relationships at lower taxonomic levels (Inter-generic and Inter-specific). Species discrimination for the genera Cassia, SennaandChamaecrista sampled in this study was high with the strong identification ability of nuclear region ITS. All the three genera maintained the monophyly of the clade either alone or in combination of barcoded loci. The resulting bootstrap value lends support to our findings. To some extent, the divergence of species within the genus did not outperformed as designated according to key taxonomy. The possible reasons behind the findings could be the complexity of the genus with large number of highly polymorphic species which has been found to devise greater interspecific variation (Mohanty et al., 2010). Sometimes interspecific hybridization and gene introgression had accounted for the limited barcoding event at genus level. Moreover generaCassiaandSennaaccounts for high morphological complexity based on species polymorphism, which have been reported in few studies in the past. Successful PCR amplifications, sequencing strategy and alignment matrix obtained from the present study provided further evidence to support the separation of species and genera. The robust phylogenetic signalling of ITS region seems obvious in Cassinae. Although an earlier study (excluding ITS) did not report any single novel region to differentiate the existingCassiaspecies (Purushothaman et al., 2014), our findings provide the potentiality of the ITS region with data support. The delineation of genera based on ITS regions provided a basic framework to have an authentication prospect of correct species at the industrial level.
CONCLUSIONS
over ITS2, have been suggested recently in the studied taxonomic group (Wang et al., 2014). Through our study, we concluded that ITS1 region should be used as a starting point to assign correct identification in the highly complex generaCassia, SennaandChamaecrista.
ACKNOWLEDGEMENTS
The authors thank CSIR-CIMAP Director Lucknow for his encouragement and for providing laboratory facilities. The work was carried out under the XIIth FYP project BioprosPR (BSC-0106) of the Council of Scientific and Industrial Research (CSIR), New Delhi, India.
ADDITIONAL INFORMATION AND DECLARATIONS
Funding
The authors received no funding for this work.
Competing Interests
The authors declare there are no competing interests.
Author Contributions
• Priyanka Mishra conceived and designed the experiments, performed the experiments,
analyzed the data, contributed reagents/materials/analysis tools, wrote the paper, prepared figures and/or tables, reviewed drafts of the paper, contributed to plant samples.
• Amit Kumar contributed reagents/materials/analysis tools, contributed to plant samples.
• Vereena Rodrigues contributed reagents/materials/analysis tools.
• Ashutosh K. Shukla conceived and designed the experiments, reviewed drafts of the
paper, critically reviewed the manuscript.
• Velusamy Sundaresan conceived and designed the experiments, reviewed drafts of the
paper, critically reviewed the manuscript, contributed to plant samples.
Ethics
The following information was supplied relating to ethical approvals (i.e., approving body and any reference numbers): CIMAP Communication No.: CIMAP/PUB/2016/24.
DNA Deposition
The following information was supplied regarding the deposition of DNA sequences: GenBank database.
KT279729; KT279730; KT279731; KT279732; KT279733; KT308089; KT308090;
KT308091; KT308092; KT308093; KT338798; KT308094; KT308095; KT308096;
KT308097.
Data Availability
Supplemental Information
Supplemental information for this article can be found online athttp://dx.doi.org/10.7717/ peerj.2638#supplemental-information.
REFERENCES
Álvarez I, Wendel JF. 2003.Ribosomal ITS sequences and plant phylogenetic inference. Molecular Phylogenetics and Evolution29:417–434
DOI 10.1016/S1055-7903(03)00208-2.
Alves TLS, Chauveau O, Eggers L, Souza-Chies TTD. 2014.Species discrimination in Sisyrinchium(Iridaceae): assessment of DNA barcodes in a taxonomically challeng-ing genus.Molecular Ecology Resources14:324–335DOI 10.1111/1755-0998.12182.
Austerlitz F, David O, Schaeffer B, Bleakly K, Olteanu M, Leblois R, Veuile M, Laredo C. 2009.DNA barcode analysis: a comparison of phylogenetic and statistical
classifi-cation methods.BMC Bioinformatics10:S10DOI 10.1186/1471-2105-10-S14-S10.
Baldwin BG, Sanderson MJ, Porter JM, Wojciechowski MF, Campbell CS, Donoghue MJ. 1995.The ITS region of nuclear ribosomal DNA: a valuable source of evidence on angiosperm phylogeny.Annals of the Missouri Botanical Garden82:247–277 DOI 10.2307/2399880.
Bir SS, Kumari S. 1982.Karyotipic studies inCassiaLinn. from India.Proceedings of the National Academy of Sciences, India, Section B: Biological Sciences B48:397–404.
Casiraghi M, Labra M, Ferri E, Galimberti A, Demattia F. 2010. DNA barcoding: theoretical aspects and practical applications. In: Nimis PL, Lebbe RV, eds.Tools for identifying biodiversity: progress and problems. Proceedings of the international congress, Paris, Trieste: Edizioni Università di Trieste, 269–273.
CBoL Plant Working Group. 2009.A DNA barcode for land plants.Proceedings of the National Academy of Sciences of the United States of America106:12794–12797 DOI 10.1073/pnas.0905845106.
Chase MW, Cowan RS, Hollingsworth PM, Van den Berg C, Madrinan S, Petersen G, Seberg O, Jorgsensen T, Cameron KM, Carine M. 2007.A proposal for a standardised protocol to barcode all land plants.Taxon56:295–299.
Chase MW, Salamin N, Wilkinson M, Dunwell JM, Kesanakurti RP, Haidar N, Savolainen V. 2005.Land plants and DNA barcodes: short-term and long-term goals.Philosophical Transactions of the Royal Society of London B: Biological Sciences
360:1889–1895DOI 10.1098/rstb.2005.1720.
Chen S, Yao H, Han J, Liu C, Song J, Shi L, Zhu Y, Ma X, Gao T, Pang X, Luo K, Li Y, Li X, Jia X, Lin Y, Leon C. 2010.Validation of the ITS2 region as a novel DNA barcode for identifying medicinal plant species.PLoS ONE5:e8613 DOI 10.1371/journal.pone.0008613.
DeSalle R, Egan MG, Siddall M. 2005.The unholy trinity: taxonomy, species delimitation and DNA barcoding.Philosophical Transactions of the Royal Society of London. Series B, Biological Sciences360:1905–1916DOI 10.1098/RSTB.2005.1722.
Drummond AJ, Suchard MA, Xie D, Rambaut A. 2012.A Bayesian phylogenetics
with BEAUti and the BEAST 1.7.Molecular Biology and Evolution29:1969–1973
DOI 10.1093/molbev/mss075.
Fazekas AJ, Burgess KS, Kesanakurti PR, Graham SW, Newmaster SG, Husband BC, Percy DM, Hajibabaei M, Barret SC. 2008.Multiple multilocus DNA barcodes from the plastid genome discriminate plant species equally well.PLoS ONE3:e2802 DOI 10.1371/journal.pone.0002802.
Fazekas AJ, Kesanakurti PR, Burgess KS, Perc DM, Graham SW, Barrett SC, New-master SG, Hajibabaei M, Husband BC. 2009.Are plant inherently harder to
discriminate than animal species using DNA barcoding markers?Molecular Ecology
Resources9:130–139DOI 10.1111/j.1755-0998.2009.02652.x.
Felsenstein J. 1988.Phylogenies from molecular sequences: inference and reliability. Annual Review of Genetics22:521–565 DOI 10.1146/annurev.ge.22.120188.002513.
Gao T, Yao H, Song J, Liu C, Zhu Y, Ma X, Pang X, Xu H, Chen S. 2010.Identification of medicinal plants in the family Fabaceae using a potential DNA barcode ITS2.Journal of Ethnopharmacology 130:116–121DOI 10.1016/j.jep.2010.04.026.
Giudicelli GC, Mäder G, Freitas de LB. 2015.Efficiency of ITS sequences for DNA barcoding inPassiflora(Passifloraceae).International Journal of Molecular Sciences
16:7289–7303DOI 10.3390/ijms16047289.
Gregory TR. 2005.DNA barcoding does not compete with taxonomy.Nature
434:1067–1080DOI 10.1038/4341067b.
Hall TA. 1999.BioEdit: a user-friendly biological sequence alignment editor and analysis
program for Windows 95/98/NT.Nucleic Acids Symposium Series41:95–98.
Han J, Zhu Y, Chen X, Liao B, Yao H, Song J, Chen S, Meng F. 2013.The short ITS2 sequence serves as an efficient taxonomic sequence tag in comparison with the full-length ITS.BioMed Research International2013:741–476DOI 10.1155/2013/741476.
Hebert PDN, Cywinska A, Ball SL, DeWaard JR. 2003.Biological identification through DNA barcodes.Proceedings of the Royal Society B: Biological Sciences270:313–321 DOI 10.1098/rspb.2002.2218.
Hollingsworth ML, Andra Clark A, Forrest LL, Richardson J, Pennington RT, Long DG, Cowan R, Chase MW, Gaudeul M, Hollingsworth PM. 2009.Selecting barcoding loci for plants: evaluation of seven candidate loci with species-level sampling in three divergent groups of land plants.Molecular Ecology Resources9:439–457 DOI 10.1111/j.1755-0998.2008.02439.
Hollingsworth PM, Graham SW, Little DP. 2011.Choosing and using a plant DNA
barcode.PLos ONE6:e19254DOI 10.1371/journal.pone.0019254.
Huson DH, Scornavacca C. 2012.Dendroscope 3: an interactive tool for rooted phyloge-netic trees and networks.Systematic Biology61:1061–1067DOI 10.1093/sysbio/sys062.
Khanuja SPS, Shasany AK, Darokar MP, Kumar S. 1999.Rapid isolation of DNA from dry and fresh samples of plants producing large amounts of sec-ondary metabolites and essential oils.Plant Molecular Biology Reporter 17:1–7
DOI 10.1023/A:1007528101452.
Kimura M. 1980.A simple method for estimating evolutionary rates of base substitutions through comparative studies of nucleotide sequences.Journal of Molecular Evolution
16:111–120.
Kress WJ, Erickson DL. 2007.A two locus global DNA barcode for land plants: The
codingrbcLgene complements the noncodingtrnH-psbAspacer region.PLoS ONE
2:e508DOI 10.1371/journal.pone.0000508.
Kress WJ, Wurdack KJ, Zimmer EA, Weigt LA, Janzen DH. 2005.Use of DNA barcodes to identify flowering plants.Proceedings of the National Academy of Sciences of the United States of America102:8369–8374DOI 10.1073/pnas.0503123102.
Lahaye R, Van der Bank M, Bogarin D, Warner J, Pupulin F, Gigot G, Maurin O, Duthoit S, Barraclough TG, Savolainen V. 2008.DNA barcoding the floras of biodiversity hotspots.Proceedings of the National Academy of Sciences of the United States of America105:2923–2928DOI 10.1073/pnas.0709936105.
Li X, Yang Y, Henry RJ, Rosseto M, Wang Y, Chen S. 2015.Plant DNA barcoding: from gene to genome.Biological Reviews90:157–166DOI 10.1111/brv.12104.
Little DP, Stevenson DW. 2007.A comparison of algorithms for the identification of
specimens using DNA barcodes: examples from gymnosperms.Cladistics23:1–21
DOI 10.1111/j.1096-0031.2006.00126.
Meier R, Shiyang K, Vaidya G, Ng PK. 2006.DNA barcoding and taxonomy in Diptera: a tale of high intraspecific variability and low identification success.Systematic Biology
55:715–728DOI 10.1080/10635150600969864.
Meier R, Zhang G, Ali F. 2008.The use of mean instead of smallest interspecific distances exaggerates the size of the barcoding gap and leads to misidentification.Systematic Biology57:809–813DOI 10.1080/10635150802406343.
Meyer CP, Paulay G. 2005.DNA barcoding: error rates based on comprehensive sampling.PLoS Biology3:e422DOI 10.1371/journal.pbio.0030422.
Mishra P, Kumar A, Nagireddy A, Mani D, Shukla AK, Tiwari R, Sundaresan V. 2016.
DNA barcoding: an efficient tool to overcome authentication challenges in the herbal market.Plant Biotechnology Journal14:8–21DOI 10.1111/pbi.12419.
Mohanty S, Das AB, Gosh N, Panda BB, Smithe DW. 2010.Genetic diversity of 28 wild species of fodder legumeCassiausing RAPD, ISSR and SSR markers: a novel breeding strategy.Journal of Biological Research2:44–55.
Nilsson RH, Ryberg M, Kristiansson E, Abarenkov K, Larsson KH, Koljalg U. 2006.
Taxonomic reliability of DNA sequences in public sequence databases: a fungal
perspective.PLoS ONE1:e59DOI 10.1371/journal.pone.0000059.
Pang X, Song J, Zhu Y, Xie C, Chen S. 2010.Using DNA barcoding to identify species
within Euphorbiaceae.Planta Medica76:1784–1786DOI 10.1055/s-0030-1249806.
authentication tool to differentiate medicinalCassiaspecies in India.Genetics and Molecular Research13:2959–2968DOI 10.4238/2014.April.16.4.
Rambaut A. 2014.FigTree v1.4.2.Available athttp:// tree.bio.ed.ac.uk/ software/ figtree/.
Rambaut A, Suchard MA, Xie D, Drummond AJ. 2014.Tracer v1.6.Available athttp: // beast.bio.ed.ac.uk/ Tracer.
Sandionigi A, Galimberti A, Labra M, Ferri E, Panunzi E, DeMattia F, Casiraghi M. 2012.Analytical approaches for DNA barcoding data-how to find a way for plants? Plant Biosystems146:805–813DOI 10.1080/11263504.2012.740084.
Savolainen V, Cowan RS, Vogler AP, Roderick GK, Lane R. 2005.Towards writ-ing the encyclopaedia of life: an introduction to DNA barcodwrit-ing.Philosophical Transactions of the Royal Society of London B: Biological Sciences360:1805–1811 DOI 10.1098/rstb.2005.1730.
Seethapathy GS, Ganesh D, Santhosh Kumar JU, Senthilkumar U, Newmaster SG, Ragupathy S, Shaanker RU, Ravikanth G. 2014.Assessing product adulteration in natural health products for laxative yielding plants,Cassia,Senna, andChamaecrista in Southern India using DNA barcoding.International Journal of Legal Medicine
129(4):693–700DOI 10.1007/s00414-014-1120-z.
Singh V. 2001.Monograph on Indian subtribe Cassinae (Cesalpiniaceae). Jodhpur: Scientific Publisher.
Swofford DL. 2003.PAUP*: phylogenetic analysis using parsimony (* and other methods), version 4.0b10. Sunderland: Sinauer.
Tamura K, Stecher G, Peterson D, Filipski A, Kumar S. 2013.MEGA6: molecular evolu-tionary genetics analysis version 6.0.Molecular Biology and Evolution30:2725–2729 DOI 10.1093/molbev/mst197/.
Vijayan K, Tsou CH. 2010.DNA barcoding in plants: taxonomy in a new perspective. Current Science India99:1530–1541.
Wang XC, Liu C, Huang L, Bengtsson-Palme J, Chen H, Zhang JH, Cai D, Li JQ. 2014.
ITS1: a DNA barcode better than ITS2 in eukaryotes?Molecular Ecology Resources
DOI 10.1111/1755-0998.12325.
Xu S, Li D, Li J, Xiang X, Jin W, Huang W, Xiaohua J, Huang L. 2015.Evaluation of
the DNA Barcodes inDendrobium(Orchidaceae) from Mainland Asia.PLoS ONE
10:e0115168DOI 10.1371/journal.pone.0115168.
Yadav P, Koul KK, Srivastava N, Mendki MJ, Bhagyawant SS. 2016.ITS-PCR sequenc-ing approach deciphers molecular phylogeny in chickpea.Plant BiosystemsEpub
ahead of print May 27 2016DOI 10.1080/11263504.2016.1179694.
Yan HF, Liu YJ, Xie XF, Zhang CY, Hu CM, Hao G, Ge XJ. 2015.DNA barcoding evaluation and its taxonomic implications in the species rich genusPrimulaL. in
China.PLoS ONE10:e0122903DOI 10.1371/journal.pone.0122903.
Yan LJ, Liu J, Moller M, Zhang L, Zhang XM, Li DZ, Gao LM. 2014.DNA barcoding of Rhododendron(Ericaceae), the largest Chinese plant genus in biodiversity hotspots
of the Himalaya-Hengduan Mountains.Molecular Ecology Resources15(4):932–944
Yang JB, Wang YP, Möller M, Gao LM, Wu D. 2012.Applying plant DNA barcodes to identify species ofParnassia(Parnacciaceae).Molecular Ecology Resources
12:267–275DOI 10.1111/j.1755-0998.2011.03095.
Zhang D, Duan L, Zhou N. 2014.Application of DNA barcoding inRoscoea (Zingib-eraceae) and a primary discussion on taxonomic status ofRoscoea cautleoidesvar. Pubescens.Biochemical Systematics and Ecology52:14–19