Phylogenetic autocorrelation and evolutionary diversity of Carnivora
(Mammalia) in Conservation Units of the New World
Natália Mundim Tôrres
1and José Alexandre Felizola Diniz-Filho
1,2 1Universidade Federal de Goiânia, Instituto de Ciências Biológicas, Departamento de Biologia Geral,
Goiânia, GO, Brazil.
2
Visiting Professor, Universidade Católica de Goiás, Departamento de Biologia, Goiânia, GO, Brazil..
Abstract
One of the main concerns of Conservation Biology is the identification of priority areas for conservation, and the development of quantitative methods is important to achieve this task. Many phylogenetic diversity indexes and higher-taxon approaches have been used in this context. In this study, Faith’s phylogenetic indexes and the number of evolutionary independent lineages of Carnivora were calculated at the average patch level based on phylogenetic autocorrelation analysis of phenotypic traits, in 18 conservation units in America (frequently National Parks). Despite controversies about the hierarchical level to be adopted, the characters included in this study suggest that the family level produces independent units for the analysis of phenotypic diversity in Carnivora. A positive correlation between species richness and the number of evolutionary independent lineages appeared (r = 0.67; p < 0.05), showing that this is a valid criterion to priorize conservation areas. Faith’s phylogenetic diversity index is also highly correlated with species richness (r = 0.87; p < 0.05), as well as with the number of evolutionary independent lineages (r = 0.89; p < 0.05). Thus, the conservation units with more species have also more evolutionary information to be preserved.
Key words: phylogenetic autocorrelation, Carnivora, conservation units, New World. Received: April 24, 2003; Accepted: February 16, 2004.
Introduction
One of the problems conservationists face nowadays is how to identify the most important areas for biodiversity quickly and cheaply. Biodiversity is not only difficult to de-fine, but sadly there is also a lack of basic fine-scale data on the distribution of organisms, and these are potentially very expensive to acquire in sufficient quantity (Williams and Gaston, 1994). Inevitably, it will not be possible to save ev-erything everywhere, so the conservation of biodiversity will have to be based on priority areas or targeted to some species or ecosystems. Consequently, we should be able to measure the contribution of an area and/or species to the overall pattern of biodiversity (May, 1990), preferably summarized by a simple univariate measure.
The establishment of priorities for biodiversity con-servation has been one of the main tasks of Concon-servation Biology. Considering the increasing loss of species and the availability of human and financial resources, some criteria must be used to establish these priorities for the protection of species and communities (Primack and Rodrigues,
2001). Some of the most commonly adopted criteria to establish these priorities are:
1 -usefulness- species that have an actual or potential value are considered more important than species without an evident use for humans;
2 -endangerment- species endangered of extinction cause more concern than those which are not threatened;
3 -distinctiveness- a biological community is consid-ered most relevant when composed basically of rare en-demic species or species which are evolutionarily important.
Scientists and politicians alike agree that a global pri-ority list of biological diversity preservation centers is re-quired (see Myers et al., 2000). Diversity has generally been measured only in terms of species richness, or in the form of indices combining richness with abundance. Yet, such measurements may be considered inadequate for many purposes, and other indices were proposed, based on the information content of cladistic classifications and tax-onomic distinctness measures (Vane-Wrightet al., 1991).
The development of quantitative methods for the as-signment of priorities or weights to taxa in conservation evaluation (Vane-Wrightet al., 1991; Faith, 1992) has been based on the fundamental principle of complementarity Send correspondence to José Alexandre Felizola Diniz-Filho.
Universidade Federal de Goiânia, Instituto de Ciências Biológicas, Departamento de Biologia Geral, Caixa Postal 131, 74001-970 Goiânia, GO, Brazil. E-mail: [email protected].
among taxa. The weight of priority for a given species will not be as high, if a closely related species is already pro-tected. On the other hand, a species that is “unique”,i.e., is representing a whole family, for example, is highly signifi-cant and of great value (Faith, 1994).
In this context, some studies started to show concern with the quantity of evolutionary information that would be preserved, which is directly related with the evolutionary patterns of the group (Faith, 1992, 1994; Crozier, 1997; Crandallet al., 2000; Sechrest, 2002). Many phylogenetic diversity indexes were proposed for the establishment of prioritary conservation areas, showing which of them had greater phylogenetic variation. However, these indexes as-sume that the more distinctive a species are more important. This, however, depends on the phenotype to be conserved, because a linear relationship with time is valid only if the character evolves according to a neutral model. As pheno-types, however, normally do not evolve this way (Owens and Bennett, 2000), other indexes or corrections of existing indexes should be proposed and evaluated.
In this study, we compared several conservation units in America, based on species lists of carnivore mammals. The number of lineages obtained from a phylogeny as an expression of evolutionary diversity was used as a measure of the phylogenetic diversity (higher-taxon approach) (Williams and Gaston, 1994; Grelle, 2002). Thus, the num-ber of lineages was not defined in an arbitrary way, rather reflecting the average level at which phenotypes of a spe-cies become independent and furnish more information about the evolutionary processes of phenotypic diversifica-tion.
Material and Methods
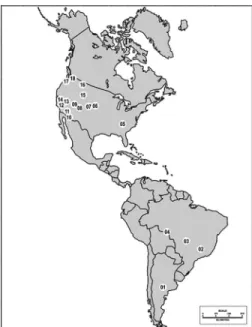
Species lists of carnivore mammals (order Carnivora) from 18 conservation units (frequently National Parks) in North, Central and South America were obtained from the website “Species in Parks: Flora and Fauna Database” (Fig-ure 1). Only parks with over 100.000 ha were considered for this study. To analyze the phylogenetic patterns of phenotypic evolution that were going to be used to estimate the phylogenetic patch (see below), we compiled 23 eco-logical, morphological and life-history traits for the 70 spe-cies of carnivore mammals living in North, Central and South America, obtained from the specialized literature (Burt and Grossenheider, 1980; Eisenberg, 1989; Chapman and Feldhamer, 1990; Gittleman, 1985, 1986a,b, 1991; Redford and Eisenberg, 1992, 1999; Wilson and Reeder, 1993; Emmons, 1997) (Table 1). The phylogenetic patterns of these variables were analyzed by phylogenetic correlograms (Gittleman and Kot, 1990; Gittlemanet al., 1996; Diniz-Filho, 2001; Diniz-Filho and Tôrres, 2002).
Phylogenetic correlograms express the variations in similarity between pairs of species as a function of the di-vergence time between them, and they were constructed us-ing Moran’s coefficients. The phylogeny used as a base for
Figure 1- Map with the location of the conservation units considered in this study.
Table 1- Ecologic variables studied for Carnivora species in the New World, the respective number of species for which trait data was available, phylogenetic patch (in millions of years, m.y.) and the correlogram profile (see text for details).
Traits N. species Patch (m.y.) Profiles
Body weight 70 32.9 I
Geographic range 70 0.0 IV
Female brain weight 29 36.1 I
Average brain weight of adult male and adult female
38 39.0 I
Litter size 35 33.0 II
Gestation length 31 0.0 IV
Birth weight 25 0.0 III
Weaning age 21 0.0 IV
Longevity 13 0.0 IV
Age of sexual maturity 22 36.20 I
Inter-birth interval 20 0.0 IV
Body length 43 39.7 I
Parental care 19 44.8 II
Eyes open 23 29.0 II
Day range length 13 0.0 IV
Number of prey 18 0.0 III
Average height of olfactory bulb 42 39.2 I
Average width of olfactory bulb 42 0.0 III
Average length of olfactory bulb 42 37.0 I
Average skull length of adult male and female
31 39.3 I
Basicranial axis length 31 0.0 III
Average home range size of adult male and female
18 0.0 IV
calculating distances was a supertree constructed by com-bining all the available evidence from morphological, be-havioral and molecular data, recently established by Bininda-Emondset al.(1999).
Using the correlograms for each variable, it was pos-sible to determine at which level the species become phylo-genetically independent from each other along the phylogeny (phylogeneticpatch-Diniz-Filho, 2001). Thus, from that distance on, it is not possible, knowing the value of this character for one species, to predict values for other related species.
The significance of correlograms was established us-ing Bonferroni’s criterion, which suggests that the correlogram can be considered significant if one of its Moran’s coefficients is significant at theα/k level, where k is the number of classes of distance. A significant correlogram shows that there is a phylogenetic pattern for the character analyzed, whereas correlograms that are not significant show that the character value is randomly dis-tributed among the different species. Therefore, patches different from zero were defined only for the statistically significant correlograms, and an average value was calcu-lated to find the general patch for the phenotype as a whole.
Using this average patch size, it was possible to find the number of lineages (SL) for the 18 parks by means of a phylogenetic supertree. A park with a large SL contains more diversified phenotypes at this specific phylogenetic patch. Thus, differently from previous papers using this higher-taxon approach (see Grelle, 2002 for a recent re-view), in this study the temporal line used to establish the number of lineages was based on the phylogenetic autocorrelation analysis of the phenotypic characters.
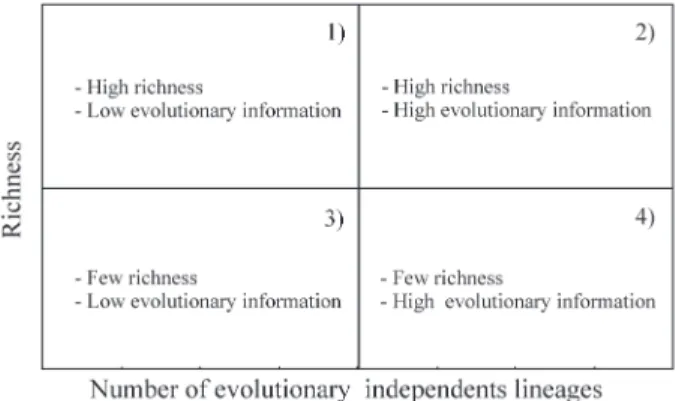
The relationship between species richness (S) and lin-eage richness (SL) at a given patch creates a bivariate space that can be divided (arbitrarily or based on mean S or SL values) into four quadrants (Figure 2). Conservation units that are inside the second quadrant have high richness and high evolutionary information and are, therefore, the most important ones for the conservation of the group consid-ered. Conservation units in the third quadrant are the less important ones, because of their small richness and little evolutionary information. The quadrants one and four com-prise areas of intermediary importance for conservation.
For each conservation unit, Faith’s phylogenetic di-versity index (PD) (Faith, 1992, 1994), given by the sum of lengths of all branches connecting the species present in each one, was also calculated:
PD bk
k
=
∑
where bkis the length of the k branches of the phylogeny, in
millions of years. Thus, assuming different models of phe-notype evolution, it is possible to determine which units preserve a great amount of the evolutionary diversity of the group considered, by correlating the species richness,
Faith’s index, and the number of lineages at a given phylo-genetic patch.
Results
The phylogenetic correlograms for each of the 23 characters studied showed distinct phylogenetic variation profiles and, consequently, different patch values. The correlograms can be visually grouped into four profiles (see Diniz-Filho, 2000):
I. Clinal with stabilization, when there are only posi-tive autocorrelations in the first distance classes, that de-crease and afterwards stabilize;
II. Clinal correlograms with positive and negative autocorrelations in the first and last distance classes, re-spectively, with values decreasing linearly or monotonically, showing a gradient pattern across the phy-logeny;
III. Long-distance differentiation, with negative autocorrelations only in the last distance classes, showing that the most distantly related species have a tendency to be the most distinct in the total sample. In this case, patch size is set to zero, since closely related species tend to be inde-pendent for the character analyzed;
IV. Correlograms without a significant pattern, show-ing that the character variability is randomly distributed along the phylogeny, so there is no phylogenetic pattern (patch size is then zero, and the number of lineages con-verges to the number of species).
Out of the 23 characters analyzed, 11 exhibited Types III and IV profiles (Table 1), with a phylogenetic patch equal to zero. The estimated average patch for all profiles was 18.8 millions of years.
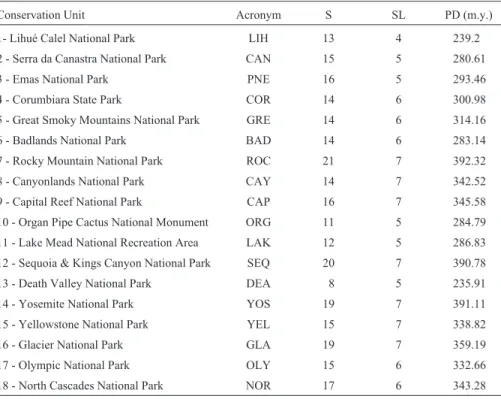
Species richness ranged from 8 in Death Valley Na-tional Park up to 21 in Rocky Mountain NaNa-tional Park, while PD values ranged from 235.91 m.y. up to 392.32 m.y. in the same parks, respectively. Using a cutoff time of 18.8 millions of years across the phylogenetic supertree, the number of lineages ranged from four (in Lihué Calel Na-tional Park) to seven, in other parks (Table 2).
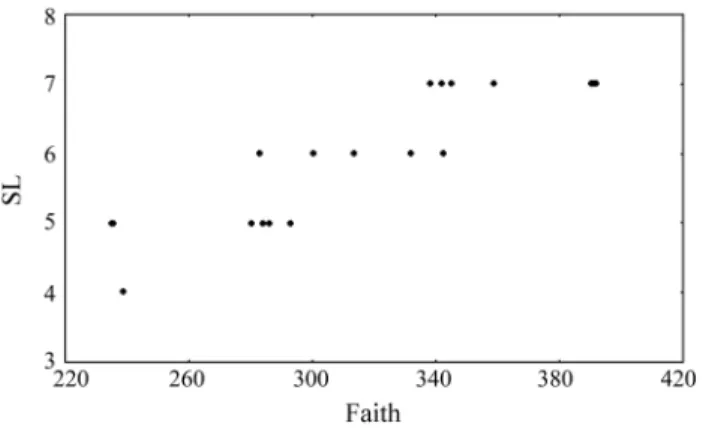
The correlation between the number of evolutionary independent lineages (SL) and the species richness (S) in the 18 conservation units considered in this study was nificant (r = 0.67; p < 0.05) (Figure 3). There were also sig-nificant correlations between the phylogenetic diversity expressed by Faith’s index and species richness (r = 0.89; p < 0.05) and the number of evolutionary independent lin-eages at 18.8 millions of years (r = 0.87; p < 0.05) (Figures 4 and 5, respectively).
Twelve of the conservation units analyzed (67%) fell into the second quadrant defined in Figure 2, therefore be-ing of great importance for the conservation of New World carnivores. Under the model of phenotypic evolution estab-lished by phylogenetic autocorrelation analysis, the conser-vation units which preserved a greater quantity of evolutionary diversity in relation to richness, for the Carnivora, are Rocky Mountain National Park, Sequoia & Kings Canyon National Park, Glacier National Park, Yo-semite National Park, Capital Reef National Park, Yellow-stone National Park, and Canyonlands National Park, all situated in the United States.
By the same criterion, four areas were considered of low relevancy (present only in the third quadrant): Lihué Calel National Park, Lake Mead National Recreation Area, Organ Pipe Cactus National Monument, and Death Valley National Park. Finally, two were of intermediary impor-tance: Emas National Park and Serra da Canastra National Park, in Brazil (see Figure 3).
Discussion
Ideally, the study of biodiversity patterns should be carried out using species-based datasets, including, utopically, genetic knowledge of organisms at the popula-tion level. However, this would require an unpredictable amount of time, and, in some cases, the higher-taxon ap-proach can be a shortcut (Grelle, 2002). The use of higher-taxon richness as an estimate of wholesale biodiversity ap-pears attractive, because it should be substantially cheaper to identify specimens from survey samples to the level of higher-taxon than to the level of species. If a relationship can be demonstrated, then it might be possible to use the
Table 2- Species richness (S) present in each of the conservation units considered in this study, with the respective numbers of lineages (SL) for a patch of 18.8 millions of years and Faith’s phylogenetic diversity index (1992), in millions of years (PD).
Conservation Unit Acronym S SL PD (m.y.)
1- Lihué Calel National Park LIH 13 4 239.2
2 - Serra da Canastra National Park CAN 15 5 280.61
3 - Emas National Park PNE 16 5 293.46
4 - Corumbiara State Park COR 14 6 300.98
5 - Great Smoky Mountains National Park GRE 14 6 314.16
6 - Badlands National Park BAD 14 6 283.14
7 - Rocky Mountain National Park ROC 21 7 392.32
8 - Canyonlands National Park CAY 14 7 342.52
9 - Capital Reef National Park CAP 16 7 345.58
10 - Organ Pipe Cactus National Monument ORG 11 5 284.79
11 - Lake Mead National Recreation Area LAK 12 5 286.83
12 - Sequoia & Kings Canyon National Park SEQ 20 7 390.78
13 - Death Valley National Park DEA 8 5 235.91
14 - Yosemite National Park YOS 19 7 391.11
15 - Yellowstone National Park YEL 15 7 338.82
16 - Glacier National Park GLA 19 7 359.19
17 - Olympic National Park OLY 15 6 332.66
18 - North Cascades National Park NOR 17 6 343.28
spatial distribution of higher-taxon richness to estimate the distribution of species richness more widely (Williams and Gaston, 1994).
However, the choice of the higher hierarchical level to be adopted is arbitrary (Williams and Gaston, 1994). In this study, this level was based on phylogenetic autocorrelation analyses of phenotype characters, indicat-ing that a cut level of nearly 18.8 millions of years produced approximately independent units, considering the average model of phenotype diversification. For Carnivora, this time level corresponds to the taxonomic level of families.
As demonstrated in this study by the high correlation between species richness and the number of evolutionary independent lineages at the medium patch level, the utiliza-tion of the latter criterion is valid for the determinautiliza-tion of areas with greater evolutionary diversity and greater impor-tance for the conservation of evolutionary processes, but also considering the point of view of the phenotype (Crandallet al.,2000; Owens and Bennett, 2000). Further-more, the higher-taxon approach, as defined by the cutoff point under autocorrelation analyses of phenotypic diversi-fication, is correlated with the phylogenetic information in-dex as proposed by Faith (1992). This inin-dex is widely
recognized as an effective solution where limited resources imply that priorities must be placed on the conservation of different species, and it was indeed used to establish priori-ties for Carnivora and Primate conservation in biodiversity hotspots worldwide (Sechrestet al., 2002). However, the advantage of the higher-taxon approach used here is that its scale of measurement (i.e., the number of lineages - SL) is more familiar and intuitive, and directly linked with the common approach based on species richness.
Using evolutionary measurements, based both on pure phylogenetic neutral molecular variation or on more complex phenotypic evolution models, is certainly a strat-egy that may circumvent the sometimes arbitrary decisions about which taxonomic units are to be the basis for conser-vation efforts. It puts less emphasis on `counting up’ taxo-nomic units and more on representativeness of a cladistic hierarchy and, consequently, on the evolutionary pro-cesses. The emphasis is on preserving as much of this hier-archical variation as possible, no matter what the taxonomic units involved (Faith, 1992). For New World Carnivora, our analyses showed a high correlation between the two evolutionary diversity measurements (higher-taxon and Faith’s index) and species richness. Thus, conservation units with more species should, in general, contain more evolutionary information. When this is the case, decisions about priorities are easy, and counting species can also be informative with regard to evolutionary processes.
However, it is important to note that the occupation of the bivariate space formed by richness and evolutionary di-versity measurements depends greatly on how the diversifi-cation and colonization processes occurred across history. In some instances, there may be combinations of units, or geographic areas, containing a few species which are highly diversified in evolutionary time. This will occur es-pecially if the speciation and extinction processes in differ-ent clades are not randomly in relation to some phenotypic structures. In this case, a more detailed analysis of these bivariate spaces, as showed here, may be necessary when dealing with larger taxonomic groups, as well as the evalua-tion of more conservaevalua-tion units with more diversified fau-nas, allowing to define units that must contain, simultaneously, greater phenotypic evolutionary diversity and high species richness.
Acknowledgements
We thank L. Silveira for providing park reference. Our research program in population biology and evolu-tionary ecology has continuously been supported by Con-selho Nacional de Desenvolvimento Científico e Tecnológico (CNPq), Fundação de Apoio à Pesquisa Uni-versidade Federal de Goiás (FUNAPE/UFG) and Jaguar Conservation Fund/Conservation International, through several grants.
Figure 5- Relationship between Faith’s phylogenetic diversity index and the number of evolutionary independent lineages at 18.8 millions of years, for the 18 conservation units.
References
Bininda-Emonds ORP, Gittleman JL and Purvis A (1999) Build-ing large trees by combinBuild-ing phylogenetic information: A complete phylogeny of the extant Carnivora (Mammalia). Biol Rev 74:143-175.
Burt WH and Grossenheider RP (1980) A Field Guide to the Mammals. 3rd. edition. Houghton Mifflin Company, Boston and New York, 271 pp.
Chapman JA and Feldhamer GA (1990) Wild Mammals of North America. The Johns Hopkins University Press, Baltimore and London, 1147 pp.
Crandall KA, Bininda-Emonds ORP, Mace GM and Wayne RK (2000) Considering evolutionary processes in conservation biology. Trends Ecol Evol 15:290-295.
Crozier RH (1997) Preserving the information content of species: Genetic diversity, phylogeny and conservation worth. Annu Rev Ecol Syst 28:243-268.
Diniz-Filho JAF (2000) Métodos Filogenéticos Comparativos. Holos Editora, Ribeirão Preto, 120 pp.
Diniz-Filho JAF (2001) Phylogenetic autocorrelation under dis-tinct evolutionary processes. Evolution 55:1104-1109.
Diniz-Filho JAF and Tôrres NM (2002) Phylogenetic compara-tive methods and the geographic range size - body size rela-tionship in new world terrestrial carnivora. Evol Ecol 16:351-367.
Eisenberg JF (1989) Mammals of the Neotropics. v. 1. University of Chicago Press, Chicago, 449 pp.
Emmons LH (1997) Neotropical Rainforest Mammals: A Field Guide. 2nd edition. University of Chicago Press, Chicago, 307 pp.
Faith DP (1992) Conservation evaluation and phylogenetic diver-sity. Biol Conserv 61:1-10.
Faith DP (1994) Genetic diversity and taxonomic priorities for conservation. Biol Conserv 68:69-74.
Gittleman JL (1985) Carnivore body size: Ecological and taxo-nomic correlates. Oecologia 67:540-554.
Gittleman JL (1986a) Carnivore life history patterns: Allometric, phylogenetic, and ecological associations. Am Nat 127:744-771.
Gittleman JL (1986b) Carnivore brain size, behavioral ecology, and phylogeny. J Mammal 67:23-36.
Gittleman JL and Kot M (1990) Adaptation: Statistics and a null model for estimating phylogenetic effects. Syst Zool 39:227-241.
Gittleman JL (1991) Carnivore olfactory bulb size: Allometry, phylogeny and ecology. J Zool 225:253-272.
Gittleman JL, Anderson CG, Kot, M and Luh H-K (1996) Phylo-genetic lability and rates of evolution: A comparison of be-havioral, morphological and life-history traits. In: Martins, EP (ed) Phylogenies and the Comparative Method in Ani-mal Behavior. Oxford University Press, Oxford, pp 166-205.
Grelle CEV (2002) Is higher-taxon analysis a useful surrogate of species richness in studies of Neotropical mammal diver-sity? Biol Conserv 108:101-106.
May RM (1990) Taxonomy as destiny. Nature 347:129-130. Myers N, Mittermeier RA, Mittermeier CG, Fonseca GAB and
Kent J (2000) Biodiversity hotspots for conservation priori-ties. Nature 403:853-858.
Owens IPF and Bennett PM (2000) Quantifying biodiversity: A phenotypic perspective. Conserv Biol 14:1014-1022. Primack RB and Rodrigues E (2001) Biologia da Conservação.
Editora Planta, Londrina, 328 pp.
Redford KH and Eisenberg JF (1992) Mammals of the Neotropics. v. 2. University of Chicago Press, Chicago, 450 pp.
Redford KH and Eisenberg JF (1999) Mammals of the Neotropics. v. 3. University of Chicago Press, Chicago, 610 pp.
Sechrest W, Brooks TM, Fonseca GAB, Konstant WR, Mittermeier RA, Purvis A, Rylands AB and Gittleman JL (2002) Hotspots and the conservation of evolutionary his-tory. P Natl Acad Sci USA 99:2067-2071.
Vane-Wright RI, Humphries CJ and Williams PH (1991) What to protect? Systematics and the agony of choice. Biol Conserv 55:235-254.
Williams PH and Gaston KJ (1994) Measuring more of biodiversity: Can higher-taxon richness predict wholesale species richness? Biol Conserv 67:211-217.
Wilson DE and Reeder DM (1993) Mammal species of the world: A taxonomic and geographic reference. 2nd edition. Smith-sonian Inst. Press, Washington, 1207 pp.
Species in Parks: Flora and Fauna Database, Online Query Sys-tem; site http://ice.ucdavis.edu/nps/sbypark.html, accessed on 18 March 2002.