Spatial and Temporal Heterogeneity in
High-Grade Serous Ovarian Cancer: A Phylogenetic
Analysis
Roland F. Schwarz1¤, Charlotte K. Y. Ng1,2, Susanna L. Cooke1, Scott Newman1,
Jillian Temple1, Anna M. Piskorz1, Davina Gale1, Karen Sayal1, Muhammed Murtaza1, Peter J. Baldwin3, Nitzan Rosenfeld1,2, Helena M. Earl2,4, Evis Sala5, Mercedes Jimenez-Linan3, Christine A. Parkinson1,2, Florian Markowetz1,2*, James D. Brenton1,2*
1Cancer Research UK Cambridge Institute, University of Cambridge, Cambridge, United Kingdom, 2Department of Oncology, Hutchison/MRC Research Centre, University of Cambridge, Cambridge, United Kingdom,3Cambridge University Hospitals NHS Foundation Trust, Cambridge, United Kingdom, 4NIHR Cambridge Biomedical Research Centre, Cambridge, United Kingdom,5University Department of Radiology, Addenbrooke’s Hospital, Cambridge, United Kingdom
¤ Current address: European Molecular Biology Laboratory, European Bioinformatics Institute, Hinxton, United Kingdom
*[email protected](FM);[email protected](JDB)
Abstract
Background
The major clinical challenge in the treatment of high-grade serous ovarian cancer (HGSOC) is the development of progressive resistance to platinum-based chemotherapy. The objec-tive of this study was to determine whether intra-tumour genetic heterogeneity resulting from clonal evolution and the emergence of subclonal tumour populations in HGSOC was associated with the development of resistant disease.
Methods and Findings
Evolutionary inference and phylogenetic quantification of heterogeneity was performed using the MEDICC algorithm on high-resolution whole genome copy number profiles and selected genome-wide sequencing of 135 spatially and temporally separated samples from 14 patients with HGSOC who received platinum-based chemotherapy. Samples were ob-tained from the clinical CTCR-OV03/04 studies, and patients were enrolled between 20 July 2007 and 22 October 2009. Median follow-up of the cohort was 31 mo (interquartile range 22–46 mo), censored after 26 October 2013. Outcome measures were overall survival (OS) and progression-free survival (PFS). There were marked differences in the degree of clonal expansion (CE) between patients (median 0.74, interquartile range 0.66–1.15), and dichoti-mization by median CE showed worse survival in CE-high cases (PFS 12.7 versus 10.1 mo,p= 0.009; OS 42.6 versus 23.5 mo,p= 0.003). Bootstrap analysis with resampling showed that the 95% confidence intervals for the hazard ratios for PFS and OS in the CE-high group were greater than 1.0. These data support a relationship between heterogeneity and survival but do not precisely determine its effect size. Relapsed tissue was available for
a11111
OPEN ACCESS
Citation:Schwarz RF, Ng CKY, Cooke SL, Newman
S, Temple J, Piskorz AM, et al. (2015) Spatial and Temporal Heterogeneity in High-Grade Serous Ovarian Cancer: A Phylogenetic Analysis. PLoS Med 12(2): e1001789. doi:10.1371/journal.pmed.1001789
Editor:Christopher Kemp, Fred Hutchinson Cancer
Research Center, UNITED STATES
Received:July 5, 2013
Accepted:January 8, 2015
Published:February 24, 2015
Copyright:© 2015 Schwarz et al. This is an open
access article distributed under the terms of the
Creative Commons Attribution License, which permits unrestricted use, distribution, and reproduction in any medium, provided the original author and source are credited.
Data Availability Statement:All relevant clinical
data and analyses are within the paper and its Supporting Information files. Array data is available at the NCBI Gene Expression Omnibus under accession number GSE40546.http://www.ncbi.nlm. nih.gov/geo/query/acc.cgi?acc=GSE40546
Funding:This work was supported by Cancer
two patients in the CE-high group, and phylogenetic analysis showed that the prevalent clonal population at clinical recurrence arose from early divergence events. A subclonal population marked by aNF1deletion showed a progressive increase in tumour allele frac-tion during chemotherapy.
Conclusions
This study demonstrates that quantitative measures of intra-tumour heterogeneity may have predictive value for survival after chemotherapy treatment in HGSOC. Subclonal tu-mour populations are present in pre-treatment biopsies in HGSOC and can undergo expan-sion during chemotherapy, causing clinical relapse.
Introduction
Intra-tumour genetic heterogeneity in cancer has been investigated for almost half a century [1,2], and recent advances in genomic technology have demonstrated diverse genetic changes within a single epithelial cancer [3–14]. Multiple sampling of primary and metastatic sites in breast, pancreas, and renal carcinoma has catalogued genetic divergence and shown that me-tastases from the same site can show organ-specific phylogenetic branches [5–8,12]. Deep se-quencing of epithelial tumours has revealed the clonal compositions of individual clinical samples and has shown how major and minor subclones may co-exist [5,7,8,12,14,15]. These data extend earlier observations showing that there is significant intra-tumour heterogeneity in solid tumours, and suggest that tumours with sufficient heterogeneity may be able to explore the fitness landscape widely enough during selection pressure from chemotherapy to repopu-late with a resistant subclone [16,17]. Although this phenomenon has been extensively demon-strated in haematological cancers [18,19], the sequence of clonal expansions (CEs) has not been comprehensively described in epithelial tumours or correlated with clinical outcome.
High-grade serous ovarian cancer (HGSOC) is genomically characterised by a ubiquitous
TP53mutation, high-frequency somatic copy number alterations (CNAs), and whole genome duplications [20–22]. Oncogenic mutations are rare, and most nonsynonymous changes are seen in tumour suppressor genes, including somatic mutations inTP53,BRCA1,BRCA2,RB1, andNF1[22]. Loss ofNF1, an inhibitor of RAS signalling, may occur by point mutation or structural rearrangement and may be present in subclonal populations [23–27]. The typical clinical presentation of HGSOC is with extensive abdominal disease, involving multiple im-plantation sites throughout the abdomen. Intra-tumour heterogeneity may contribute to ac-quired resistance in HGSOC [3,4,28–30], but quantitation of the degree of heterogeneity and its relationship to changes in the course of treatment or the development of resistance is unknown.
Accurately reconstructing the evolutionary history of cancer cells in an unbiased manner improves the quantification of tumour heterogeneity. However, inferring phylogenetic trees in cancers that have highly frequent somatic CNAs is particularly difficult because of the un-known phasing of parental alleles and the horizontal dependencies between adjacent genomic loci. Previous work has used ad hoc thresholds or visual analysis [15,31]. We recently devel-oped the Minimum Event Distance for Intra-tumour Copy Number Comparisons (MEDICC) algorithm, which provides accurate estimates of evolutionary distances between tumour sam-ples by determining the optimum phasing of major and minor alleles from copy number or
Medical Sciences, the Wellcome Trust, British Heart Foundation and Arthritis Research UK. The Human Research Tissue Bank is supported by the NIHR Cambridge Biomedical Research Centre. The funders had no role in study design, data collection and analysis, decision to publish, or preparation of the manuscript.
Competing Interests:The authors have declared
that no competing interests exist.
Abbreviations:CE, clonal expansion; CNA, copy
number alteration; HGSOC, high-grade serous ovarian cancer; HR, hazard ratio; IQR, interquartile range; MEDICC, Minimum Event Distance for Intra-tumour Copy Number
whole genome sequencing (WGS) data [32]. A numerical measure of the degree of heterogene-ity can also be derived by transforming the pairwise minimum event distances [32].
To address the hypothesis that quantitative measures of intra-tumour heterogeneity could predict outcome in HGSOC, we collected multiple spatially and temporally separated tumour samples from 14 women undergoing chemotherapy for HGSOC, and used formal methods to reconstruct the evolutionary history of the disease within each patient from whole genome copy number profiles.
Materials and Methods
Ethical Consent
Tissue samples were obtained from the prospective CTCR-OV03 and CTCR-OV04 clinical studies, which were designed to collect imaging, blood, and tissue samples for exploratory bio-marker studies. All patients provided written, informed consent for participation in these stud-ies and for the use of their donated tissue, blood specimens, and anonymized data for the laboratory studies carried out. The CTCR-OV03 and CTCR-OV04 studies were approved by the Suffolk Local Research Ethics Committee (reference 05/Q0102/160) and Cambridgeshire Research Ethics Committee (reference 08/H0306/61).
SNP Arrays
DNA extraction was performed using the DNeasy Blood & Tissue Kit (Qiagen) following the manufacturer’s instructions. In total, 177 samples from 18 patients were profiled for copy num-ber anum-berrations using Affymetrix Genome-Wide SNP 6.0 arrays (S1 Table). Hybridisation of DNA to SNP 6.0 arrays was performed by AROS Applied Biotechnology following the manu-facturer’s protocol. Array data are available online at the NCBI Gene Expression Omnibus under accession number GSE40546. The datasets were segmented using PICNIC [33] (using the“primary”option), which further corrects for cellularity and estimates integer major and minor copy numbers.
Evolutionary Inference and Tree Robustness
The MEDICC algorithm and methods for copy number reconstruction and quantification of heterogeneity have been described previously [32]. We determined the CE and temporal het-erogeneity (TH) indices as described for patients with more than three samples and where paired biopsy and surgery samples were available.
Paired-End Sequencing and Breakpoint Validation
DNA extracted from tumour samples and from matched normal blood was processed using the Illumina Paired-End Sample Prep Kit. Paired-end WGS (41 bp; in some cases 50 bp trimmed to 41 bp) was performed on the Illumina Genome Analyzer IIx, where the median number of read pairs for each library was 153 million and the median sequencing depth was ×16.7. Sequencing data were processed using analysis pipelines as previously described [34]. Briefly, reads were aligned using BWA [35] and Novoalign (Novocraft Technologies), and dis-cordantly mapped read pairs were used to identify putative structural variants using a custom pipeline. PCR primers for validating structural variants were designed using Primer3 [36].
Deletion and insertion breakpoints from WGS were considered confirmed if there was
>50% reciprocal overlap of copy number decrease or increase in the SNP array data.
confirmed if both ends of a breakpoint were within 10 kb of copy number breakpoints in any of the sequenced samples of the tumour.
Mutation Detection by Resequencing
The coding sequences ofTP53,BRCA1,BRCA2,PTEN,PIK3CA,EGFR, andAPCwere se-quenced using the TAm-Seq method using the Fluidigm Access Array 48.48 platform as de-scribed previously [37] with minor modifications: pre-amplification steps were omitted, as high-molecular-weight DNA was extracted from fresh-frozen tumour specimens, and 50 ng of sample DNA and multiplexed primers was used in the target-specific amplification step. Prim-er sequences are available upon request. Sequencing data analysis and variant vPrim-erification was performed using an in-house-developed pipeline and IGV software as previously described [37,38].
Digital PCR
Digital PCR was performed using the Fluidigm Biomark microfluidic system according to the manufacturer’s instructions. Primers were designed spanning theNF1deletion (forward: 50
-TTTTGTTTACGAGCACAGATAACC-30
; reverse: 50
-GAAACAGAAGATGACAGCAAA-GAA-30). Reaction mixes were prepared containing 1× TaqMan Gene Expression Master Mix (Applied Biosystems), 1× EvaGreen DNA binding dye (Biotium), 1× DNA Binding Dye Sam-ple Loading Reagent (Fluidigm), and 10 nM primers and template DNA. Prior to loading into a 12.765 Fluidigm digital chip, reactions were heated to 95°C for 1 min and placed on ice. Reac-tions were thermocycled at 50°C for 2 min, 95°C for 10 min, followed by 55 cycles of 95°C for 15 s and 56°C or 60°C for 1 min. Digital PCR was also performed on the same samples using an assay for the p.R175H mutation inTP53as previously described [39] (forward: 50
-CCATC-TACAAGCAGTCAC-30
; reverse: 50
-GTCACCATCGCTATCTGAG-30
; mutant-specific probe: [6FAM]-TTGTGAGGCACTGCCCCC-[BHQ1]; wild-type-specific probe: [HEX]-TTGTGAG-GCGCTGCCCCC-[BHQ1]). The proportion of tumour cells with theNF1 dele-tion was calculated from the estimated counts of the assays for both theNF1deletion and mu-tantTP53p.R175H.
Study Design
interval between the date of the original pathology report confirming ovarian cancer and the date of progression measured by RECIST 1.1, Gynecologic Cancer Intergroup CA 125 criteria, or symptomatic progression. Overall survival (OS) was defined as the interval between the date of the original pathology report confirming ovarian cancer and the date of death from any cause. Clinical details, including CA 125 measurements, stage, and residual disease after debulking surgery, were abstracted from clinical records by research staff.
Statistical Analysis Methods
A detailed transcript of all statistical analyses using R and Sweave is provided inS1 Protocol.
Results
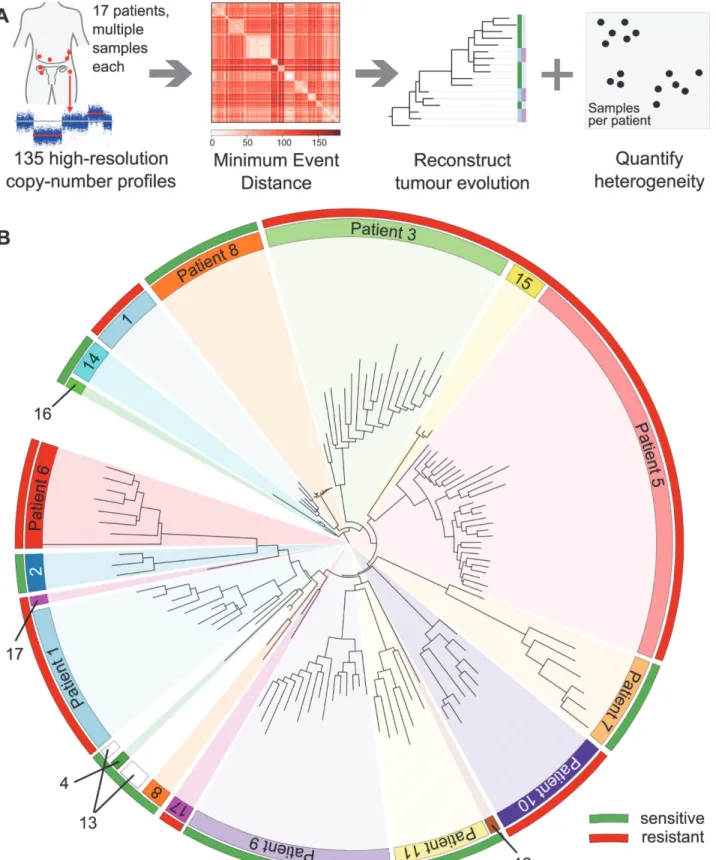
We collected 177 temporally and spatially distinct HGSOC samples from 18 patients undergo-ing platinum-based chemotherapy (Fig. 1A). Copy number profiles were obtained with Affy-metrix Genome-Wide SNP6.0 arrays (Table 1) and segmented using PICNIC [33]. Of the 18 patients, 17 had neoadjuvant chemotherapy (Table 1). The median number of chemothera-py cycles prior to interval debulking surgery was three (range 3–7). One patient had primary surgery followed by adjuvant chemotherapy. Data from 39/177 arrays were excluded after pro-filing because of tumour cellularity<50% or high noise, resulting in removal of one patient
from the analysis (6/6 samples excluded), leading to a final total of 17 patients included in the following analyses. In all, 31/39 excluded arrays were from samples obtained from interval debulking surgery following pre-operative chemotherapy (S1 Table). Analyses of clonal evolu-tion were performed using whole genome bi-allelic integer copy number profiles of 135 tumour samples from 14 patients who had3 samples. Ten patients had samples both from biopsy prior to chemotherapy treatment and from interval debulking surgery, allowing for compari-son of temporal effects. Two patients had relapsed ascites samples (S1 Table).
To exclude potential confounding effects on heterogeneity, we performed a detailed pathol-ogy review of all paraffin blocks from each patient. No significant differences in morpholpathol-ogy or growth pattern were observed between metastatic sites in any patient (S1 Fig). In addition, we performed tagged-amplicon resequencing of tumour tissue for genes commonly somatically mutated in HGSOC.BRCA1andBRCA2were also included in the sequencing panel as OS is significantly improved in women with germ line mutations. In all, 15/17 patients had a muta-tion inTP53consistent with HGSOC (Table 2) [20]. Of the two wild-typeTP53cases, patient 12 had strong nuclear p53 protein accumulation consistent with p53 dysfunction, and patient 3 was reclassified as a synchronous HGSOC and high-grade uterine serous papillary carcinoma (based on simultaneous invasive uterine and ovarian lesions together with positive WT1 immunohistochemistry). No germ line mutations inBRCA1andBRCA2were identified. Pa-tient 14 had a nonsense mutation inBRCA2, and patient 2 showed variants of uncertain signifi-cance inBRCA1somatic nonsense mutation inBRCA2, and patient 2 showed variants of uncertain significance inBRCA1andBRCA2(Table 2). We examined the copy number profiles for evidence of specific mutator phenotypes that would alter the propensity for evolutionary change, but did not find any patient with features of the tandem duplicator phenotype [34,41].
MEDICC we reconstructed evolutionary trees for 14 patients with three or more samples
(Fig. 1A). Circos plots and evolutionary trees for all patients can be found inS3–S16Figs.
Patient-Specific Copy Number Changes Cluster by Anatomical Site
As expected, CNAs were highly patient-specific. A tree reconstructed from applying MEDICC to all 135 samples grouped samples by patient (Fig. 1B). However, no clustering into subgroups with HGSOC resistant or sensitive to a second line of treatment was evident by this analysis (outer colour bar,Fig. 1B). We next applied MEDICC to each patient individually. Copy num-ber changes within each patient showed strong divergence overall, with a median of 54.5 (IQR 32.5–65.6) genomic events. Divergence from the hypothetical normal genome was, as expected, larger, with a median of 104 events (IQR 57.8–112). Three patients showed less marked changes; reconstruction of events for patients 1 and 8 had limited phylogenetic signal owing tonumber. Samples from each patient (coloured inner circular bar) cluster into clades. The outer circular bar indicates HGSOC classified as resistant versus sensitive to treatment based on survival: red, resistant, PFS<12 mo; green, sensitive, PFS>12 mo. No immediate clustering of patients into sensitive and
resistant subgroups is visible.
doi:10.1371/journal.pmed.1001789.g001
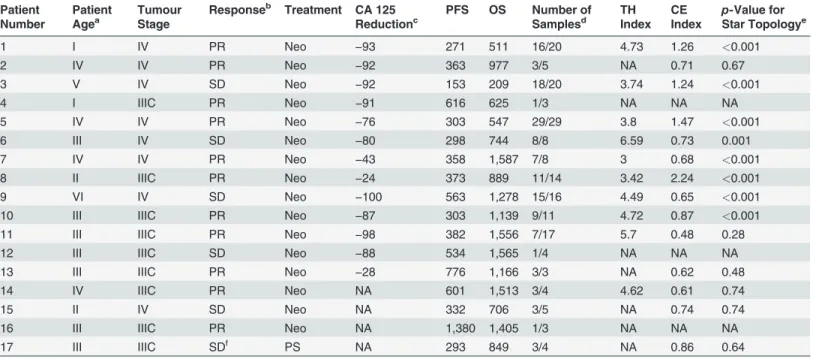
Table 1. Summary of samples from the CTCR-OV03/04 clinical studies.
Patient Number
Patient Agea
Tumour Stage
Responseb Treatment CA 125 Reductionc
PFS OS Number of Samplesd
TH Index
CE Index
p-Value for
Star Topologye
1 I IV PR Neo −93 271 511 16/20 4.73 1.26 <0.001
2 IV IV PR Neo −92 363 977 3/5 NA 0.71 0.67
3 V IV SD Neo −92 153 209 18/20 3.74 1.24 <0.001
4 I IIIC PR Neo −91 616 625 1/3 NA NA NA
5 IV IV PR Neo −76 303 547 29/29 3.8 1.47 <0.001
6 III IV SD Neo −80 298 744 8/8 6.59 0.73 0.001
7 IV IV PR Neo −43 358 1,587 7/8 3 0.68 <0.001
8 II IIIC PR Neo −24 373 889 11/14 3.42 2.24 <0.001
9 VI IV SD Neo −100 563 1,278 15/16 4.49 0.65 <0.001
10 III IIIC PR Neo −87 303 1,139 9/11 4.72 0.87 <0.001
11 III IIIC PR Neo −98 382 1,556 7/17 5.7 0.48 0.28
12 III IIIC SD Neo −88 534 1,565 1/4 NA NA NA
13 III IIIC PR Neo −28 776 1,166 3/3 NA 0.62 0.48
14 IV IIIC PR Neo NA 601 1,513 3/4 4.62 0.61 0.74
15 II IV SD Neo NA 332 706 3/5 NA 0.74 0.74
16 III IIIC PR Neo NA 1,380 1,405 1/3 NA NA NA
17 III IIIC SDf PS NA 293 849 3/4 NA 0.86 0.64
The table shows patients identified for study and the number of samples available before and after quality control. Patients with<3 samples could not be
evaluated for TH and CE indices. Patients with CE index but no TH index did not have paired pre-chemotherapy biopsy and interval debulking surgery samples available.
aPatient age was segmented into brackets as follows: I, 45
–50 y; II, 46–55 y; III, 56–60 y; IV, 61–65 y; V, 66–70 y; VI, 71–75 y.
bResponse according to RECIST evaluation: PD, progressive disease; PR, partial response; SD, stable disease. cCA 125 tumour marker reduction (percentage),
dNumber of samples used for analysis (out of all samples taken in study). eTest for star topology (BH corrected).
fNot comparable to other SD cases as treatment modalities were different.
NA, not available; Neo, neoadjuvant; PS, primary surgery.
low divergence or limited numbers of samples, and in patient 1 we found very high heterogene-ity and strong CE (discussed below).
Metastasis of HGSOC is thought to occur by physical shedding from the invasive lesions in the fallopian tube onto pelvic structures and into the abdomen, where physiological recircula-tion of ascites fluid facilitates widespread seeding of tumour cells. Evolurecircula-tionary clades in the patient-specific trees often agreed with the anatomical sites where the sample was taken (see
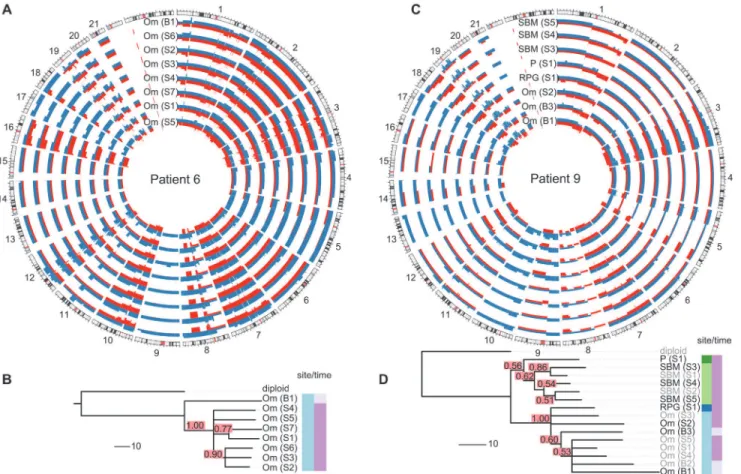
Fig. 2and individual trees inS3–S16Figs.). For example, patient 9 showed clear separation of
omentum and small bowel mesentery samples (Fig. 2D), with right paracolic gutter and perito-neum as the respective out-groups. Genetic markers of this divergent evolution included Chro-mosomes 2q and 3p as well as amplifications on Chromosome 10 (Fig. 2C). Higher resolution analyses with paired-end WGS on samples from six patients confirmed additional divergent genetic change at higher resolution. For example, in patient 9, there were three deletion break-points and an insertion breakpoint that were present only in the omentum sample, and three deletion breakpoints that were only in the peritoneal sample (S18 Fig).
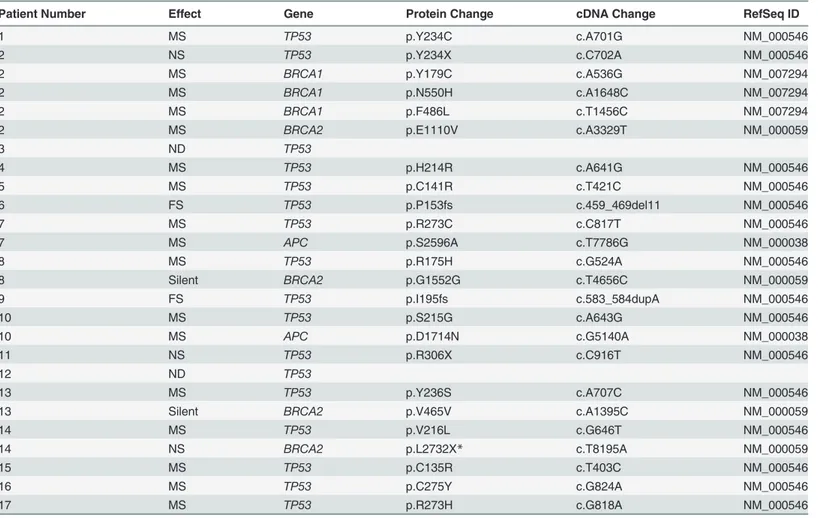
Table 2. Mutations detected in samples from CTCR-OV03 and CTCR-OV04 patients using TAm-Seq.
Patient Number Effect Gene Protein Change cDNA Change RefSeq ID
1 MS TP53 p.Y234C c.A701G NM_000546
2 NS TP53 p.Y234X c.C702A NM_000546
2 MS BRCA1 p.Y179C c.A536G NM_007294
2 MS BRCA1 p.N550H c.A1648C NM_007294
2 MS BRCA1 p.F486L c.T1456C NM_007294
2 MS BRCA2 p.E1110V c.A3329T NM_000059
3 ND TP53
4 MS TP53 p.H214R c.A641G NM_000546
5 MS TP53 p.C141R c.T421C NM_000546
6 FS TP53 p.P153fs c.459_469del11 NM_000546
7 MS TP53 p.R273C c.C817T NM_000546
7 MS APC p.S2596A c.T7786G NM_000038
8 MS TP53 p.R175H c.G524A NM_000546
8 Silent BRCA2 p.G1552G c.T4656C NM_000059
9 FS TP53 p.I195fs c.583_584dupA NM_000546
10 MS TP53 p.S215G c.A643G NM_000546
10 MS APC p.D1714N c.G5140A NM_000038
11 NS TP53 p.R306X c.C916T NM_000546
12 ND TP53
13 MS TP53 p.Y236S c.A707C NM_000546
13 Silent BRCA2 p.V465V c.A1395C NM_000059
14 MS TP53 p.V216L c.G646T NM_000546
14 NS BRCA2 p.L2732X* c.T8195A NM_000059
15 MS TP53 p.C135R c.T403C NM_000546
16 MS TP53 p.C275Y c.G824A NM_000546
17 MS TP53 p.R273H c.G818A NM_000546
Patient 14 had a deleterious somatic nonsense mutation (p.L2732X*) inBRCA2. This mutation was not detected in two independent germ line DNA samples from patient 14. All otherBRCA1/2mutations were not pathogenic or were of no/unknown clinical importance according to the Breast Cancer Information Core Database and the LOVD-IARC database.
FS, frameshift; MS, missense; ND, no mutation detected; NS, nonsense; silent, silent mutation.
Analysis of Tree Topologies Suggests Metastasis-to-Metastasis Spread
with Changing Evolutionary Rates
We next considered whether the observed spatial heterogeneity arose from
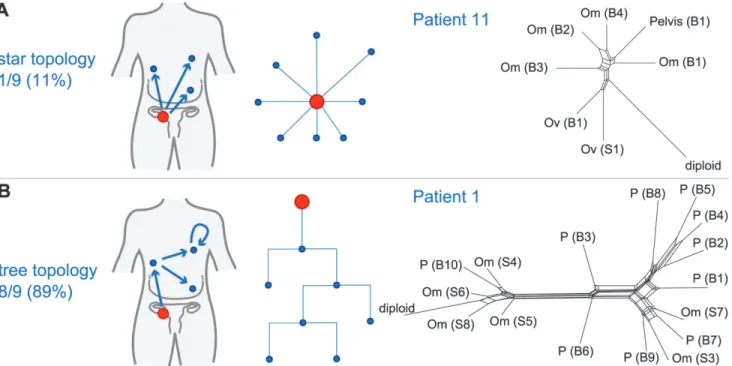
metastasis-to-metastasis spread or by successive metastases from the primary cancer site by examining the pattern of the evolutionary relationships between metastatic samples within each patient. Given a fixed number of metastases, two scenarios are possible: if only the primary tumour gives rise to metastatic clones, the resulting evolutionary tree will have a star topology
(Fig. 3A). By contrast, if cells retain their metastatic potential after metastasis, ongoing spread
and associated genetic change will lead to a fully branched evolutionary tree (Fig. 3B). We used MEDICC to test the null hypothesis for each patient that the evolutionary dis-tances were derived from a star topology [32]. To verify and visualise the findings we applied the neighbour-net method [42], which captures non-tree-like evolutionary signals in distance data. From nine patients with3 samples, eight showed significant branching (p<0.05,
chi-squared test for goodness of fit with Benjamini and Hochberg correction for false discovery rate), supporting the model of metastasis-to-metastasis spread. Patient 11 showed only a weak tree structure, and the null hypothesis could not be rejected (p= 0.22;Fig. 3A).
Fig 2. Examples of spatial and temporal heterogeneity in HGSOC.(A and C) Total copy number profiles show strong overall conservation. As examples, a representative subset of the allele-specific genomic copy number profiles of patients 6 and 9 are shown. Separate alleles are indicated in red and blue. (B and D) Genomic changes between biopsy and surgery reveal tumour evolution. The black sample names in the trees indicate the samples shown in the Circos plots. Confidence values for each split are printed in red boxes. The colour-coded bars on the right of the phylogenies indicate different sites (left column) and different sampling times (right column). Branch lengths indicate number of genetic events as determined by MEDICC (scale bar shows ten events). Om, omentum; P, peritoneum; RPG, right paracolic gutter; SBM, small bowel mesentery.
Next we compared evolutionary distances within each patient to investigate whether evolu-tionary change occurs at a constant rate (clock-like evolution). After correction for multiple testing, two out of 14 patients (14.3%) showed significant non-clock-like evolutionary trajecto-ries (p<0.05). We conclude that HGSOC shows metastasis-to-metastasis spread and that
het-erogeneity is generated through ongoing clonal evolution with potentially unknown mutator phenotypes present.
Small Changes in Heterogeneity Occur during Neoadjuvant Therapy
As most metastases are established before onset of treatment, we next investigated the rate of ongoing clonal evolution by examining samples before and after neoadjuvant chemotherapy. The average genomic change during treatment (TH index) was quantified using MEDICC. To ensure that differences were not due to cellularity, we compared histopathology estimates be-tween the pre-chemotherapy biopsies and surgical specimens and found no significant differ-ences (t-test,p= 0.7). MEDICC measures TH by mapping genomes into a high-dimensional space, termed the“mutational landscape”[16,17], in which distances correspond to evolution-ary distances between genomes. The TH index is then calculated as the distance between the robust centres of mass of the biopsy and surgery samples [32], leading to a robust estimate of change during treatment. Visual analysis of Circos plots showed strong overall conservation, indicating that the main karyotypes for each cancer were established before onset of treatment. Quantitative analysis with MEDICC detected genomic differences between biopsy and surgery samples, showing on average 46 (standard deviation 13) new genomic events (Figs.2A,2C, andS3–S16). For example, for patient 6 there was a profound difference between the twoFig 3. Branching patterns in HGSOC.(A) Radial pattern of metastatic spread leads to a star topology. The schematic shows how the evolutionary relationships are predicted to have a star-like topology if all metastases (blue) are derived from the primary lesion (red). A neighbour-net representation of the evolutionary distances from patient 11 shows deviation from a tree structure (right). (B) Branched metastatic spread leads to a tree topology. The schematic shows that evolutionary history is predicted to be tree-like if metastases create new metastases (including metastasis-to-metastasis spread). A neighbour-net representation of the distance matrix for patient 1 shows a tree-like structure (right). The number and proportion of patients classified to star or tree topology are shown. Labels on trees indicate site of metastasis (Om, omentum; Ov, ovary; P, peritoneum). Sample identifiers indicate whether the sample was collected from pre-chemotherapy biopsy (B) or interval debulking surgery (S).
sample subgroups (TH index 0.66), with early and long branching of the pre-treatment omen-tal biopsy sample away from the remaining omenomen-tal samples, indicating divergent evolution
(Fig. 2A and 2B). The copy number events responsible for this divergence included deletions
on Chromosomes 1p, 1q, 3p, 7q, 9q, and 11p. In patient 9, one of the three omentum samples differed in 18.1% of its genome from the omentum samples at surgery (Fig. 2C and 2D). We concluded that HGSOC shows detectable changes during neoadjuvant chemotherapy (median 75 d), but these are minor compared to the overall changes from the onset of the disease.
HGSOC is Frequently Polygenomic and Shows Variable Clonal
Expansion
It has previously been shown in breast cancer that CEs of minor subpopulations of cells lead to polygenomic tumours, while other tumours appear monogenomic [6]. These CEs are potential-ly modulated by selection pressure from chemotherapy (or other factors) and might have prog-nostic value. Using MEDICC allowed statistical quantification of the degree of CE on a
continuous scale (CE index) by testing for local spatial clustering of genomes in the mutational landscape [32].
We found the CE index to be variable across the cohort (median 0.73, IQR 0.65–1.24). As there was no clinically defined cutoff point for CE, the median value was used to divide patents into two groups (CE-low versus CE-high). Patients with in the CE-low group, for example pa-tient 11, showed linear emission of samples throughout the tree and had homogenous branch lengths (S12 Fig). By contrast, patients 5 and 8, in the CE-high group, showed marked CE (CE index 1.47 and 2.24, respectively), with multiple samples in strongly diverging subclades (Fig. 4).
Patients with Tumours with High Clonal Expansion Show Short Survival
and Resistant Relapse
It has been proposed that for a tumour to overcome the selection pressure applied by chemo-therapy, it needs to be able to efficiently explore the mutational landscape [17]. Therefore, we hypothesized that polygenomic tumours that have already undergone CEs are likely to be at an advantage for acquiring other mutations for survival during treatment.
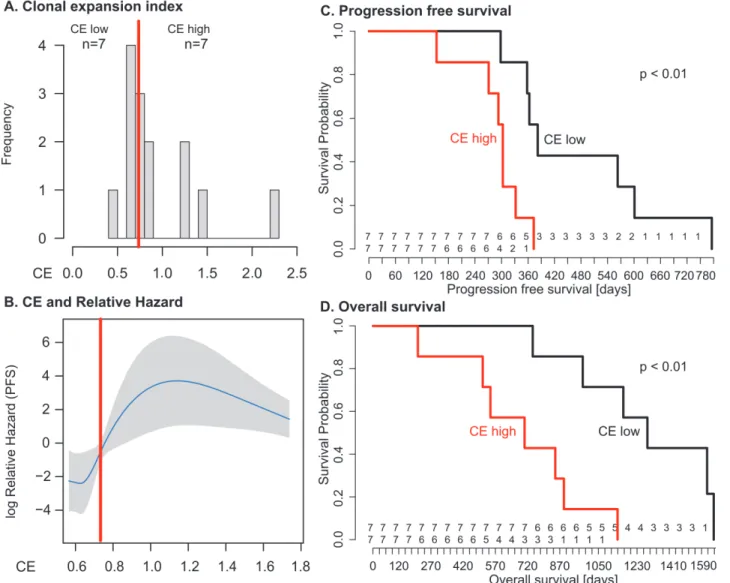
We used the log-rank test to test for differences in PFS and OS between the low and CE-high groups (Fig. 5). Survival was shorter in patients in the CE-high group (PFS 12.7 versus 10.1 mo,p= 0.009; OS 42.6 versus 23.5 mo,p= 0.003;Fig. 5). Being in the CE-high group was an independent predictor of survival in a multivariable Cox hazard regression analysis that in-cluded patient age, tumour stage, and residual disease after debulking surgery (PFS,p= 0.001; OS,p= 0.004). Survival differences were not significant between patients with low or high TH index (S1 Protocol).
We tested CE as a continuous variable in a Cox proportional hazard model, which assumes a linear relationship between CE and survival. In univariable analysis, the quantitative CE index had a borderline significant association with OS with hazard ratio (HR) = 2.7 (95% CI 0.96, 7.8;p= 0.06), but no significant association with PFS. In multivariable models that con-sidered CE, patient age, tumour stage, and residual disease, CE as a quantitative variable was not significantly associated with OS or PFS (coefficientp= 0.64 andp= 0.76, respectively). We examined potential nonlinear effects of CE on survival using cubic spline methods. For PFS and OS, the relationship between CE and relative hazard was nonlinear, showing a step func-tion effect with marked increase in hazard seen at CE values greater than 0.7–0.8 (Fig. 5B;
S1 Protocol), similar to the median cut point. Given the small size of the patient cohort, we
differences in PFS and OS remained significant (p<0.05) in 82% and 92%, respectively, of the
perturbed datasets. The bootstrapped derived median HR values for PFS and OS were HR = 7.1 (95% CI>1) and HR = 11.4 (95% CI>1), respectively.
Resistant Subclonal Populations Are Present in Pre-Treatment Disease
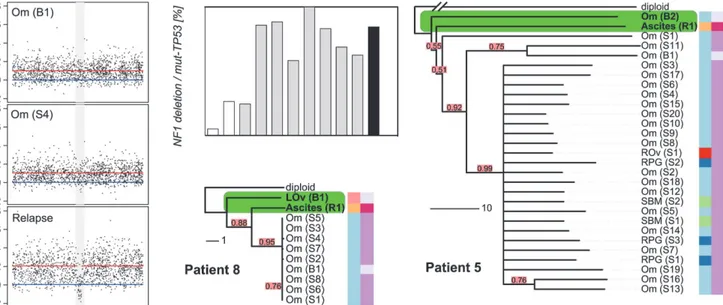
The survival analyses suggested that the degree of CE could have effects on PFS and OS consis-tent with the hypothesis that cancers with high CE may have increased genetic diversity favour-ing the emergence of drug-resistant clones. We were able to explore this hypothesis in patients 5 and 8, who had additional samples collected at progression. Patient 8 had symptomatic pro-gressive disease, with the development of ascites at 12 mo after completing chemotherapy. The phylogenetic reconstruction of her cancer showed early divergence of the ascites sample from the root (Fig. 4). Examination of the relapsed copy number profile revealed a new focal deletion atNF1that was not present in the pre-chemotherapy and interval debulking surgery samples(Fig. 4).NF1is recurrently mutated in HGSOC [22,23], which suggests this was unlikely to be a
passenger event. As copy number profiles detect the dominant clone in a sample, we investigat-ed the population structure of earlier samples using WGS to map the newNF1deletion, and digital PCR to accurately estimate the number of cells containing theNF1deletion in each sam-ple. To prevent confounding effects from differences in tumour cellularity, the counts for the
NF1deletion were expressed as a proportion of all mutantTP53counts. TheNF1deletion was detected at 5% and 26% in the pre-treatment samples (absolute cellularity 80% and 41%) and in 25%–100% of the interval debulking samples (median cellularity 49%). Histological analysis of the left fallopian tube specimen removed at interval debulking confirmed a tubal primary site (S1 Fig). We therefore extended the digital PCR analysis to DNA from microdissected tis-sues from formalin-fixed tissue blocks including the left fallopian tube fimbria. TheNF1
Fig 4. Relapse is an early diverged clonal expansion of a low-prevalence subclone of pre-treatment disease.Array copy number profiles (left) from patient 8 detected a focalNF1deletion in the relapsed ascites sample that was not observed in the pre-chemotherapy or interval debulking samples. The bar plot shows the results of digital PCR for theNF1breakpoint from pre-chemotherapy (white bars), interval debulking (grey bars), and relapsed ascites (black) samples. Phylogenetic trees for patients 8 and 5 are shown. The relapsed clonal population for each case is placed next to the pre-chemotherapy biopsy sample, indicating early branching events from the diploid. The length of each branch indicates the degree of divergence. Colour coding and sample identifiers are as forFig. 3. LOv, left ovary; Om, omentum; SBM, small bowel mesentery; RPG, right paracolic gutter.
deletion was present in 1.2% of the primary invasive carcinoma in the fallopian tube and 7.9% of the biopsy from the adjacent left ovarian metastasis (S2 Table).
In patient 5, inspection of the tree showed that the relapsed ascites sample also diverged early, with a long branch (Fig. 4) indicating marked divergent evolution. This divergence was associated with deletions on Chromosomes 1q, 15q, and 18q (S6A Fig). In summary, theNF1
deletion, while part of the dominant subpopulation at relapse, was already present pre-treatment. As it is highly unlikely that this specific deletion arose twice independently in the course of tumour evolution, we conclude that the relapse was a CE of a minor subclone of pre-chemotherapy disease.
Fig 5. Clonal expansion index stratifies patients into prognostic subgroups.(A) Distribution of CE index over all patients and the respective group sample sizes (n). The red line indicates median CE = 0.73, dichotomizing the cases into equal-sized CE-low and CE-high groups. (B) The relationship between CE and relative hazard is nonlinear. The fit line is generated from the multivariable model incorporating penalised spline smoothing. Grey shading indicates the 95% confidence interval for log hazard. Extreme CE values are not shown as the spline smoothing algorithm disregards values outside the 95% range. The median (red line) separates a region of low hazard from a region of high hazard indicated by non-overlapping confidence intervals. (C and D) The CE-low and CE-high groups show a statistically significant difference in PFS (log-rankp<0.01) and OS (log-rankp<0.01). Numbers at risk are given above
thex-axis for the CE-low (top) and CE-high (bottom) groups.
Discussion
In this work, we tested the hypothesis that intra-tumour heterogeneity in HGSOC is correlated with survival. We also assessed whether certain subclonal populations contribute to treatment failure. Our experimental design combined two approaches: first, we analysed spatially and temporally separate tumour samples from 14 women undergoing chemotherapy. This ap-proach estimates the genetic complexity of the cancer burden in an individual more accurately than sampling from a single location and time point [5,12,13,25]. Second, we applied formal methods (MEDICC) to infer the most parsimonious representation of genetic evolution in each patient’s cancer [32]. Importantly, our methods are fully unsupervised and are derived in-dependently of the clinical data.
Our analyses showed marked differences in CE between patients and negative effects of high CE on survival. In two patients with very high CE, we demonstrated that clonal populations de-tected at relapse arose from early branching events, followed by divergent evolution and CE. In-deed, digital PCR of aNF1deletion that marked the predominant clonal population at relapse conclusively showed that this deletion was present at very low fraction in pre-treatment samples including the tubal primary site. We further showed that HGSOC generally evolves and spreads in a branching process with frequently changing rates of evolution. Taken together, these find-ings are consistent with previous data from cell-based studies and circulating tumour DNA as-says that suggested that CE occurs between diagnosis and relapse in HGSOC [28,37].
Although the number of HGSOC samples studied here is relatively large compared to those of other publications, the size of the patient cohort prevents strong conclusions about effect sizes and clinical impact. We used a median value for CE as an unbiased cut point to avoid strong assumptions about the relationship between CE and survival, but given the limited sam-ple size, it is likely that our analyses overestimate the prognostic effect of CE. It is notable that the majority of the samples that failed quality assurance (and were therefore excluded from esti-mations of heterogeneity) were taken after chemotherapy treatment, suggesting that these sam-ples may have had better response to treatment [28]. This implies that the samples from which our heterogeneity measures were calculated may be enriched for more chemoresistant disease. We have not defined the minimum number of samples per case that are required for accurate estimates of CE, and this will require larger patient studies. Collecting these samples remains a major challenge for heterogeneity research, owing to the difficulties of collecting multiple fresh tissue samples at different treatment time points and the costs of detailed genomic profiling. Further technological development to use shallow WGS data from formalin-fixed, paraffin-embedded samples may be a useful approach to increasing statistical power in future studies.
Comparison of the effects of CE and TH on survival showed that TH was not predictive of PFS or OS. This was surprising, as we expected strong TH effects to be correlated with re-sponse, and therefore survival. There are several factors that may explain our finding. First, we were unable to take samples from the same tumour deposit before and after chemotherapy treatment. Therefore, apparent differences in TH could be confounded by spatial differences in tumour heterogeneity, rather than representing intrinsic changes in subclonal populations caused by chemotherapy treatment. Second, the time window for evolutionary changes to occur during chemotherapy was short compared to the genetic lifespan of each cancer. Third, both CE and TH showed moderate correlation with sample size (S1 Protocol). Sample size was not significant in a multivariable Cox model, but could potentially contribute to the predictive power of CE (S1 Protocol).
evolutionary inference is dependent upon the depth of sequencing achieved. It is also likely that the majority of nonsynonymous changes detected by exome sequencing are passenger or private mutations, which may explain why other studies have not found evidence of the strong evolutionary patterns that we see using CNAs.
Our phylogenetic reconstructions further allowed us to assess the robustness of the evolu-tionary trees, and thereby the certainty of placement of a sample in the tree. With this we ad-dressed the question of when in the course of disease the relapse clone evolved. In both patients 5 and 8, we were able to determine an early branching point as the origin of relapse that shared an immediate ancestor with a pre-treatment sample. In larger datasets these methods could be applied to the identification of early driver events and may mitigate the difficulties of identify-ing therapeutically relevant CNAs in heterogeneous patients.
In summary, our approach has been to define the evolutionary trajectories of HGSOC using robust and accurate methods to reconstruct the phylogenetic trees for individual patients. This approach has the potential to act as a patient-specific prognostic indicator and may be a power-ful tool to identify and calibrate surrogate genomic markers of CE.
Supporting Information
S1 Data. Data file for survival analysis. (ZIP)
S1 Fig. Histopathology for case 8. (PDF)
S2 Fig. Cross-patient loss of heterozygosity frequencies. (PDF)
S3 Fig. Copy number profile and evolutionary tree for patient 1.Only selected copy number profiles are shown (A); these are marked in bold in the evolutionary tree (B). Individual alleles are coloured in red and blue. Confidence values for each split in the tree are given in red boxes. The colour bars to the right of the tree indicate different sampling sites (left) and sampling times (right). Branch lengths are given in number of rearrangement events. Particularly long branches are marked in green.
(PDF)
S4 Fig. Copy number profile and evolutionary tree for patient 2.Caption as forS3 Fig. (PDF)
S5 Fig. Copy number profile and evolutionary tree for patient 3.Caption as forS3 Fig. (PDF)
S6 Fig. Copy number profile and evolutionary tree for patient 5.Caption as forS3 Fig. (PDF)
S7 Fig. Copy number profile and evolutionary tree for patient 6.Caption as forS3 Fig. (PDF)
S8 Fig. Copy number profile and evolutionary tree for patient 7.Caption as forS3 Fig. (PDF)
S9 Fig. Copy number profile and evolutionary tree for patient 8.Caption as forS3 Fig. (PDF)
S11 Fig. Copy number profile and evolutionary tree for patient 10.Caption as forS3 Fig. (PDF)
S12 Fig. Copy number profile and evolutionary tree for patient 11.Caption as forS3 Fig. (PDF)
S13 Fig. Copy number profile and evolutionary tree for patient 13.Caption as forS3 Fig. (PDF)
S14 Fig. Copy number profile and evolutionary tree for patient 14.Caption as forS3 Fig. (PDF)
S15 Fig. Copy number profile and evolutionary tree for patient 15.Caption as forS3 Fig. (PDF)
S16 Fig. Copy number profile and evolutionary tree for patient 17.Caption as forS3 Fig. (PDF)
S17 Fig. Tree shapes and evolutionary patterns in resistant and sensitive cases. (PDF)
S18 Fig. Paired-end sequencing of selected samples. (PDF)
S1 Protocol. Sweave file for survival analysis. (RNW)
S1 Table. Distribution of samples. (PDF)
S2 Table. Digital PCR results. (PDF)
S3 Table. Primers for digital PCR. (PDF)
S4 Table. Copy number alteration feature selection results. (PDF)
S1 Text. Case-by-case study of the CTCR-OV03/04 cohort. (PDF)
Acknowledgments
We thank H. Biggs, C. Hodgkin, L. Jones, the Addenbrooke’s Hospital Human Research Tissue Bank, and the Addenbrooke’s Hospital gynaecology-oncology multidisciplinary team for ex-pert assistance in sample collection and study recruitment. We thank the Core Facilities at the Cancer Research UK Cambridge Institute for expert support.
Author Contributions
results and conclusions: RFS CKYN SLC SN JT AMP DG KS MM PJB NR HME ES MJL CAP FM JDB. All authors have read, and confirm that they meet, ICMJE criteria for authorship.
References
1. Nowell PC (1976) The clonal evolution of tumor cell populations. Science 194: 23–28. PMID:959840 2. Dexter DL, Kowalski HM, Blazar BA, Fligiel Z, Vogel R, et al. (1978) Heterogeneity of tumor cells from a
single mouse mammary tumor. Cancer Res 38: 3174–3181. PMID:210930
3. Khalique L, Ayhan A, Weale ME, Jacobs IJ, Ramus SJ, et al. (2007) Genetic intra-tumour heterogeneity in epithelial ovarian cancer and its implications for molecular diagnosis of tumours. J Pathol 211: 286–295. PMID:17154249
4. Khalique L, Ayhan A, Whittaker JC, Singh N, Jacobs IJ, et al. (2009) The clonal evolution of metastases from pri-mary serous epithelial ovarian cancers. Int J Cancer 124: 1579–1586. doi:10.1002/ijc.24148PMID:19123469 5. Shah SP, Morin RD, Khattra J, Prentice L, Pugh T, et al. (2009) Mutational evolution in a lobular breast tumour profiled at single nucleotide resolution. Nature 461: 809–813. doi:10.1038/nature08489PMID: 19812674
6. Navin N, Krasnitz A, Rodgers L, Cook K, Meth J, et al. (2010) Inferring tumor progression from genomic heterogeneity. Genome Res 20: 68–80. doi:10.1101/gr.099622.109PMID:19903760
7. Campbell PJ, Yachida S, Mudie LJ, Stephens PJ, Pleasance ED, et al. (2010) The patterns and dynam-ics of genomic instability in metastatic pancreatic cancer. Nature 467: 1109–1113. doi:10.1038/ nature09460PMID:20981101
8. Navin N, Kendall J, Troge J, Andrews P, Rodgers L, et al. (2011) Tumour evolution inferred by single-cell sequencing. Nature 472: 90–94. doi:10.1038/nature09807PMID:21399628
9. Marusyk A, Almendro V, Polyak K (2012) Intra-tumour heterogeneity: a looking glass for cancer? Nat Rev Cancer 12: 323–334. doi:10.1038/nrc3261PMID:22513401
10. Vermaat JS, Nijman IJ, Koudijs MJ, Gerritse FL, Scherer SJ, et al. (2012) Primary colorectal cancers and their subsequent hepatic metastases are genetically different: implications for selection of patients for targeted treatment. Clin Cancer Res 18: 688–699. doi:10.1158/1078-0432.CCR-11-1965PMID: 22173549
11. Wu X, Northcott PA, Dubuc A, Dupuy AJ, Shih DJH, et al. (2012) Clonal selection drives genetic diver-gence of metastatic medulloblastoma. Nature 482: 529–533. doi:10.1038/nature10825PMID: 22343890
12. Gerlinger M, Rowan AJ, Horswell S, Larkin J, Endesfelder D, et al. (2012) Intratumor heterogeneity and branched evolution revealed by multiregion sequencing. N Engl J Med 366: 883–892. doi:10.1056/ NEJMoa1113205PMID:22397650
13. Shah SP, Roth A, Goya R, Oloumi A, Ha G, et al. (2012) The clonal and mutational evolution spectrum of primary triple-negative breast cancers. Nature 486: 395–399. doi:10.1038/nature10933PMID: 22495314
14. de Bruin EC, McGranahan N, Mitter R, Salm M, Wedge DC, et al. (2014) Spatial and temporal diversity in genomic instability processes defines lung cancer evolution. Science 346: 251–256. doi:10.1126/ science.1253462PMID:25301630
15. Nik-Zainal S, Van Loo P, Wedge DC, Alexandrov LB, Greenman CD, et al. (2012) The life history of 21 breast cancers. Cell 149: 994–1007. doi:10.1016/j.cell.2012.04.023PMID:22608083
16. Merlo LMF, Pepper JW, Reid BJ, Maley CC (2006) Cancer as an evolutionary and ecological process. Nat Rev Cancer 6: 924–935. PMID:17109012
17. Greaves M, Maley CC (2012) Clonal evolution in cancer. Nature 481: 306–313. doi:10.1038/ nature10762PMID:22258609
18. Anderson K, Lutz C, van Delft FW, Bateman CM, Guo Y, et al. (2011) Genetic variegation of clonal ar-chitecture and propagating cells in leukaemia. Nature 469: 356–361. doi:10.1038/nature09650PMID: 21160474
19. Landau DA, Carter SL, Stojanov P, McKenna A, Stevenson K, et al. (2013) Evolution and impact of subclonal mutations in chronic lymphocytic leukemia. Cell 152: 714–726. doi:10.1016/j.cell.2013.01.019PMID:23415222 20. Ahmed AA, Etemadmoghadam D, Temple J, Lynch AG, Riad M, et al. (2010) Driver mutations in TP53
are ubiquitous in high grade serous carcinoma of the ovary. J Pathol 221: 49–56. doi:10.1002/path. 2696PMID:20229506
22. Cancer Genome Atlas Research Network (2011) Integrated genomic analyses of ovarian carcinoma. Nature 474: 609–615. doi:10.1038/nature10166PMID:21720365
23. Sangha N, Wu R, Kuick R, Powers S, Mu D, et al. (2008) Neurofibromin 1 (NF1) defects are common in human ovarian serous carcinomas and co-occur with TP53 mutations. Neoplasia 10: 1362–1372. PMID:19048115 24. Carter SL, Cibulskis K, Helman E, McKenna A, Shen H, et al. (2012) Absolute quantification of somatic
DNA alterations in human cancer. Nat Biotechnol 30: 413–421. doi:10.1038/nbt.2203PMID:22544022 25. Bashashati A, Ha G, Tone A, Ding J, Prentice LM, et al. (2013) Distinct evolutionary trajectories of
pri-mary high-grade serous ovarian cancers revealed through spatial mutational profiling. J Pathol 231: 21–34. doi:10.1002/path.4230PMID:23780408
26. Zhang J, Shi Y, Lalonde E, Li L, Cavallone L, et al. (2013) Exome profiling of primary, metastatic and re-current ovarian carcinomas in a BRCA1-positive patient. BMC Cancer 13: 146. doi: 10.1186/1471-2407-13-146PMID:23522120
27. Hoogstraat M, de Pagter MS, Cirkel GA, van Roosmalen MJ, Harkins TT, et al. (2014) Genomic and transcriptomic plasticity in treatment-naive ovarian cancer. Genome Res 24: 200–211. doi:10.1101/gr. 161026.113PMID:24221193
28. Cooke SL, Ng CKY, Melnyk N, Garcia MJ, Hardcastle T, et al. (2010) Genomic analysis of genetic het-erogeneity and evolution in high-grade serous ovarian carcinoma. Oncogene 29: 4905–4913. doi:10. 1038/onc.2010.245PMID:20581869
29. Cooke SL, Brenton JD (2011) Evolution of platinum resistance in high-grade serous ovarian cancer. Lancet Oncol 12: 1169–1174. doi:10.1016/S1470-2045(11)70123-1PMID:21742554
30. Wang ZC, Birkbak NJ, Culhane AC, Drapkin R, Fatima A, et al. (2012) Profiles of genomic in-stability in high-grade serous ovarian cancer predict treatment outcome. Clin Cancer Res 18: 5806–5815. doi:10. 1158/1078-0432.CCR-12-0857PMID:22912389
31. Cowin PA, George J, Fereday S, Loehrer E, Van Loo P, et al. (2012) LRP1B deletion in high-grade se-rous ovarian cancers is associated with acquired chemotherapy resistance to liposomal doxorubicin. Cancer Res 72: 4060–4073. PMID:22896685
32. Schwarz RF, Trinh A, Sipos B, Brenton JD, Goldman N, et al. (2014) Phylogenetic quantification of intra-tu-mour heterogeneity. PLoS Comput Biol 10: e1003535. doi:10.1371/journal.pcbi.1003535PMID:24743184 33. Greenman CD, Bignell G, Butler A, Edkins S, Hinton J, et al. (2010) PICNIC: an algorithm to predict
ab-solute allelic copy number variation with microarray cancer data. Biostatistics 11: 164–175. doi:10. 1093/biostatistics/kxp045PMID:19837654
34. Ng CKY, Cooke SL, Howe K, Newman S, Xian J, et al. (2012) The role of tandem duplicator phenotype in tumour evolution in high-grade serous ovarian cancer. J Pathol 226: 703–712. doi:10.1002/path. 3980PMID:22183581
35. Li H, Durbin R (2009) Fast and accurate short read alignment with Burrows-Wheeler transform. Bioin-formatics 25: 1754–1760. doi:10.1093/bioinformatics/btp324PMID:19451168
36. Untergasser A, Cutcutache I, Koressaar T, Ye J, Faircloth BC, et al. (2012) Primer3—new capabilities and interfaces. Nucleic Acids Res 40: e115. PMID:22730293
37. Forshew T, Murtaza M, Parkinson C, Gale D, Tsui DWY, et al. (2012) Noninvasive identification and monitoring of cancer mutations by targeted deep sequencing of plasma DNA. Sci Transl Med 4: 136ra68. doi:10.1126/scitranslmed.3003726PMID:22649089
38. Robinson JT, Thorvaldsdóttir H, Winckler W, Guttman M, Lander ES, et al. (2011) Integrative genomics viewer. Nat Biotechnol 29: 24–26. doi:10.1038/nbt.1754PMID:21221095
39. Archibald KM, Kulbe H, Kwong J, Chakravarty P, Temple J, et al. (2012) Sequential genetic change at the TP53 and chemokine receptor CXCR4 locus during transformation of human ovarian surface epi-thelium. Oncogene 31: 4987–4995. doi:10.1038/onc.2011.653PMID:22266861
40. Sala E, Kataoka MY, Priest AN, Gill AB, McLean MA, et al. (2012) Advanced ovarian cancer: mul-tiparametric MR imaging demonstrates response-and metastasis-specific effects. Radiology 263: 149–159. doi:10.1148/radiol.11110175PMID:22332064
41. McBride DJ, Etemadmoghadam D, Cooke SL, Alsop K, George J, et al. (2012) Tandem duplication of chromosomal segments is common in ovarian and breast cancer genomes. J Pathol 227: 446–455. doi:10.1002/path.4042PMID:22514011
42. Bryant D, Moulton V (2004) Neighbor-net: an agglomerative method for the construction of phylogenetic networks. Mol Biol Evol 21: 255–265. PMID:14660700
Editors
’
Summary
Background
Every year, nearly 250,000 women develop ovarian cancer, and about 150,000 die from the disease. Ovarian cancer occurs when a cell on the surface of the ovaries (two small organs in the pelvis that produce eggs) or in the Fallopian tubes (which connect the ovaries to the womb) acquires genetic changes (mutations) that allow it to grow uncontrollably and to spread around the body (metastasize). For women whose ovarian cancer is diagnosed when it is confined to its site of origin, the outlook is good. About 90% of these women survive for at least five years. However, ovarian cancer is rarely diagnosed this early. Usual-ly, by the time the cancer causes symptoms (often only vague abdominal pains and mild digestive disturbances), it has spread into the peritoneal cavity (the space around the gut, stomach, and liver) or has metastasized to distant organs. Patients with advanced ovarian cancer are treated with a combination of surgery and platinum-based chemotherapy, but only a quarter of such women are still alive five years after diagnosis, and the overall five-year survival rate for ovarian cancer is less than 50%.
Why Was This Study Done?
The major clinical challenge in the treatment of high-grade serous ovarian cancer (HGSOC; the most common type of ovarian cancer) is the development of resistance to platinum-based chemotherapy. If we knew how this resistance develops, it might be possi-ble to improve the treatment of HGSOC. Tumors are thought to arise from a single mutat-ed cell that accumulates additional mutations as it grows and divides. This process results in the formation of subpopulations of tumor cells, each with a different set of mutations. Experts think that this“intra-tumor heterogeneity”gives rise to tumor subclones that pos-sess an evolutionary advantage over other subclones (they might, for example, grow faster or be resistant to chemotherapy) and that eventually dominate the tumor (“clonal expan-sion”). Here, the researchers investigate whether clonal evolution and the emergence of subclonal tumor populations explains the development of chemotherapy-resistant HGSOC by undertaking evolutionary inference and phylogenetic quantification of the het-erogeneity of samples taken from women with HGSOC at different times and from differ-ent places in their body. Evolutionary inference and phylogenetic quantification are analytical approaches that can be used to reconstruct the evolutionary history (“family tree”) of a tumor.
What Did the Researchers Do and Find?
having CE-high tumors was likely to increase a patient’s risk of a poor outcome. Finally, phylogenetic analysis of samples taken from two patients before and after relapse and anal-ysis of aNF1deletion (NF1encodes neurofibromin 1, a tumor suppressor protein that pre-vents uncontrolled cell growth;NF1is frequently mutated in HGSOC) indicated that a resistant subclonal population was already present in the patients’tumors before treatment began.
What Do These Findings Mean?
These findings show that clonal expansion occurs between diagnosis and relapse in HGSOC, that there are marked differences in the degree of clonal expansion among pa-tients, and that a high degree of clonal expansion may have a negative effect on survival. The accuracy of these findings is limited by the small number of patients included in the study, and it is likely that the analyses reported here overestimate the effect of clonal ex-pansion on patient outcomes. Nevertheless, the researchers suggest that, provided larger patient studies yield similar results, quantitative measures of intra-tumor heterogeneity might be useful as patient-specific prognostic markers in HGSOC. That is, measures of intra-tumor heterogeneity might eventually help clinicians to predict which of their pa-tients with ovarian cancer are likely to have the best outcomes after
platinum-based chemotherapy.
Additional Information
Please access these websites via the online version of this summary athttp://dx.doi.org/10.
1371/journal.pmed.1001789.
• TheUS National Cancer Instituteprovides information about cancer and how it
devel-ops (in English and Spanish), including detailed information aboutovarian cancer
• Cancer Research UK, a not-for-profit organization, providesgeneral information about
cancer and how it develops, and detailed information aboutovarian cancer
• The UK National Health Service Choices website has information and personal stories aboutovarian cancer
• The not-for-profit organization Healthtalk.org provides personal stories about dealing
withovarian cancer;Eyes on the Prize, an online support group for women who have
had cancers of the female reproductive system, also includes personal stories; the not-for-profit organizationOvarian Cancer Actionalso provides information, support, and personal stories about ovarian cancer
• Wikipedia provides information aboutclonal evolution in cancer,tumor heterogeneity,
andphylogenetics(note that Wikipedia is a free online encyclopedia that anyone can
edit; available in several languages)