in a Microarray Experiment but Both Are Outweighed by
Changes Induced by Stimulation
Penelope A. Bryant1,2,3, Gordon K. Smyth4,5, Roy Robins-Browne2,6, Nigel Curtis1,2,3*
1Department of Paediatrics, The University of Melbourne, Melbourne, Australia,2Infection, Immunity and Environment Theme, Murdoch Children’s Research Institute, Melbourne, Australia,3Infectious Diseases Unit, Department of General Medicine, Royal Children’s Hospital, Melbourne, Australia,4Bioinformatics Division, Walter and Eliza Hall Institute of Medical Research, Melbourne, Australia,5Department of Mathematics and Statistics, The University of Melbourne, Melbourne, Australia, 6Department of Microbiology and Immunology, The University of Melbourne, Melbourne, Australia
Abstract
Introduction:A central issue in the design of microarray-based analysis of global gene expression is that variability resulting from experimental processes may obscure changes resulting from the effect being investigated. This study quantified the variability in gene expression at each level of a typical in vitro stimulation experiment using human peripheral blood mononuclear cells (PBMC). The primary objective was to determine the magnitude of biological and technical variability relative to the effect being investigated, namely gene expression changes resulting from stimulation with lipopolysaccharide (LPS).
Methods and Results:Human PBMC were stimulatedin vitrowith LPS, with replication at 5 levels: 5 subjects each on 2 separate days with technical replication of LPS stimulation, amplification and hybridisation. RNA from samples stimulated with LPS and unstimulated samples were hybridised against common reference RNA on oligonucleotide microarrays. There was a closer correlation in gene expression between replicate hybridisations (0.86–0.93) than between different subjects (0.66–0.78). Deconstruction of the variability at each level of the experimental process showed that technical variability (standard deviation (SD) 0.16) was greater than biological variability (SD 0.06), although both were low (SD,0.1 for all individual components). There was variability in gene expression both at baseline and after stimulation with LPS and proportion of cell subsets in PBMC was likely partly responsible for this. However, gene expression changes after stimulation with LPS were much greater than the variability from any source, either individually or combined.
Conclusions:Variability in gene expression was very low and likely to improve further as technical advances are made. The finding that stimulation with LPS has a markedly greater effect on gene expression than the degree of variability provides confidence that microarray-based studies can be used to detect changes in gene expression of biological interest in infectious diseases.
Citation:Bryant PA, Smyth GK, Robins-Browne R, Curtis N (2011) Technical Variability Is Greater than Biological Variability in a Microarray Experiment but Both Are Outweighed by Changes Induced by Stimulation. PLoS ONE 6(5): e19556. doi:10.1371/journal.pone.0019556
Editor:Arkady B. Khodursky, University of Minnesota, United States of America
ReceivedFebruary 14, 2011;AcceptedApril 5, 2011;PublishedMay 31, 2011
Copyright:ß2011 Bryant et al. This is an open-access article distributed under the terms of the Creative Commons Attribution License, which permits unrestricted use, distribution, and reproduction in any medium, provided the original author and source are credited.
Funding:This study was supported by a grant from the National Heart Foundation of Australia (www.heartfoundation.org.au) and the Australian National Health and Medical Research Council (no. 216716, www.nhmrc.gov.au). Dr Bryant was the recipient of a European Society of Paediatric Infectious Diseases Fellowship Award (www.espid.org) and a University of Melbourne Research Scholarship (www.unimelb.edu.au). The funders had no role in study design, data collection and analysis, decision to publish, or preparation of the manuscript.
Competing Interests:The authors have declared that no competing interests exist.
* E-mail: [email protected]
Introduction
Microarrays provide a powerful tool to quantify global gene expression. A potential limitation is that variability resulting from experimental processes may obscure changes resulting from the effect being investigated. If the variability is substantial or systematic, it may be erroneously interpreted as a genuine difference. To date, there have been few studies quantifying the variability and reproducibility of microarray experiments in humans.
Sources of variability include biological (between subjects) and technical (everything downstream from obtaining an RNA sample) [1]. One study in humans assessing biological variability found
gene expression was influenced by a variety of factors including age, sex, time of day of sampling and constituent cell subsets [2]. Further, there have been found to be familial similarities in variability in baseline gene expression [3,4]. Technical variability could result from any of the multiple steps involved in the detection of gene expression changes using microarrays including amplification of RNA and hybridisation [5]. Previous in vitro
was a low degree of technical variability when comparing two samples of identical RNA prepared from a cell culture, but the results were not markedly different when different cell culture preparations were used, suggesting that the majority of the variability was technical [1]. A separate arm of the study showed that in some cases different cell lines from the same individual had higher variability than the same cell lines from different individuals. Different subjects, cell lines and technical steps were not all compared directly with each other and the component sources of variability from each step of the process were not deconstructed. The authors suggested that inter-individual differ-ences might mask changes due to a stimulus.
The aim of this study was to investigate the variability in gene expression in an in vitro stimulation experiment using human
peripheral blood mononuclear cells (PBMC). The primary objective was to determine the magnitude of biological and technical variability relative to the effect being investigated, namely gene expression changes resulting from stimulation with lipopolysaccharide (LPS). We aimed to identify the relative contribution of different sources of variability at each stage of the experiment culminating in hybridisation to a microarray slide. The results were intended to determine to what extent detected gene expression differences in anin vitromicroarray experiment in
humans can be attributed to the stimulus investigated rather than artefactual differences from technical and biological variation.
Results
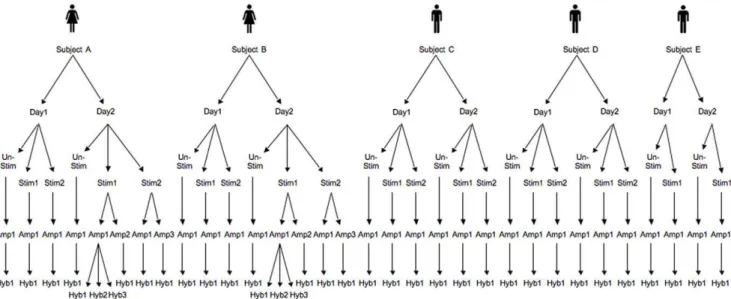
An in vitro stimulation experiment was undertaken with
replication at 5 levels (subject, day, stimulation tube, amplification and hybridisation) (figure 1). Five subjects each had blood taken on 2 days and their peripheral blood mononuclear cells (PBMC) were separated and stimulated with LPS in 2 parallel tubes for 24 hours or left unstimulated. All samples were amplified and RNA was hybridised against common reference RNA from pooled unsti-mulated samples from all subjects. Replication was also included at the amplification and hybridisation steps. Differences in gene expression with LPS stimulation were measured by comparing the log2ratio of the stimulated samples with the unstimulated samples.
Variability in gene expression was compared between all samples at baseline and after LPS stimulation.
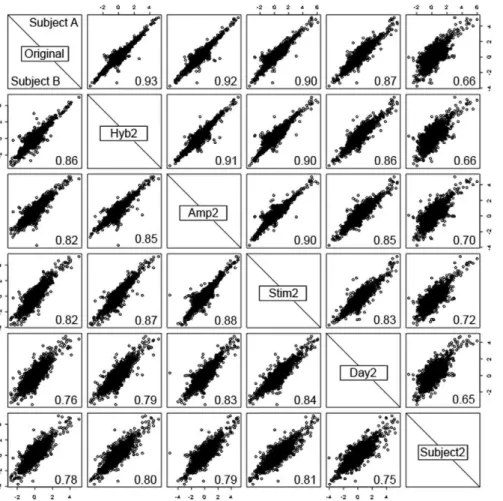
Cumulative effects of variability at different levels The hierarchy of levels of variability which underlie the experimental design are shown by comparing gene expression for the 2 subjects (A and B) who had replication at every level of the experiment (figure 2). Comparisons were made between gene expression (against the common reference) from one hybridisation and gene expression from hybridisations at each different level of replication. For replication at the subject level, one of the other subjects on the same day was randomly selected for comparison.
In general, for both subjects, hybridisations correlated more closely the further down the experimental process the replication occurred; for example, replication by hybridising the same RNA (Hyb2) had a correlation coefficient of 0.86–0.93, while hybrid-ising RNA from 2 different subjects (Subject2) had a correlation of 0.66–0.78. This is because the variance is additive; for example, the variance (s2) at the level of amplification is a combination
(s2Amp+s2Hyb) of the variability due to amplification (s2Amp) and
the variability due to hybridisation (s2Hyb).
Multi-level random effects
To deconstruct this and to determine how much variability there was at each level of the experiment including the LPS interaction with subject and day (‘Subject:LPS’ and ‘Day:LPS’), a multi-level mixed model analysis was undertaken, incorporating both fixed and random effects (table 1) [6].
The variance at each level was in principle estimated by subtracting the variance of the layers below it. Thus in the example above, by subtracting the variance at the level of hybridisation (s2Hyb) from the combined variance at the level of
amplification (s2Amp+s2Hyb), the variability due to amplification
alone (s2Amp) can be estimated.
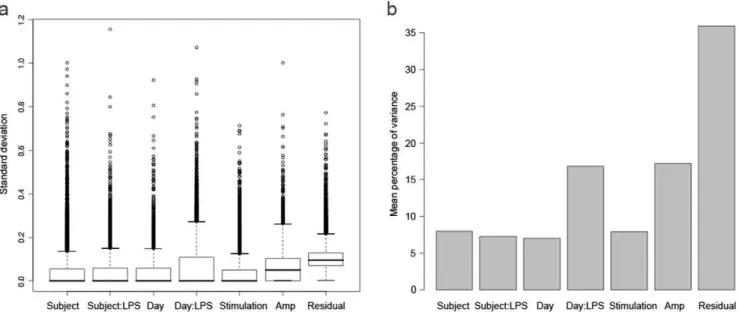
The median standard deviation (SD,s) for all of the variance
components was very small, at less than 0.1 for all components, and 0 for the majority (figure 3a). Note that ‘Residual’ refers to the variance component attributable to hybridisation, but also includes any other factors contributing to variability downstream
Figure 1. Experimental design showing samples used to compare variability.Samples: Subject A–E, Day 1 and 2, LPS-stimulated sample (Stim) 1 and 2, amplification run (Amp) 1–3, and hybridisation (Hyb) 1–3. For each subject on each day there was also an unstimulated (Unstim) sample at 0 hours.
of amplification. The greatest variability was at the levels of amplification and hybridisation, but even these were small. The proportion that each component contributed to the overall variance indicated that the greatest proportion of variance was contributed by Residual/Hybridisation, which was double that contributed by Amplification, and nearly four times that contributed by most of the remaining components (figure 3b).
Although the variance between different days was slightly smaller than between different subjects, when the LPS interaction was taken into account, the interaction between Day and LPS contributed variability greater than the Subject or Subject:LPS interaction.
A comparison was made between biological and technical variability by summing the Subject and Day components for biological variability, and the Stimulation, Amplification and Residual components for technical variability (figure 4). Technical variability (SD 0.16) was slightly greater than biological variability (SD 0.06), although they were both low with the upper interquartile range of the standard deviation for each being less than 0.4.
Comparing combined biological and technical variance also shows that the variance did not greatly increase when adding different variance components together. Although the components contributing to the variability are additive, the same genes were not highly variable at each level, so the overall variability was not markedly higher.
LPS response between individuals
The LPS effect is the difference between stimulated and unstimulated samples. Overall the inter-subject variability in response to LPS was very low with the median standard deviation Figure 2. Matrix of scatterplots showing log2ratios for replicate hybridisations at each level of the experiment.The fold changes for
each sample are plotted against those for each of the other samples for gene expression after stimulation with LPS for two subjects: subject A (top right of diagonal) and subject B (bottom left). Comparisons are made at different levels of the experiment: hybridisation (Hyb2), amplification (Amp2), stimulation (Stim2), day (Day2) and subject (Subject2). Correlation coefficients between each pair of samples are shown in the bottom right of each box.
doi:10.1371/journal.pone.0019556.g002
Table 1.Different components contributing to variability in the design of the study.
Component Variability Effect
Sex Biological Fixed
Subject Biological Random
Day Biological Random
LPS treatment Physiological Fixed
Stimulation tube Technical Random
Amplification Technical Random
Hybridisation Technical Random
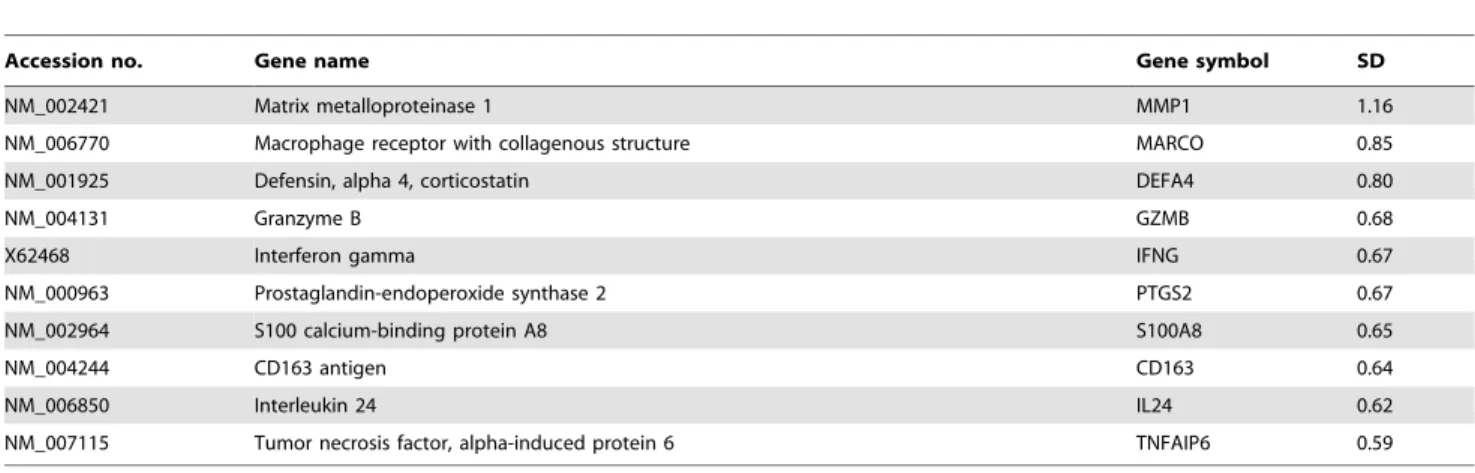
at zero (figure 3a). Although the majority of genes showed consistent expression, there were a few genes that varied between subjects in response to LPS. Genes were ranked by their Subject:LPS variance component, and the top 10 genes that were most variable between subjects in terms of their response to LPS are shown in table 2.
The majority of these genes are recognisable as being involved in the immune response, with a variety of cytokines and receptors represented. This is consistent with previous findings of differences in in vitro cytokine responses to stimulation with LPS between
individuals [7,8]. Potential causes of this subset of genes showing variable response to LPS between subjects were further investi-gated. Baseline gene expression in peripheral blood from human subjects has previously been found to be affected by age, sex, time
of day of sampling and constituent cell subsets [2]. In animals the response to LPS is also affected by age and sex [9]. In this study the subjects had a narrow age range and blood was taken at the same time each day so these variables were excluded, and the effect of sex and constituent cell subsets was further analysed.
Effect of sex on LPS response
There is almost no overlap between genes that respond to LPS and genes that are expressed differently between the sexes (figure 5). The genes most differentially expressed between the sexes were XIST (represented by 2 spots on the microarray) and DOM3Z (figure 5). XIST is a gene expressed only on the inactivated X chromosome, therefore only in females [10]. DOM3Z is a gene found in the MHC III region paired with RP1, a protein thought to be involved in androgen-responsiveness in male mice [11] which could explain its sex effect. However, the effect of LPS on their expression was minimal. Although not designed to investigate the effects of sex on LPS response, further analysis showed that this effect was not strong in this study.
Effect of different days and cell subset proportions Although the median standard deviation for both was zero, the variability in response to LPS between days was unexpectedly greater than between subjects (figure 3b). All hybridisations were with the common reference RNA: from unstimulated PBMC from subjects A–D on Day 2. There was therefore less differential expression between the Day 2 samples and the common reference than between the Day 1 samples and the common reference. This suggests the finding is at least in part due to artefact.
The prime effector cells following LPS stimulation are monocytes (CD14+), and there were differences in the proportion of monocytes in PBMC samples from each subject on each day (table 3). The greatest difference in proportion of monocytes between the two days was 4.8% at 0 hours (subject B) and 7.5% at 24 hours (subject D). This difference in cell subset proportions may partly explain the difference between Day 1 and Day 2. However, the day-to-day variability in monocyte percentages is less than that between subjects, so monocyte percentage alone Figure 3. Variability of gene expression for each component level of the experiment.a) Standard deviation of all genes for each variance component, showing median standard deviation, interquartile ranges and outliers; b) Proportion of variance contributed by each component to the overall variance. Amp - amplification run.
doi:10.1371/journal.pone.0019556.g003
Figure 4. Standard deviation of all genes for biological and technical variance, showing median standard deviation, inter-quartile ranges and outliers.
does not to explain the relatively high Day:LPS variance component.
There was a wide range of monocyte proportions in PBMC between subjects at 0 and 24 hours and some of the most variable genes are known to be strongly expressed in monocytes, for example, MMP1, CD163, MARCO and IL-24 [12,13,14]. There were also genes amongst the most variable known to be expressed in other leukocytes, for example IFNG (T cells) [15] and GZMB (cytotoxic T cells) [16]. Although they were not measured, these cell subset proportions also likely differed between subjects.
Variability compared to biological effect
When comparing LPS-stimulated to unstimulated samples, 4552 genes were significantly differentially expressed. A compar-ison of the fold changes after LPS stimulation with the variability expressed as a standard deviation on the same scale shows gene expression in response to LPS dwarfs biological or technical variability (figure 6).
Discussion
Technical variability is inherent in all microarray experiments as a result of the number of elements being measured and the number of steps in the process that culminates in hybridisation of RNA to a microarray slide. Different methods have been used to attempt to control the variability in microarray experiments, including the use of control housekeeping genes on the array [17], pre-processing and normalisation of data [18,19,20] and replica-tion [21] which allows an estimareplica-tion of error. In recent studies, variability has even been exploited to enhance microarray data analysis [22] and calculate sample size [23]. For these experimen-tal and bioinformatic methods to be relevant to biology, an understanding of the sources and magnitude of variability in gene expression is crucial.
This is the first study to deconstruct the variability in a microarray experiment into each level of the experimental process. All sources of variability in this study were low. Even the largest source of variability, the residual component measured by replicate hybridisations, had a standard deviation of about 0.1 on the log2scale, corresponding to 7% of gene expression level. The low variability was partly a result of using high quality normalization and pre-processing. Less attention to issues such as background correction would have resulted in higher variability [18]. However, large scale filtering of spots on quality grounds was not undertaken, and filtering was used only to remove transcripts not expressed in peripheral blood.
Table 2.The top 10 most variable genes between subjects by stimulation with LPS and the standard deviation (SD) of each.
Accession no. Gene name Gene symbol SD
NM_002421 Matrix metalloproteinase 1 MMP1 1.16
NM_006770 Macrophage receptor with collagenous structure MARCO 0.85
NM_001925 Defensin, alpha 4, corticostatin DEFA4 0.80
NM_004131 Granzyme B GZMB 0.68
X62468 Interferon gamma IFNG 0.67
NM_000963 Prostaglandin-endoperoxide synthase 2 PTGS2 0.67
NM_002964 S100 calcium-binding protein A8 S100A8 0.65
NM_004244 CD163 antigen CD163 0.64
NM_006850 Interleukin 24 IL24 0.62
NM_007115 Tumor necrosis factor, alpha-induced protein 6 TNFAIP6 0.59
doi:10.1371/journal.pone.0019556.t002
Figure 5. Effect of LPS and sex on gene expression with log2 ratios contributed by each component along the x and y axes respectively.
doi:10.1371/journal.pone.0019556.g005
Table 3.Proportion of monocytes (CD14+) in different
samples.
CD14+cells (%)
Subject 0 h 24 h
Day 1 Day 2 Day 1 Day 2
A 7.7 7.1 6.4 6.2
B 2.3 7.1 3.5 3.2
C 5.9 8.4 8.2 11.0
D 11.9 14.6 7.0 14.5
E 1.8 2.8 1.1 1.6
The minimal variability found between subjects in gene expression in peripheral blood is consistent with other human gene expression studies. Whitney et al showed low variability in
baseline gene expression [2]. Our study confirmed this and additionally is the first to show that there is low variability in response to LPS stimulation. The response to LPS is known to be highly conserved, even between species [24], and it is possible that there would be more variability in gene expression in response to a different stimulant where the response was less stereotypical. Differences between subjects in response to LPS related largely to genes involved in the immune response, which may explain why individuals have different clinical responses to the same organism and why some individuals have poor outcomes with sepsis. In animals, sex, pregnancy, age and stress have all been shown to affect the response to LPS [9,25,26]. A key finding was that the differential expression induced by LPS was markedly greater than any differences resulting from technical or biological variability. This was true of each of the deconstructed components contributing to variability, and when individual sources were combined.
The largest sources of variability in this experiment were the technical steps of amplification and hybridisation. These steps can potentially be improved by technological developments as been showed by comparisons between different platforms [27].
Day to day variability was comparable to or greater than variation between subjects. The most likely explanation was that the finding was an artefact due to the composition of the RNA contributing to the common reference. As long as it is common to all hybridisations, the composition of the reference RNA has previously been thought not to matter. However, because the differential expression was not identically distributed between
Days 1 and 2 compared to the common reference, Day 2 had a much smaller variance. Comparison of Day 1 and Day 2 was therefore not random, and this likely created the artefact of there appearing to be a larger difference between days than subjects. However, while this finding may be partly artefactual, it is also consistent with the findings that samples from subjects who contributed blood on multiple days do not necessarily cluster together [2]. Factors such as how much sleep each subject got the night before, what they had for breakfast and whether they cycled or drove to work could all potentially affect gene expression responses [28,29,30]. This highlights the similarity between subjects in gene expression, both at baseline, and in response to LPS. This suggests that blood samples collected over multiple days may be preferable when investigating individual responses.
This study is the first to correlate variability with cell subset proportions before and after stimulation with LPS. Monocytes account for the largest proportion of cells in PBMC that respond to LPS. Genes not expressed in non-monocyte cells in response to LPS are likely to show a lower fold change overall in PBMC samples with smaller proportions of monocytes [31]. Hence monocyte proportion is likely to be a factor in variation, and measuring expression in purified cell populations may reduce variability further. However, the inter-subject variability was very low in this study so differences in cell subset proportions did not have a strong effect.
The microarray quality control (MAQC) project [32] was designed to investigate variability in microarray experiments, but differs from this study in that its aim was to assess the quality of microarray technologies and therefore only investigated technical replication by hybridizing identical RNA samples. It did not aim to investigate biological replication and did not attempt to deconstruct the components of technical variation. Therefore, the results of this study are complementary to the MAQC project rather than being directly comparable to it.
In summary, we found that the variability attributable to technical and biological variation in a typicalin vitromicroarray
experiment in humans is low, and markedly less than the effect on gene expression of stimulation. This provides confidence that microarray-based studies can be used to detect changes in gene expression of biological interest in infectious diseases.
Methods
Ethics statement
This study received approval from the Human Research Ethics Committee (23096A) at the Royal Children’s Hospital, and informed consent was obtained verbally from the adult volunteers.
PBMC separation and stimulation
Five adult volunteers (two female and three male, age range 21– 34 years) had blood sampled on the same two days, one week apart, between 9 and 10 am (figure 3). Blood was collected into tubes containing endotoxin-free lithium heparin (Becton Dick-inson, Franklin Lakes, NJ, USA). PBMC were separated by Ficoll-Hypaque gradient (Amersham Biosciences, Uppsala, Sweden). Aliquots of 26106 PBMC were simultaneously stimulated with 1mg/ml LPS (Sigma Aldrich, Sydney, NSW, Australia) and incubated at 37uC with 5% CO2 for 0 and 24 hours. Each stimulation condition was undertaken in duplicate to enable comparison between two parallel stimulations of PBMC. At each time point, after centrifugation, TRIzolH (Invitrogen Life Tech-nologies, Invitrogen Corporation, Carlsbad, CA, USA) was added to the sample before storing at280uC. In addition, four samples Figure 6. Standard deviations of the different variability
components and gene expression values after LPS stimulation on the same log2scale, showing median standard deviation,
were divided in half and each half was amplified on a different day.
RNA preparation
RNA from all samples was extracted using the chloroform:phe-nol method within one month after stimulation before further storage at 280uC. Samples were then purified using the RNeasyTMkit (Qiagen Pty Ltd, Clifton Hill, VIC, Australia) and amplified using the MessageAmpTMII aRNA Kit (Ambion Inc, Austin, TX, USA) following the manufacturers’ protocols. All samples were analysed post-amplification using an Agilent 2100 Bioanalyser (Agilent Technologies, Forest Hill, VIC, Australia). All RNA samples were of satisfactory quality.
Cell population analysis by flow cytometry
For each subject on each day at each time point, 56105PBMC were stained with PE-conjugated CD14 (IOTestH, Immunotech, Marseille, France) and 56105 cells were stained with PE-conjugated mouse IgG1 as a negative isotype control Cells were incubated in phosphate buffered saline (PBS), 0.1% sodium azide and 20ml of the conjugated antibody at room temperature for 15 min, washed and resuspended in 300ml PBS with 2% formalin. Analysis was undertaken using a LSR II flow cytometer and BD FACSDivaHsoftware (Becton Dickinson).
Microarray hybridisation
The study used 36 spotted microarrays printed with the Compugen human 19,000 oligonucleotide library (http://www. cgen.com) and a selection of control probes at the Adelaide Microarray Facility (Adelaide, Australia). To minimize variability, all microarrays were from the same printing batch, except 2 slides (Hyb3 from subjects A and B). There were negligible differences between slides from the different batches. Amplified RNA (aRNA) was labelled by a direct platinum-based labelling technique using a kit (ULSTM aRNA labelling, Kreatech Biotechnology, Amster-dam, The Netherlands) following the manufacturer’s protocol. Each sample of experimental RNA (unstimulated and from each stimulation) was competitively hybridised with a common reference sample, obtained from pooling unstimulated RNA from subjects A–D from Day 2. For each pair of RNA samples to be hybridised to a slide, 2mg of the pooled reference RNA was labelled with ULSTM-Cy3 and 2mg of the individual sample RNA with ULSTM-Cy5. The samples amplified on a different day were also hybridised against the pooled RNA.
In addition, three hybridisations were undertaken using the same sample of RNA. This was done with two samples of RNA to provide replication. The two dye-coupled samples for each array were combined and fragmented using 4ml Fragmentation Reagents (Ambion). The labelled sample was mixed with 10ml 1 mg/ml human Cot-1 DNA (Invitrogen), 15ml 206SSC, 20ml deionised formamide (Sigma Aldrich), 20ml Kreatech solution (Kreatech Biotechnology) and 5ml 10% SDS, heated at 95uC for 5 min and cooled to room temperature. Each sample was applied to a slide which was incubated in a water bath in the dark at 42uC for 18 hours, washed and scanned using a GenepixH 4000B scanner (Molecular Devices, Sunnyvale, CA, USA).
Microarray data normalisation and analysis
Each scanned TIF image was quantified using Genepix Pro 6.0 software (Molecular Devices) to obtain foreground and back-ground intensity values for each spot. Genepix was configured to generate the custom morphological close-open background estimator, which is less variable than the more usual local
background estimators [33]. Pre-processing and quality assessment was done using the limma software package [34] for the R/ Bioconductor programming environment (http://www.biocon ductor.org). A small offset of 50 was added to the intensities after background correction to ensure that there were no negative background-corrected intensities or missing log-ratios, and to ensure that low-intensity log-ratios remained of low variability. Microarray data quality was checked using diagnostic image plots, MA-plots and control probes and was found to be satisfactory. Low-intensity probes were filtered on the basis of mean A-values, which give the average log2 intensity for each probe across all arrays. Log-ratios were print-tip loess normalised with span = 0.4, giving zero weight to probes with mean A-value,6.5 [19]. After normalization, control probes were removed from the data leaving only the Compugen library probes. To remove probes corre-sponding to transcripts not expressed in PBMCs, 33% of library probes with lowest mean A-values were filtered before subsequent analysis.
A linear model approach was used to analyse all the microarrays for the five individuals together. A multi-level mixed linear model was fitted to the normalized log-ratio expression data for each probe using the lmer() function in lme4 package for R [6]. The multi-level variance components were estimated by restricted maximum likelihood (REML) and the fixed effects were estimated by generalised least squares. The principle underlying the estimation of variance at each level of the experiment (by maximizing the REML likelihood) was the subtraction of the variance at each level below it. For example, the variability (s2)
between technical replication at the level of amplification is the sum of the variability at the level of amplification and the variability at the level of hybridisation (s2Amp+s2Hyb). Therefore
by determining the variability introduced at the lowest level, hybridisation (s2Hyb), the variability introduced at the level of
amplification can be calculated ((s2Amp+s2Hyb)2(s2Hyb) =s2Amp).
Similar calculations provide the variability at each level higher. The mixed linear model included fixed effects for sex and LPS treatment, and random effects for each level of variability in the experimental design (figure 1, table 1). The model can be represented by the formula:
M~SexzLPS treatmentzSubjectzSubject:
LPSzDayzDay:LPSzStimulation tubez
AmplificationzResidual
where M is the log2 expression value of a gene from an individual microarray slide. The mixed model analysis decon-structed the overall variability into the variability attributable to each of the different components. ‘Subject:LPS’ and ‘Day:LPS’ refer to the interaction between the fixed effect of stimulation with LPS and the variables of subject and day respectively (see section on LPS effect). ‘Residual’ is the variance component attributable to hybridisation, but also includes any other factors contributing to variability downstream of amplification.
To determine the variability with LPS stimulation, the interaction between LPS and different subjects and different days (designated Subject:LPS and Day:LPS respectively) was included in the model. The variance of MLPSwas determined by adding the measurement error or variance (s2) for each of the variance
components including the Residual component:
J^var (MLPS)~s2
Subject:LPSzs 2
Day:LPSzs 2 Stimzs
2 Ampzs
The Compugen-supplied GenBank accession numbers were mapped to gene symbols using SOURCE [35] and the UniGene build of 2nd September 2006. The study is MIAME compliant.
Author Contributions
Conceived and designed the experiments: PAB GKS RRB NC. Performed the experiments: PAB. Analyzed the data: PAB GKS. Contributed reagents/materials/analysis tools: GKS. Wrote the paper: PAB GKS RRB NC.
References
1. Novak JP, Sladek R, Hudson TJ (2002) Characterization of variability in large-scale gene expression data: implications for study design. Genomics 79: 104–113. 2. Whitney AR, Diehn M, Popper SJ, Alizadeh AA, Boldrick JC, et al. (2003) Individuality and variation in gene expression patterns in human blood. Proc Natl Acad Sci USA 100: 1896–1901.
3. Cheung VG, Conlin LK, Weber TM, Arcaro M, Jen KY, et al. (2003) Natural variation in human gene expression assessed in lymphoblastoid cells. Nat Genet 33: 422–425.
4. Morley M, Molony CM, Weber TM, Devlin JL, Ewens KG, et al. (2004) Genetic analysis of genome-wide variation in human gene expression. Nature 430: 743–747.
5. Kerkhoven RM, Sie D, Nieuwland M, Heimerikx M, De Ronde J, et al. (2008) The T7-primer is a source of experimental bias and introduces variability between microarray platforms. PLoS ONE 3: e1980.
6. Pinheiro JC, Bates DM (2000) Mixed-effects models in S and S-PLUS. Statistics and Computing Series: Springer.
7. Asai K, Hiki N, Mimura Y, Ogawa T, Unou K, et al. (2001) Gender differences in cytokine secretion by human peripheral blood mononuclear cells: role of estrogen in modulating LPS-induced cytokine secretion in an ex vivo septic model. Shock 16: 340–343.
8. Aulock SV, Deininger S, Draing C, Gueinzius K, Dehus O, et al. (2006) Gender difference in cytokine secretion on immune stimulation with LPS and LTA. J Interferon Cytokine Res 26: 887–892.
9. Wachulec M, Peloso E, Satinoff E (1997) Individual differences in response to LPS and psychological stress in aged rats. Am J Physiol 272: R1252–1257. 10. Brockdorff N, Ashworth A, Kay GF, Cooper P, Smith S, et al. (1991)
Conservation of position and exclusive expression of mouse Xist from the inactive X chromosome. Nature 351: 329–331.
11. Yang Z, Yu CY (2000) Organizations and gene duplications of the human and mouse MHC complement gene clusters. Exp Clin Immunogenet 17: 1–17. 12. Poindexter NJ, Walch ET, Chada S, Grimm EA (2005) Cytokine induction of
interleukin-24 in human peripheral blood mononuclear cells. J Leukoc Biol 78: 745–752.
13. Jozefowski S, Sulahian TH, Arredouani M, Kobzik L (2006) Role of scavenger receptor MARCO in macrophage responses to CpG oligodeoxynucleotides. J Leukoc Biol 80: 870–879.
14. Hintz KA, Rassias AJ, Wardwell K, Moss ML, Morganelli PM, et al. (2002) Endotoxin induces rapid metalloproteinase-mediated shedding followed by up-regulation of the monocyte hemoglobin scavenger receptor CD163. J Leukoc Biol 72: 711–717.
15. Schober I, Braun R, Reiser H, Munk K, Leroux M, et al. (1984) la-positive T lymphocytes are the producer cells of interferon gamma. Exp Cell Res 152: 348–356.
16. Adrain C, Duriez PJ, Brumatti G, Delivani P, Martin SJ (2006) The cytotoxic lymphocyte protease, granzyme B, targets the cytoskeleton and perturbs microtubule polymerization dynamics. J Biol Chem 281: 8118–8125. 17. Lee PD, Sladek R, Greenwood CM, Hudson TJ (2002) Control genes and
variability: absence of ubiquitous reference transcripts in diverse mammalian expression studies. Genome Res 12: 292–297.
18. Ritchie ME, Silver J, Oshlack A, Holmes M, Diyagama D, et al. (2007) A comparison of background correction methods for two-colour microarrays. Bioinformatics 23: 2700–2707.
19. Smyth GK, Speed TP (2003) Normalization of cDNA microarray data. Methods 31: 265–273.
20. Smyth GK, Michaud J, Scott HS (2005) Use of within-array replicate spots for assessing differential expression in microarray experiments. Bioinformatics 21: 2067–2075.
21. Yang YH, Speed T (2002) Design issues for cDNA microarray experiments. Nat Rev Genet 3: 579–588.
22. Moller-Levet CS, West CM, Miller CJ (2007) Exploiting sample variability to enhance multivariate analysis of microarray data. Bioinformatics 23: 2733–2740. 23. Kim KY, Chung HC, Rha SY (2009) A weighted sample size for microarray datasets that considers the variability of variance and multiplicity. J Biosci Bioeng 108: 252–258.
24. Su SD, Ward MM, Apicella MA, Ward RE (1990) Analysis of the immune response to lipopolysaccharide. Existence of an interspecies cross-reactive idiotype associated with anti-lipid A antibodies. J Immunol 145: 2994–3001. 25. Ashdown H, Poole S, Boksa P, Luheshi GN (2007) Interleukin-1 receptor
antagonist as a modulator of gender differences in the febrile response to lipopolysaccharide in rats. Am J Physiol Regul Integr Comp Physiol 292: R1667–1674.
26. Kimura Y, Yaegashi Y, Sato N (1999) Tumor necrosis factor-alpha production after esophageal cancer surgery: differences in the response to lipopolysaccharide stimulation among whole blood, pleural effusion cells, and bronchoalveolar lavage fluid cells. Surg Today 29: 10–15.
27. Holloway AJ, Oshlack A, Diyagama DS, Bowtell DD, Smyth GK (2006) Statistical analysis of an RNA titration series evaluates microarray precision and sensitivity on a whole-array basis. BMC Bioinformatics 7: 511.
28. Bryant PA, Trinder J, Curtis N (2004) Sick and tired: Does sleep have a vital role in the immune system? Nat Rev Immunol 4: 457–467.
29. Sureda A, Ferrer MD, Tauler P, Romaguera D, Drobnic F, et al. (2007) Effects of exercise intensity on lymphocyte H2O2 production and antioxidant defences in soccer players. Br J Sports Med.
30. De Feo P, Horber FF, Haymond MW (1992) Meal stimulation of albumin synthesis: a significant contributor to whole body protein synthesis in humans. Am J Physiol 263: E794–799.
31. Bryant PA, Smyth GK, Robins-Browne R, Curtis N (2009) Detection of gene expression in an individual cell type within a cell mixture using microarray analysis. PLoS ONE 4: e4427.
32. Casciano DA, Woodcock J (2006) Empowering microarrays in the regulatory setting. Nat Biotechnol 24: 1103.
33. Yang YH, Buckley M, Dudoit S, Speed T (2002) Comparison of methods for image analysis on cDNA microarray data. Journal of Computational and Graphical Statistics 11: 108–136.
34. Smyth GK (2005) Limma: linear models for microarray data. In: Gentleman R, Carey V, Dudoit S, Irizarry R, Huber W, eds. Bioinformatics and Computational Biology Solutions using R and Bioconductor. New York: Springer. pp 397–420.