Detection of PNH cells by low cytometry,
using multiparameter analysis
Detecção de células com fenótipo HPN por citometria de fluxo,
utilizando análise multiparamétrica
Juliana Maria Camargos Rocha1; Maria Luíza Silva2; Marcelo Eduardo de Lima Souza3; Mitiko Murao4; Sérgio Schusterschitz da Silva Araújo5; Silvana Maria Elói Santos6
First submission on 13/09/13; last submission on 28/11/13; accepted for publication on 29/11/13; published on 20/04/14
1. Master’s degree in Pathology from Universidade Federal de Minas Gerais (UFMG); assistant professor at the Medical School of UFMG.
2. Doctorate in Health Sciences from Centro de Pesquisas René Rachou – Fundação Oswaldo Cruz (Fiocruz); biochemist/pharmacist at Hospital das Clínicas (HC) of UFMG. 3. Specialty training in Clinical Pathology at UFMG; clinical pathologist at HC/UFMG and Fundação Hemominas.
4. Master’s degree in Health Sciences from UFMG; hematologist at HC/UFMG and Fundação Hemominas. 5. Specialty training in Hematology at UFMG; hematologist at HC/UFMG.
6. Post-doctoral degree in Immunology from Fiocruz; full professor at the Medical School of UFMG.
ABSTRACT
Introduction: The laboratory diagnosis of paroxysmal nocturnal hemoglobinuria (PNH), disease that is categorized by reduced synthesis of glycosylphosphatidylinositol (GPI) anchor, is based on the detection of blood cells deicient in GPI-anchored proteins by low cytometry. PNH clones have been detected in patients with aplastic anaemia (AA) and myelodysplastic syndrome (MDS), with therapeutic implications. Objectives: To validate a sensitive assay for detection of GPI-anchored protein-deicient cells, by low cytometry, and to analyze the clone frequency in AA and MDS patients. Methods: Samples from 20 AA patients, 30 MDS patients and 20 adult volunteers (control group) were analyzed using monoclonal antibodies to CD16, CD24, CD55 and CD59 (neutrophils); CD14 and CD55 (monocytes); CD55 and CD59 (erythrocytes); besides luorescent aerolysin reagent (FLAER) (neutrophils and monocytes) and lineage markers. The proportions of PNH cells detected in neutrophils and monocytes, using different reagent combinations, were compared by analysis of variance (ANOVA) and Pearson’s correlation. Results: PNH cells were detected in ive (25%) AA patients, and the proportions of PNH cells varied from 0.14% to 94.84% of the analyzed events. PNH cells were not detected in the MDS patients. However, by the analysis of these samples, it was possible to identify the technical challenges caused by the presence of immature and dysplastic circulating cells. FLAER showed clear distinction of GPI-deicient cells. Conclusion: Multiparameter low cytometry analysis offers high sensitivity and accuracy in the detection of subclinical PNH clones. FLAER shows excellent performance in detection of PNH neutrophils and monocytes.
Key words: paroxysmal nocturnal hemoglobinuria; FLAER; low cytometry; aplastic anaemia; myelodysplastic syndromes.
INTRODUCTION
Paroxysmal nocturnal hemoglobinuria (PNH), a rare acquired disease, clinically characterized by intravascular hemolysis, bone marrow failure, and recurrent episodes of venous thrombosis, ensues genetic alterations of hematopoietic stem cells, involving the phosphatidylinositol glycan-class A (PIG-A)
gene(3, 13, 18). The involved different mutations result in the deicient synthesis of glycosylphosphatidylinositol (GPI)-anchor molecule and the resulting partial or absolute deiciency, in all blood cell
lineages, ofthe expression of GPI-anchored membrane proteins, like CD55, CD59, CD14, CD16, CD24, CD48, among others(1, 7, 15, 18).
The relationship between PNH and acquired bone marrow disorders, such as aplastic anaemia (AA) and myelodysplastic syndrome (MDS), has been a frequent object of study(5, 15, 20). Small cell clones with a PNH-like phenotype have been detected in AA and MDS patients(5, 9, 14, 20, 25, 27), and their presence has been associated with the best response to immunosuppressive treatment
in some studies(8, 16, 19, 26).
Flow cytometry is nowadays considered the methodology of choice for detection of PNH clones(3, 15). It is highly sensitive and speciic; able to analyze erythrocytes, leukocytes, and platelets; detect and quantify small populations of PNH cells; and distinguish cells with partial (type II PNH cells) or total (type III PNH cells) deiciency of GPI-anchored proteins(3, 10, 15, 24). However, there is still great methodological variability between assays conducted in different clinical laboratories, especially as to the choice of monoclonal antibodies, the used analysis strategies, and the deinition of clone positivity criteria(17). Guidelines of the Clinical Cytometry Society, published by Borowitz et al.(3), suggest detecting the expression deiciency of at least two GPI-anchored proteins, in two distinct cell lineages, to minimize the possibility of false-positive results. For heightened sensitivity, acquisition of a large number of events and rigorous selection of the studied cell population are recommended(3). Besides the speciic monoclonal antibodies, the luorescent aerolysin reagent (FLAER), recently developed, has been used(4). It is a proaerolysin variant, secreted by the bacterium Aeromonas hydrophila, which selectively binds with high afinity to the glycan portionof GPI(10, 21). Its usage allows direct assessment of the GPI expression in different cell lineages, except erythrocytes, and provides greater analytical sensitivity(10, 21, 22).
Sutherland et al.(23), in a recent publication of a practical guide, reinforced the previous recommendations for high-sensitivity tests, emphasizing the technical aspects, especially the issues related to the choice of reagents of better performance.
The aim of this study was to validate, in a clinical laboratory, a sensitive technique for the detection of cells with a PNH phenotype, using different reagents (monoclonal antibodies and FLAER) and multiparameter analysis strategies; and to assess its frequency in AA and MDS patients.
METHODS
Patients
A sample of 20 AA patients (11 women, 9 men, mean age: 34 years) and 30 MDS patients (13 men, 17 women, mean age: 63 years) treated in the Hematology Service of Hospital das Clínicas da Universidade Federal de Minas Gerais (HC/UFMG) was evaluated. Blood transfusions performed in the months preceding material collection were not a restriction to patient participation, as they do not interfere in the analysis of leukocyte populations(11). The control group was formed with 20 adult volunteers (13 women, 7 men, mean age: 44 years), with no hematological diseases. All participants signed the informed consent, approved by the Committee on Ethics in Research of UFMG.
Reagents
The following monoclonal antibodies were used: CD14-FITC (clone MP9); CD15-APC (clone H198); CD16-PerCP-Cy5.5 (clone 3G8); CD24-PE (clone ML5); CD33-APC (clone WM53); CD45-PerCP (clone 2D1); CD59-FITC (clone p282-H19); CD235a-PE (clone GA-R2 HIR2) (BD Biosciences; San Jose, CA); CD55-PE (clone 67) (AbD Serotec; Oxford, UK); CD45-FITC (clone AP4) (EasyPath; SP, Brazil); besides reagent FLAER-AF488 (Pinewood Scientiic Services; Victoria, BC, Canada), acquired in liquid formulation, ready for use. The reagent combinations used for the detection of PNH erythrocytes, neutrophils, and monocytes are described in Table 1.
Sample preparation
Peripheral blood samples were collected in ethylenediaminetetraacetic acid (EDTA), from July to December 2011.
For erythrocyte analysis, monoclonal antibodies were added to 50 µl of erythrocyte suspension at 0.1%, in albumin solution. Preparations were incubated for 30 minutes, at 37ºC, shielded from light, and later submitted to washing and resuspension in
saline.
For leukocyte analysis, monoclonal antibodies and FLAER were added to 100 µl of peripheral blood. Preparations were incubated for 30 minutes, at room temperature, and shielded from light. Later, erythrocyte lysis was performed, using 2 ml solution containing sodium citrate dihydrate, diethylene glycol and formaldehyde, in each tube. After a new 10-minute incubation period, preparations were centrifuged, washed and resuspended in phosphate buffered saline (PBS).
TABLE 1 – Combinations of luorochrome-conjugated reagents used for analysis of erythrocytes, neutrophils and monocytes
Cell
populations Tubes
Reagents
FITC/AF488 PE PerCP-Cy5.5PerCP/ APC
Erythrocytes 12 CD59 CD59 CD235aCD55
Neutrophils 1 2 3 CD59 CD45 FLAER CD55 CD24 CD24 CD45 CD16 CD45 CD15 CD15 CD15
Monocytes 12 CD14
Strategies for data acquisition and analysis
Acquisition of events and parameter analysis were performed in equipment FACScalibur – Becton Dickinson, in program CELLQuestTM. Erythrocytes (20 thousand events) were acquired on a logarithmic scale, and leukocytes (50 thousand events), on a linear scale, initially identiied by cell size (forward scatter [FSC]) and internal complexity (side scatter [SSC]) parameters. The selection of cell populations was based on the use of lineage markers and multiparameter analysis with combinations of regions.
Neutrophils were identiied by FSC and SSC parameters, and by the characteristic expressions of non-GPI-anchored pan-leukocyte antigen CD45 and lineage marker CD15. Two regions were
initially selected, through SSC/CD45 and SSC/CD15 parameters, in the respective dot-plot graphs. A third region was selected, from the combined assessment of CD45/CD15 expression, in a density graph. Neutrophils of the three combined regions were examined for the expression of CD59/CD55, CD24/CD16 and FLAER/CD24. Cells with a PNH phenotype were deined by the simultaneous lack of expression for both analyzed markers in each tube (double negative population, located in the lower left quadrant of the respective dot-plot graphs). This analysis is illustrated in Figure 1.
Monocytes were identiied using FSC and SSC parameters, and by expression of non-GPI-anchored CD45 and lineage marker CD33. Following the previously described strategy, three regions
FIGURE 1 – Analysis, by flow cytometry, of CD24 and CD16 expression in neutrophils of a peripheral blood sample from a control group subject
were selected based on parameters SSC/CD45, SSC/CD33 and CD45/CD33 (density graph). Monocytes of the three combined regions were assessed as to the expression of CD14/CD55 and FLAER/CD55. PNH cells were deined by the simultaneous lack of expression of both markers analyzed in each tube.
Erythrocytes were selected by different strategies, in both tubes. The irst tube did not include a cell lineage marker; therefore, erythrocytes were selected just by physical parameters, and the selected population was assessed as to the expression of markers CD55 and CD59. PNH cells were deined by the simultaneous absence of both markers (double-negative population) expression. The second tube included glycophorin (CD235a) as lineage marker, and the erythrocyte population was selected based on parameters SSC/glycophorin, in a density graph. Antigen CD59 expression was assessed in the selected population, and the deicient cells in its expression were characterized as PNH cells.
Establishment of positivity criteria for PNH clone
For the determination of the lower limit of analytical sensitivity of the test, mean, standard deviation and the 95th and 100th percentiles of double-negative cells were established as parameters for the populations of erythrocytes, neutrophils and monocytes, in samples from the control group (Table 2).
in accordance with available recommendations in the literature, for detection of deicient expression of at least two GPI-anchored proteins in two different cell lineages(3, 15, 23).
The deinitions in relation to the cut-off point were not valid for the tube assessing the expression of GPI-anchored proteins in erythrocytes selected just for physical parameters, with no use of the lineage marker (glycophorin). All the calculated values (mean, mean + 2 SD, 95th and 100th percentiles) were signiicantly higher than the others, owing to the probable inclusion of more events in the region selected for analysis.
Statistical analysis
The descriptive analysis of variables for the characterization of control groups and patients was carried out, and the frequency of PNH cells was determined. The comparison of PNH clone sizes detected in neutrophils and monocytes by the different reagent combinations was made by analysis of variance (ANOVA) and multiple comparisons, and through the calculation of Pearson’s coeficients of correlation, after veriication of the Gaussian distribution of positive results, by normality tests (Q-Q plot and Kolmogorov-Smirnov test). Statistical programs SPSS, version 15.0 (SPSS, Chicago, IL, USA) and GradPad Prism 6 (San Diego, CA, USA) were used.
RESULTS
Profiles of PNH clones detected in AA patients
PNH cells were detected in ive (25%) of the 20 AA patients. Cell populations with a PNH phenotype were clearly distinct from normal cells, forming consistent clusters in dot-plot graphs. The technique was effective in detecting large clones, which affect a signiicant proportion of the analyzed events; and small subclinical clones, with lower proportion of affected cells, including clones in less than 1% of the analyzed leukocytes (Table 3). Figure 2 illustrates the representations of PNH clone of case 5, detected in the populations of neutrophils, monocytes and erythrocytes.
There was no statistically signiicant difference between the proportions of PNH phenotype cells detected in the populations of monocytes and neutrophils, for the different combinations of reagents used, in a study carried out by means of ANOVA and multiple comparisons. The similarity between proportions of PNH cells detected by the different combinations of reagents was conirmed by the results of Pearson’s coeficients of correlation (r ≥ 0.911).
In the analysis of erythrocyte populations of PNH-positive samples, separation between type II and type III cells (partial or TABLE 2 – Measures of central tendency, dispersion and percentiles of
control samples, expressed in percentage of altered cells in relation to the total analyzed events, fractioned by cell populations and reagent combinations
Cell
populations
Reagent
combinations
Statistical calculations
Mean Mean + 2 SD 95th percentile 100th percentile Neutrophils CD59-/CD55- CD24-/CD16- FLAER-/CD24-0.002 0.004 0.003 0.01 0.016 0.015 0.01 0.02 0.02 0.01 0.02 0.02 Monocytes CD14-/CD55- FLAER-/CD55-0.021 0.004 0.087 0.04 0.08 0,076 0.08 0.08 Erythrocytes CD59-/CD55-CD59-/Glyc+ 0.192 0.024 0.452 0.078 0.457 0.09 0.46 0.09 SD: standard deviation; FLAER: fluorescent aerolysin reagent; Glyc: glycophorin.
TABLE 3 – Proportions of GPI-deicient cells detected in positive samples for the presence of the clone, by reagent combinations, in the three studied cell populations. Results expressed in percentage value (%)
Cases Neutrophils Monocytes Erythrocytes
CD59-/55- CD24-/16- FL-/CD24- CD14- /55- FL-/CD55- CD59-/Glyc+
1 0.14 0.16 0.18 0.29 0.23 0.19
2 0.75 1.47 2.39 7.87 12.85 2.86
3 28.15 34.9 23.26 22.73 24.36 5.16
4 88.64 65.43 60.33 50.53 50.45 28.09
5 78.6 94.84 75.73 81.18 75.12 14.42
GPI: glycosylphosphatidylinositol; FLAER: fluorescent aerolysin reagent; Glyc: glycophorin.
FIGURE 2 – PNH clone detected in neutrophil (A), monocyte (B) and erythrocyte (C) populations, in a sample from a patient previously diagnosed as AA (case 5). PNH cells are present in large proportions in leukocyte populations and in lower proportion in erythrocyte populations
AA: aplastic anaemia; PNH: paroxysmal nocturnal hemoglobinuria.
complete deiciency of the expression of GPI-anchored proteins, respectively) was not evidenced. These samples revealed just types I and III cells.
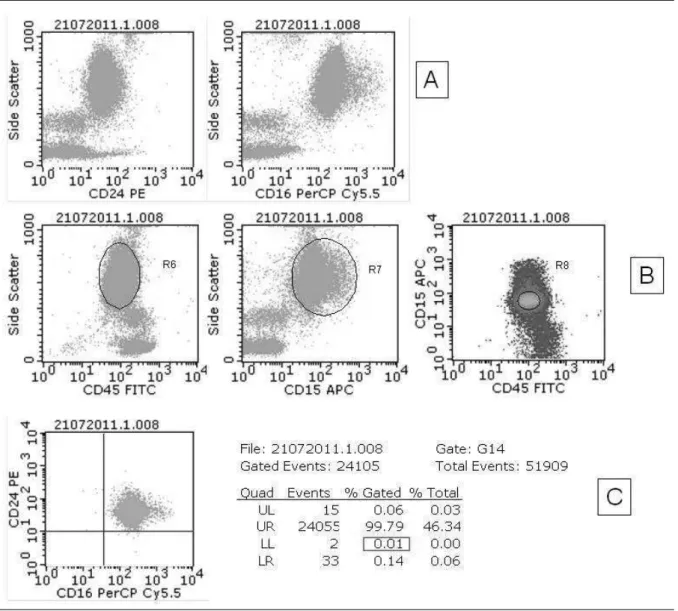
Analysis of samples from MDS patients
evidence technical difficulties arising due to cell dysplasia and immaturity characteristic of the disease, and to check the care required for their analysis. In the studied group, hypogranular neutrophils, presenting characteristic reduction of the internal complexity parameter (SSC), and/or immature monocytes, with reduced expression of CD45, were observed in 53% of patients, determining overlap between neutrophils and monocytes on the graph SSC/CD45, as demonstrated by Wang et al.(27). Figure 3 illustrates the overlapping cell populations and the impact of the gating strategy on neutrophil selection in a sample from a MDS patient. It shows that the attempt to separate neutrophils, using just CD45/SSC expression parameters, determines contamination of the selected gate (G6 = R6), and, consequently, erroneous identification of double-negative events for the markers of interest, in significant proportions (dot-plot graph 3B). The introduction of the cell lineage marker CD15 and the strategy of analysis by region combination, defined by graphs CD45/SSC (G6 = R6) and CD15/SSC (G7 = R7), with G16 = R6 + R7, promote better
selection of cell population. However they still determine the finding of double-negative events for the markers of interest, in proportions higher than 0.1% of the total analyzed events (dot-plot graph 3C). The selection of a third region, from the simultaneous evaluation of CD45/CD15 expression in a density graph (G8 = R8), and the strategy of combination of three regions for the selection of the neutrophil population (G14 = R6 + R7 + R8), foster the selection of pure cell population and the precise identification of double-negative events for the markers of interest, allowing to reach the limit of analytical sensitivity of 0.1%, established in this study (dot-plot graph 3D).
Immature and/or dysplastic cells, with reduced CD14, CD16 and/or CD55 expression were observed in approximately 50% of the samples from MDS patients, in accordance with reports
by other authors(3, 6, 27). The presence of cells with reduced expression of these antigens, in itself, did not characterize a PNH clone, because it does not form a distinct double-negative population.
FIGURE 3 – Impact of multiparameter analysis strategy on the selection of neutrophils, in a sample from a MDS patient
Reaction pattern of FLAER in the analyzed
samples
Intense FLAER reaction was observed in neutrophils and monocytes, favoring clear and precise separation between normal cells and those not presenting GPI molecules. No assessed sample showed discordance between the reaction of FLAER and the expression of GPI-anchored proteins. As illustrated in Figure 4, the ive samples of the study identiied as positive for PNH clone (graphs B to F) showed the formation of two distinct cell populations in the FLAER analysis. The reagent capacity to detect cells with a PNH phenotype was observed in the detection of both large cell clones (graphs D to F) and cell clones considered small (graphs B and C), including clone with proportion of cells lower than 1% of the analyzed events.
Summary of results
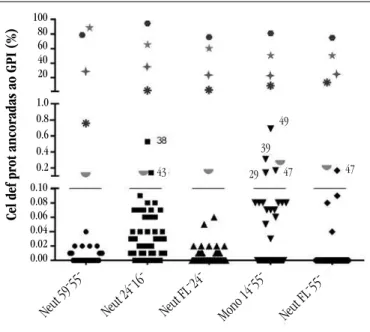
Figure 5 presents the obtained results (control group, AA, MDS), by reagent combinations, in the populations of neutrophils and monocytes. The control group and MDS patients presented double-negative cells for the markers analyzed in each tube, in proportions lower than 1%, therefore were considered negative for the presence of PNH clone according to the established positivity
criteria. Patients deined as positive for the presence of the clone presented cells with a PNH phenotype in proportions higher than 0.1%, detected by the different reagent combinations used, in the populations of neutrophils and monocytes. Six patients presented cells altered in proportions between 0.1% and 1% in isolated tubes, not characterizing the presence of PNH clone.
DISCUSSION
The detection of blood cells deicient in GPI-anchored antigens, by low cytometry, represents a speciic test for PNH, considering that this immune proile is not seen in other conditions. However, to introduce the test in the clinical laboratory routine, it is necessary to establish adequate method standardization, aiming at ensuring analytical sensitivity and accuracy in the detection of cells with a PNH phenotype. The methodology developed in this study was standardized according to current literature recommendations, as to selection of reagents, analysis strategy and deinition of positivity criteria for PNH clone(3, 18, 23, 27). It was veriied that the used multiparameter strategy of analysis, recommended by the Clinical Cytometry Society for high-sensitivity tests, was essential to minimize the occurrence
FIGURE 4 – Acquisition graphs and histograms of analysis, illustrating staining of neutrophils with FLAER, in different situations
A) individual of the control group; B) and C) detection of PNH clones with small proportions of altered cells; D) and F) detection of larger PNH clones, with increasing proportions of altered cells. Graphs B to F represent analysis of five samples of the study, identified as positive for PNH clone
FIGURE 5 – Results obtained in the detection of GPI-anchored protein-deficient cells in samples from the control group and AA and MDS patients, by reagent combinations, in the populations of neutrophils and monocytes
The black bar represents the cut-off point (0.1%) chosen for the detection of PNH cells. Patients with PNH clone are represented in colored symbols. Patients who present altered cells in proportions higher than 0.1% in isolated tubes, not characteristic of PNH clone, are represented by black symbols, above the bar, followed by the respective identification numbers of the databank
GPI: glycosylphosphatidylinositol; AA: aplastic anaemia; MDS: myelodysplastic syndrome; PNH: paroxysmal nocturnal hemoglobinuria.
of false-positive results and to permit the precise identiication of small populations of cells with a PNH phenotype, as described by Borowitz et al.(3). The use of lineage markers and the strategy of cell population selection by combinations of regions reduced the possibility of inclusion of other events in the gate selected for analysis (cells of other lineages, debris, spurious events), which could be erroneously interpreted as PNH clone cells(3, 10, 18, 23, 27). Considering the double-negative population on dot-plot graphs allowed to reach greater discrimination and accuracy in the identiication of small altered cell populations, corroborating the published recommendations, which highlight the importance of demonstrating the simultaneous deiciency of two GPI-anchored antigens in the same cell(3, 10, 18, 23). Thus, reductions or partial losses of expression of an isolated marker were not characterized as PNH phenotype.
The presence of PNH clones in 25% of patients diagnosed as AA is in line with literature data, which describe the frequency of PNH cells in 22% to 68% of AA patients(5, 8, 9, 12, 19, 20, 25). This prevalence variability occurs due to methodological differences between the used tests, which deine different limits of analytical sensitivity. It is important to emphasize that the ive patients considered positive had PNH cells identiied by all the used reagents and in the three studied cell populations (erythrocytes, neutrophils, and
monocytes), what indicates that the test presents accuracy in the detection and quantiication of cells with PNH phenotype, even when they are in small proportions(3, 20).
Non detection of deicient cells in GPI-anchored proteins in the samples from MDS patients may have been consequence of the lower frequency of PNH clones in this population(9, 14, 20, 26, 27), accompanied by the relative small number of analyzed patients. It is valid to stress that among the 30 MDS patients, 25 presented low-risk disease (International Prognostic Scoring System [IPSS] low or intermediate-1), however just two had refractory anaemia, the morphologic subgroup most frequently presenting the PNH clone(8, 14, 20, 26, 27). The processing and analysis of samples from MDS patients allowed verifying the technical dificulties arising due to the presence of cell dysplasias and immaturity. It was observed, according to data by Wang et al.(27), that to overcome the dificulty in separating populations of neutrophils and leukocytes, it is essential to use of cell lineage markers and appropriate strategies for the rigorous selection of the studied populations. In the analysis of these samples it is important to consider that GPI-anchored proteins may vary in expression according to the stage of cell maturity(5, 6, 27). In the presence of circulating immature and dysplastic cells, the isolated analysis of these markers in the populations of neutrophils and monocytes may determine the occurrence of false-positive results for the presence of PNH clone. The strategy to assess the expression of two markers in each tube and to consider as representatives of PNH clone just cells that are negative for both, simultaneously, proved effective in reducing this risk, increasing analytical precision and speciicity, as previously recommended by Borowitz et al.(3) and Wang et al.(27).
In the analysis of erythrocytes, the use of glycophorin was considered essential to exclude non-cellular events and debris, making it possible to reach lower limits of clone detection, as
observed by Sutherland et al.(22, 23). The tube employed for the simultaneous analysis of CD55 and CD59 expression, with no use of glycophorin for population selection, presented elevated background rates, not allowing reaching the lower detection limit of 0.1%. In three of the ive patients who presented PNH clones, the percentage of affected erythrocytes was signiicantly smaller than the percentage of leukocytes deicient in GPI-anchored proteins (Table 3). Data from the literature justify this inding on the grounds of intravascular hemolysis mediated by complement and blood transfusions, which determine reduced proportion of PNH erythrocytes(3, 22). Thus, according to other authors(18, 22), our study conirms that the proportions of neutrophils and monocytes deicient in GPI-anchored proteins represent PNH clone size more accurately than the proportions of erythrocytes.
Cel def prot ancor
adas ao GPI (%)
Neut 59 - 55
-Neut 24 - 16
-Neut FL - 24
-Neut FL - 55
Sample preparation for leukocyte analysis includes the use of an erythrocyte lysis solution prepared “in house”. As an alternative, it is possible to use commercial lysis solutions, although they have
not been tested in this study(3, 23).
Monocyte analysis proved to be technically dificult, due to the usual small number of these circulating cells, especially in pan-cytopenic patients. This fact may have contributed to the research accuracy reduction of PNH cells in this cell lineage and encouraged the inding of proportions higher than 0.1% of altered monocytes in isolated tubes, without, however, characterizing the presence of PNH clones (Figure 5). It is important to highlight that these events did not form consistent clusters and these indings were not reproduced in other tubes, being considered false-positive results.
Although all these marker combinations have proved effective to detect the clone, it was observed that monoclonal antibodies directed towards antigens CD16 and CD24 (neutrophils), CD14 (monocytes) and FLAER reagent (neutrophils and monocytes) identiied PNH cells with sharper distinction, promoting clear separation between normal and altered populations. The same was not observed in relation to markers CD59 (neutrophils) and CD55 (neutrophils and monocytes), in accordance with data described by Hernández-Campo et al.(6) and with considerations by Sutherland et al.(23). The variability observed in leukocyte staining with CD55 and CD59 may have been resulting from the variable number of erythrocytes in the samples and the selection of the “stain-lyse-wash” protocol for their processing(10). These observations are in accordance with the reports
by Wang et al.(27), which demonstrated superiority of combination CD16/CD66b over CD59/CD55 in the detection of PNH granulocytes, in a study involving a signiicant number of MDS patients.
FLAER has still not been registered by the Brazilian Health
Surveillance Agency (Anvisa) for use in Brazil, despite the proved beneits in the detection of cells with a PNH phenotype. It allows evident discrimination between normal and altered cells(4, 17, 23), and, as it detects the GPI molecule, it is superior in situations in which one or more GPI-linked surface markers present reduced expression, erroneously suggesting the presence of cells with a PNH phenotype(2). This study permitted us to conirm the good performance of the reagent, described in the literature(3, 4, 10, 17, 21, 23). The tubes that included FLAER in the analysis of neutrophils and monocytes presented results in accordance with the tubes that used only monoclonal antibodies in the detection of small and large clones. The reagent acquired in liquid formulation presented good stability in temperatures between 4°C and 8°C, and was considered easy to handle.
In conclusion, the multiparameter analysis by low cytometry presents sensitivity and accuracy in the detection of small proportions of cells with a PNH phenotype, being adequate for the research of subclinical clones in AA and MDS patients. The FLAER reagent presents excellent capacity in the detection of neutrophils and monocytes with a PNH phenotype. It also presents as advantages the power of clear discrimination between normal and altered cells and the high accuracy in the analysis of samples presenting cells in different stages of maturation and/or dysplastic.
RESUMO
Introdução: O diagnóstico laboratorial da hemoglobinúria paroxística noturna (HPN), doença caracterizada por deficiência de síntese da molécula de ancoragem glicosilfosfatidilinositol (GPI), baseia-se na detecção de células sanguíneas deficientes em proteínas ancoradas ao GPI, por citometria de fluxo. Clones de células com fenótipo HPN podem ser detectados em pacientes com anemia aplásica (AA) e síndrome mielodisplásica (SMD), com implicações terapêuticas. Objetivos: Validar técnica sensível para detecção de células HPN, por citometria de fluxo, e avaliar a frequência dos clones em pacientes com AA e SMD. Métodos: Amostras de 20 pacientes com AA, 30 pacientes com SMD e 20 voluntários (controles) foram analisadas, utilizando anticorpos monoclonais anti-CD16, CD24, CD55 e CD59 (neutrófilos); CD14 e CD55 (monócitos); e CD55 e CD59 (hemácias); além do reagente de aerolisinafluorescente (FLAER) (neutrófilos e monócitos) e marcadores de linhagem celular. A comparação do tamanho dos clones HPN detectados em neutrófilos e monócitos, pelas diferentes combinações de reagentes, foi realizada por análise de variância (ANOVA) e correlação de Pearson. Resultados: Em cinco (25%) pacientes com AA foram identificadas células HPN, em proporções entre 0,14% e 94,84% dos eventos analisados. O clone não foi detectado nos pacientes com SMD. Contudo, a análise dessas amostras permitiu evidenciar as dificuldades técnicas secundárias à presença de células imaturas e displásicas circulantes. O reagente FLAER propiciou separação precisa das células alteradas. Conclusão: A análise multiparamétrica por citometria de fluxo apresenta sensibilidade e acurácia na detecção de clones HPN subclínicos. O reagente FLAER apresenta excelente desempenho na detecção do clone HPN.
REFERENCES
1. ARRUDA, M. M. A. S. et al. Hemoglobinúria paroxística noturna: da isiopatologia ao tratamento. Rev Assoc Med Bras, v. 56, n. 2, p. 214-21,
2010.
2. BATTIWALLA, M. et al. Multiparameter low cytometry for the diagnosis
and monitoring of small GPI-deicient cellular populations. Cytometry B Clin Cytom, v. 78, n. 5, p. 348-56, 2010.
3. BOROWITZ, M. J. et al. Guidelines for the diagnosis and monitoring of paroxysmal nocturnal hemoglobinuria and related disorders by low cytometry. Cytometry B Clin Cytom, v. 78, n. 4, p. 211-30, 2010. 4. BRODSKY, R. A. et al. Improved detection and characterization of
paroxysmal nocturnal hemoglobinuria using luorescent aerolysin. Am J Clin Pathol, v. 114, n. 3, p. 459-66, 2000.
5. DUNN, D. E. et al. Paroxysmal nocturnal hemoglobinuria cells in patients with bone marrow failure syndromes. Ann Intern Med, v. 131,
n. 6, p. 401-8, 1999.
6. HERNÁNDEZ-CAMPO, P. M. et al. Normal patterns of expression of
glycosylphosphatidylinositol-anchored proteins on different subsets of peripheral blood cells: a frame of reference for the diagnosis of paroxysmal nocturnal hemoglobinuria. Cytometry B Clin Cytom, v. 70, n. 2, p. 71-81, 2006.
7. HILL, A.; RICHARDS, S.J.; HILLMEN, P. Recent developments in the understanding and management of paroxysmal nocturnal haemoglobinuria. Br J Haematol, v. 137, n. 3, p. 181-92, 2007. 8. ISHIYAMA, K. et al. Polyclonal hematopoiesis maintained in patients
with bone marrow failure harboring a minor population of paroxysmal nocturnal hemoglobinuria-type cells. Blood, v. 102, n. 4, p. 1211-6, 2003.
9. MACIEJEWSKI, J. P. et al. Relationship between bone marrow failure syndromes and the presence of glycosylphosphatidyl inositol-anchored protein-deicient clones. Br J Haematol, v. 115, n. 4, p. 1015-22, 2001.
10. MADKAIKAR, M. et al. Paroxysmal nocturnal haemoglobinuria: diagnostic tests, advantages, and limitations. Eur J Haematol, v. 83,
n. 6, p. 503-11, 2009.
11. MODESTO, T. M. et al. Importância e vantagem da citometria de luxo
frente aos testes de triagem no diagnóstico da hemoglobinúria paroxística noturna. Rev Bras Hematol Hemoter, v. 28, n. 4, p. 275-9, 2006.
12. MUKHINA, G.L. et al. Multilineage glycosylphosphatidylinositol anchor-deicient haematopoiesis in untreated aplastic anaemia. Br J Haematol, v. 115, n. 2, p. 476-82, 2001.
13. OKAMOTO, M. et al. High frequency of several PIG-A mutations in
patients with aplastic anemia and myelodysplastic syndrome. Leukemia, v. 20, n. 4, p. 627-34, 2006.
14. OKAMOTO, T. et al. Relationship between immunological
abnormalities and paroxysmal nocturnal hemoglobinuria-associated clones in myelodysplastic syndromes. Br J Haematol, v. 114, n. 3, p. 731-5, 2001.
15. PARKER, C. et al. Diagnosis and management of paroxysmal nocturnal hemoglobinuria. Blood, v. 106, n. 12, p. 3699-709, 2005. 16. PARKER, C. J. Paroxysmal nocturnal hemoglobinuria. Curr Opin Hematol, v. 19, n. 3, p. 141-8, 2012.
17. RICHARDS, S. J.; HILL, A.; HILLMEN, P. Recent advances in the diagnosis, monitoring, and management of patients with paroxysmal nocturnal hemoglobinuria. Cytometry B Clin Cytom, v. 72, n. 5, p. 291-8, 2007.
18. RICHARDS, S. J.; RAWSTRON, A. C.; HILLMEN, P. Application of low cytometry to the diagnosis of paroxysmal nocturnal hemoglobinuria.
Cytometry, v. 42, n. 4, p. 223-33, 2000.
19. SUGIMORI, C. et al. Minor population of CD55-CD59- blood cells predicts response to immunosuppressive therapy and prognosis in patients with aplastic anemia. Blood, v. 107, n. 4, p. 1308-14, 2006. 20. SUGIMORI, C. et al. Origin and fate of blood cells deicient in glycosylphosphatidylinositol-anchored protein among patients with bone marrow failure. Br J Haematol, v. 147, n. 1, p. 102-12, 2009.
21. SUTHERLAND, D. R. et al. Diagnosing PNH with FLAER and multiparameter low cytometry. Cytometry B Clin Cytom, v. 72, n. 3,
p. 167-77, 2007.
22. SUTHERLAND, D. R. et al. Use of a FLAER-based WBC assay in the primary
screening of HPN clones. Am J Clin Pathol, v. 132, n. 4, p. 564-72, 2009. 23. SUTHERLAND, D.R.; KEENEY, M.; ILLINGWORTH, A. Practical guidelines for the high-sensitivity detection and monitoring of paroxysmal nocturnal hemoglobinuria clones by low cytometry. Cytometry B Clin Cytom, v. 82, n. 4, p. 195-208, 2012.
24. VAN DER SCHOOT, C. E. et al. Deiciency of
glycosyl-phosphatidylinositol-linked membrane glycoproteins of leukocytes in paroxysmal nocturnal hemoglobinuria, description of a new diagnostic cytoluorometric assay. Blood, v. 76, n. 9, p. 1853-9, 1990.
25. WANG, H. et al. Relative increase of granulocytes with a paroxysmal nocturnal haemoglobinuria phenotype in aplastic anaemia patients: the high prevalence at diagnosis. Eur J Haematol, v. 66, n. 3, p. 200-5, 2001. 26. WANG, H. et al. Clinical signiicance of a minor population of paroxysmal nocturnal hemoglobinuria-type cells in bone marrow failure syndrome. Blood, v. 100, n. 12, p. 3897-902, 2002.
27. WANG, S. A. et al. Detection of paroxysmal nocturnal hemoglobinuria clones in patients with myelodysplastic syndromes and related bone marrow diseases, with emphasis on diagnostic pitfalls and caveats.
Haematologica, v. 94, n. 1, p. 29-37, 2009.
MAILING ADDRESS
Juliana Maria Camargos Rocha
Universidade Federal de Minas Gerais; Faculdade de Medicina; Av. Alfredo Balena, 190, sala 403; Santa Eigênia; CEP: 30130-100; Belo Horizonte-MG, Brazil; e-mail: [email protected].