UNIVERSIDADE FEDERAL DE MINAS GERAIS FACULDADE DE FARMÁCIA
ANA PAULA CRAIG CARNEIREIRO
CLASSIFICATION AND QUANTIFICATION OF DEFECTIVE
AND NON-DEFECTIVE COFFEES BY
FTIR AND NIR SPECTROSCOPY
ANA PAULA CRAIG CARNEIREIRO
CLASSIFICATION AND QUANTIFICATION OF DEFECTIVE AND
NON-DEFECTIVE COFFEES BY FTIR AND NIR SPECTROSCOPY
Tese apresentada ao Programa de Pós-Graduação em Ciências de Alimentos da Faculdade de Farmácia da Universidade Federal de Minas Gerais, como requisito parcial à obtenção do título de Doutor em Ciências de Alimentos.
Área de concentração: Qualidade de Alimentos.
Orientadora: Dra. Adriana Silva Franca
Your work is going to fill a large part of your life, and the only
way to be truly satisfied is to do what you believe is great
work. And the only way to do great work is to love what you
do. If you haven’t found it yet, keep looking. Don’t settle. As
with all matters of the heart, you'll know when you find it.
ACKNOWLEDGMENT
Foremost, I would like to express my immense gratitude to my advisor, Prof. Adriana Silva Franca, for the continuous support of my Ph.D. research, for her inestimable guidance, the opportunities that she provided me, and her confidence in me. This thesis would not have been possible without her efforts. I would like to thank Prof. Leandro Oliveira, who introduced me to Coffee Chemistry, and whose encouragement and insightful comments have been invaluable to my academic experience.
It gives me great pleasure in acknowledging Prof. Joseph Irudayaraj who gave me the opportunity of developing part of this work at the department of Agricultural and Biological Engineering at Purdue University. This opportunity led me to work on diverse, exciting projects and awakened in me the desire of pushing boundaries. Also, I would like to acknowledge Prof. Klein Ileleji who provided the NIR equipment.
I would like to thank each of my committee members, Prof. Tânia Maria Silveira, Prof. Flávio Borém, Prof. David Lee Nelson, and Prof. Marcelo Sena, for gently investing theirprecious timeto review thisthesis, sharing their expertise and for their incredible contribution to this work.
I would like to thank the Statistical Consulting Service of Purdue University for their help on software R. My sincere thanks also goes to Prof. Marcelo Sena, again, for sharing his unsurpassed knowledge on statistics and to Bruno Botelho for the stimulating discussions and help with Matlab.
A special thanks goes to my colleagues from UFMG, Cibele, Dani, Felipe, Fernando, Jean, Marcus, Nádia, Pablo and Rodrigo for the indispensable help in the lab and the enjoyable moments together. Also, I would like to thank all my team mates from Purdue, especially Nuri, for the friendship and collaborative work, and Asia and Namrata, for the pleasant conversations during the lunch times.
I would like to acknowledge FAPEMIG (Foundation for the Support of Research in the Minas Gerais State), for the Ph.D. scholarship and to CNPq (Brazilian National Counsel of Technological and Scientific Development), for the “sandwich” Ph.D. scholarship and financial support to this project.
RESUMO
A presença de grãos defeituosos é um importante parâmetro diretamente relacionado à qualidade do café, pois é associado a características sensoriais indesejáveis na bebida. Os grãos defeituosos que mais contribuem para a depreciação da bebida são os grãos pretos, ardidos e imaturos. O método convencional empregado na avaliação da qualidade de cafés torrados é baseado na análise sensorial da bebida ou “prova de xícara”, que demanda considerável tempo para ser executado, requer provadores treinados e depende de um controle rigoroso do grau de torração. Diante do exposto, este estudo teve como objetivo avaliar o potencial das técnicas espectroscópicas FTIR e NIR para a avaliação da qualidade de cafés com base na presença de grãos defeituosos. Grãos de café foram manualmente separados em cinco classes: sadio, ardido claro, ardido escuro, preto e imaturo. Cada uma das classes foi processada a três temperaturas (220 °C, 235 °C e 250 °C) e três níveis de torração (claro, médio e escuro) obtendo-se nove condições de torração. As amostras de café torrado foram então moídas, peneiradas e analisadas por DRIFTS, ATR-FTIR e NIR em um estudo classificatório. Os resultados de PCA indicaram que, com base nos espectros obtidos por DRIFTS, é possível discriminar as amostras em quatro grupos: (a) sadio, (b) preto, (c) ardido escuro e (d) ardido claro, com café imaturo dispersado entre os cafés ardidos. ATR-FTIR proporcionou a discriminação das amostras, apesar de não efetivamente, em dois principais grupos: (a) sadio e ardido claro, e (b) preto, ardido escuro e imaturo; enquanto NIR proporcionou a discriminação das amostras em três principais grupos: (a) sadios, ardido claro e imaturo, (b) ardido escuro e (c) preto. Nas três técnicas a variância entre as amostras levou à discriminação de cafés prioritariamente por suas classes, independentemente das suas condições de torração. Os modelos de classificação para os espectros obtidos por DRIFTS foram desenvolvidos por LDA enquanto que os modelos para ATR-FTIR e NIR foram desenvolvidos por rede Elástica. Porcentagens altas de amostras corretamente classificadas (até 100%) foram obtidas nos três modelos desenvolvidos. As variáveis discriminantes que contribuíram para a correta classificação de amostras nos modelos desenvolvidos por rede Elástica, para os dados de ATR-FTIR e NIR, foram extraídas e proporcionaram a seguinte interpretação dos modelos: (a) café sadio foi diretamente relacionado a altos teores de carboidratos e lipídios e baixos teores de proteína e/ou aminoácidos e cafeína; (b) café ardido claro foi relacionado a altos teores de carboidratos e cafeína; (c) café ardido escuro foi diretamente relacionado a altos teores de ácidos alifáticos e baixos teores de lipídios; (d) café preto foi relacionado a níveis altos proteínas e/ou aminoácidos e baixos níveis de lipídios; e (e) café imaturo foi relacionado a altos níveis de proteínas e/ou aminoácidos e cafeína e baixo conteúdo de lipídios. Misturas de grãos sadios e defeituosos, com %defeitos variando de 0% a 30% em passos de 3%, foram produzidas e analisadas por ATR-FTIR e NIR para um estudo quantitativo. PLSR foi utilizada para o desenvolvimento dos modelos quantitativos que proporcionaram resultados satisfatórios. Valores de RMSEP baixos como 2,6% e valores de R2 altos como 0.956 no conjunto de validação foram obtidos. De um modo geral, os modelos desenvolvidos com espectros obtidos por NIR apresentaram-se mais robustos e acurados em relação aos modelos de ATR-FTIR.
ABSTRACT
A major parameter directly related to coffee quality is the presence of defective beans, which impart negative sensory aspects to the beverage. The defects that contribute the most to the depreciation of the beverage quality are black, sour and immature beans. The conventional method used to assess the quality of roasted coffees is based on sensory evaluation, which, although reliable, is time-consuming and requires trained cupper experts. In view of the aforementioned, the objective of the present study was to evaluate the potential of FTIR and NIR spectroscopy as practical techniques to assess the quality of coffees based on the presence of defective beans. Coffee beans were manually sorted into five classes: black, dark sour, immature, light sour and non-defective. Each of the coffee classes was roasted at three temperatures (220 °C, 235 °C and 250 °C) and to three roasting degrees (light, medium and dark) obtaining nine roasting conditions. Roasted coffee samples were ground, sieved and analyzed by DRIFTS, ATR-FTIR and NIR for a classification study. Results from PCA indicated that based on DRIFTS spectra, coffee samples could be discriminated into four major groups: (a) non-defective, (b) black, (c) dark sour and (d) light sour, with immature beans scattered among the sour samples. ATR-FTIR provided the discrimination of the coffee samples, although not clearly, into two groups: (a) non-defective and light sour and (b) black, dark sour and immature, and NIR provided the discrimination into three major groups: (a) non-defective, light sour and immature, (b) dark sour, and (c) black. At all cases the variance among the samples led to the discrimination of the coffees primarily by their classes, regardless of roasting degree. Classification models for DRIFTS spectra were developed by LDA while classification models for ATR-FTIR and NIR were developed by Elastic net. High percentages of correct classification, up to 100%, were achieved with each of the techniques employed. The discriminating variables that contributed to the correct classification of the samples from the Elastic net models, for ATR-FTIR and NIR data, were extracted and provided the following interpretation of the models: (a) non-defective coffee was directly related to high levels of carbohydrates and lipids and lower levels of proteins and/or amino acids and caffeine; (b) light sour coffee was related to high levels of carbohydrates and caffeine; (c) dark sour coffee was directly associated with high levels of aliphatic acids and low levels of lipids; (d) black coffee was related to high levels of proteins and/or amino acids and low levels of lipids; and (e) immature coffee was related to high levels of proteins and/or amino acids and caffeine and low levels of lipids. In a second part of this study, blends of defective in admixture with non-defective coffee, with %defects ranging from 0% to 30% in steps of 3%, were produced and analyzed by ATR-FTIR and NIR for a quantification assay. PLSR was used to construct the models that provided satisfactory results. RMSEP values as low as 2.6% and R2 values as high as 0.956 in the validation set were achieved. Overall, NIR overcame ATR-FTIR in terms of robustness and accuracy.
LIST OF FIGURES
Figure 1. Flow chart of raw bean processing. ... 7 Figure 2. Schematic layout of an electronic sorting machine ... 10 Figure 3. Stereo microscope section of a bean: (a) green; (b) toasted to 70 °C; (c)
roasted ... 16
Figure 4. Regions of the electromagnetic spectrum and processes that may occur in
an atom or molecule exposed to the radiation. ... 27
Figure 5. Energy level diagram showing the states involved in infrared absorption. ... 28 Figure 6. Energy balance of incident light upon interaction with a sample ... 29 Figure 7. Attenuated total reflectance Fourier transform infrared ... 31 Figure 8. Conventional multivariate statistic techniques used for modeling spectral
data. ... 36
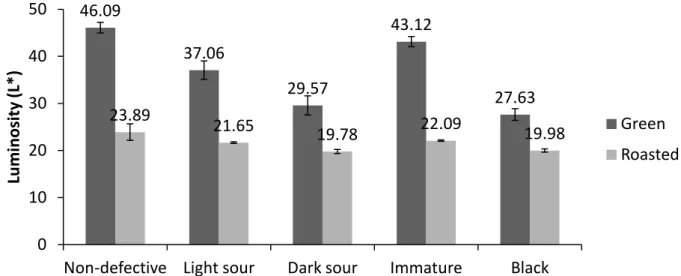
Figure 9. Manually sorted defective and non-defective coffee beans ... 49 Figure 10. Average L* values of defective and non-defective whole coffee beans
before and after a medium roasting ... 50
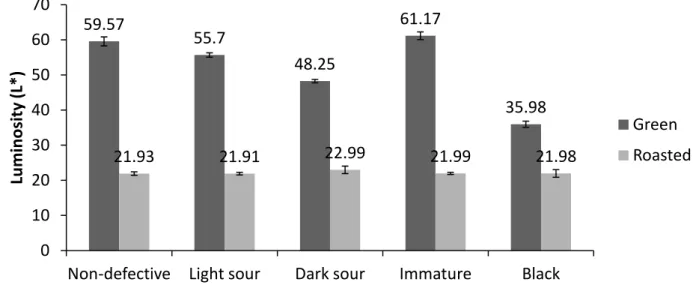
Figure 11. Average luminosity L* values of defective and non-defective coffees before
and after a medium roasting ... 51
Figure 12. Mean average spectra obtained by ATR-FTIR for defective and
non-defective roasted coffees ... 55
Figure 13. PCA scores scatter plots of ATR-FTIR spectra (a) original; (b) after
baseline correction and area normalization; and (c) after 1st derivative Savitzky-Golay ... 57
Figure 14. Mean average spectra obtained by ATR-FTIR for defective and
non-defective roasted coffees. ... 63
Figure 15. Plot of Q residuals vs. Hotelling’s T2 statistic for outlier removal in the
ATR-FTIR datasets ... 65
Figure 16. PCA scores scatter plots of ATR-FTIR spectra... 67 Figure 17. Elastic net coefficient estimates at α = 0.75 for ATR-FTIR ... 71 Figure 18. Mean average spectra obtained by NIR for defective and non-defective
roasted coffees. ... 79
Figure 19. Plot of Q residuals vs. Hotelling’s T2 statistic for outlier removal in the NIR
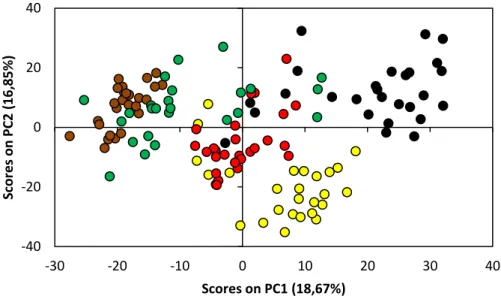
Figure 20. PCA scores scatter plots of NIR spectra ... 83 Figure 21. Elastic net coefficient estimates at α = 0.75 for NIR ... 86 Figure 22. Actual x predicted percentage of defective coffee in admixture with
non-defective coffee from PLSR models developed with ATR-FTIR spectral data ... 96
Figure 23. Actual x predicted percentage of defective coffee in admixture with
LIST OF TABLES
Table 1. Parameters used in commercial classification ... 11
Table 2. Summary description of the type classification system ... 12
Table 3. Equivalence ratings according to the type classification system ... 13
Table 4. Cup quality classification ... 13
Table 5. Approximate percentage of dry mass loss for different roasting degrees ... 15
Table 6. Macroscopic changes during roasting ... 15
Table 7. Summary of composition data (%dry weight) for green and roasted arabica and robusta coffee beans ... 17
Table 8. Main defects visually identified among coffee beans, their origin and their effect in the brew flavor and/or roasting process ... 19
Table 9. Roasting results based on color measurement and percentage of weight loss ... 52
Table 10. Calculated values of the first three discriminant functions at each sample group centroid ... 59
Table 11. Correct classification rates (%) for the LDA models ... 60
Table 12. Model equations and correct classification rates (%) based on generic discrimination between defective and non-defective coffees ... 61
Table 13. Percentage of correct classification obtained by Elastic net models based on ATR-FTIR spectra ... 69
Table 14. Tentative chemical assignment of significant ATR-FTIR bands selected by Elastic net (α = 0.75) for the classification of defective and non-defective coffees ... 76
Table 15. Percentage of correct classification obtained by Elastic net models based on NIR spectra ... 85
Table 16. Chemical compounds assigned in ATR-FTIR and NIR variable selection ... 91
Table 17. Tentative chemical assignment of significant NIR bands selected by Elastic net (α = 0.75) for the classification of defective and non-defective coffees ... 92
Table 18. Outliers detected and removed from the PLSR models developed from ATR-FTIR and NIR spectra ... 95
Table 20. Results from the PLSR models developed from ATR-FTIR and NIR spectra
for predicting the percentage of light sour coffee in admixture with non-defective coffee ... 99
Table 21. Results from the PLSR models developed from ATR-FTIR and NIR spectra
for predicting the percentage of dark sour coffee in admixture with non-defective coffee ... 100
Table 22. Results from the PLSR models developed from ATR-FTIR and NIR spectra
for predicting the percentage of black coffee in admixture with non-defective coffee 100
Table 23. Results from the PLSR models developed from ATR-FTIR and NIR spectra
LIST OF ABBREVIATIONS
*L Luminosity
ATR Attenuated total reflectance
DRIFTS Diffuse reflectance Fourier transform spectroscopy FTIR Fourier transform infrared
FT-NIR Fourier transform near infrared
HPLC High-performance liquid chromatography
IR Infrared
LASSO Least absolute shrinkage and selection operator LDA Linear discriminant analysis
MIR Mid-infrared
MSC Multiplicative scatter correction
NIR Near-infrared
PC Principal component
PCA Principal component analysis PLSR Partial least squares regression
RMSEC Root mean square errors of calibration RMSECV Root mean square errors of cross validation RMSEP Root mean square errors of prediction
TABLE OF CONTENTS
ACKNOWLEDGMENT ... v
RESUMO ... vii
ABSTRACT ... viii
LIST OF FIGURES ... ix
LIST OF TABLES ... xi
LIST OF ABBREVIATIONS ... xiii
1. INTRODUCTION ... 1
2. LITERATURE REVIEW ... 5
2.1. Coffee: From fruits to roasted coffee ... 5
2.1.1. Green coffee processing ... 6
2.1.2. Raw bean classification ... 11
2.1.3. Roasting and grinding ... 14
2.1.4. Quality assurance of the roasted coffee ... 18
2.2. Coffee: Defective beans ... 19
2.2.1. Physical attributes ... 20
2.2.2. Chemical attributes ... 22
2.2.3. Sensory attributes ... 26
2.3. FTIR and NIR spectroscopy ... 27
2.3.1. Basic concepts ... 27
2.3.2. Applications in coffee analysis ... 31
2.4. Spectra preprocessing ... 33
2.5. Multivariate statistics applied to spectral data ... 35
2.5.1. Principal Components Analysis ... 36
2.5.2. Linear Discriminant Analyisis ... 37
2.5.4. Sparse learning dimensionally reduction algorithms ... 39
3. MATERIAL AND METHODS ... 42
3.1. Material ... 42
3.2. Methods ... 44
3.2.1. DRIFTS measurements and spectral collection ... 44
3.2.2. ATR-FTIR measurements and spectral collection ... 44
3.2.3. NIR measurements and spectral collection ... 45
3.2.4. Data analysis ... 45
4. RESULTS AND DISCUSSION ... 49
4.1. Sample preparation ... 49
4.2. DRIFTS ... 53
4.2.1. Observations on DRIFTS spectra ... 53
4.2.2. Exploratory and classification analyses ... 56
4.3. ATR-FTIR ... 62
4.3.1. Observations on ATR-FTIR spectra ... 62
4.3.2. Outlier removal and exploratory analysis ... 65
4.3.3. Classification and variable selection by Elastic net: chemical assignments of selected ATR-FTIR absorption bands ... 68
4.4. NIR ... 78
4.4.1. Observations on NIR spectra ... 78
4.4.2. Outliers removal and exploratory analysis ... 80
4.4.3. Classification and variable selection by Elastic net: chemical assignments of selected NIR absorption bands ... 84
4.5. Quantitative analysis of defective and non-defective coffees: A comparative evaluation between ATR-FTIR and NIR ... 94
5. CONCLUSION ... 102
6. FUTURE WORK ... 104
1. INTRODUCTION
The term ‘quality’ is officially defined by the International Organization for Standardization (ISO) as “the extent to which a group of intrinsic features (physical, sensorial, behavioral, temporal, ergonomic, functional, etc.) satisfies the requirements, where requirement means need or expectation which may be explicit, generally implicit or binding” (ISO, 2000). Thus, product quality can assume different meanings for consumers, producers and regulating organizations. In the case of coffee, quality may result from factors like the production system, the aspect and chemical composition of the green or roasted beans, and to the final beverage characteristics (RIBEIRO et al., 2011).
The quality of the raw bean is determinant in the coffee commercialization process and price quotations, and can be assessed by many physical and sensory parameters. Although time-consuming and dependent on trained cupper experts (FERIA-MORALES, 2002; PETRACCO et al., 2005), the sensory analysis or ‘cupping’ is an important and reliable method for this purpose. Each producing country weighs sensory characteristics in a different way, and this parameter must be considered as specific to each commercial origin (BEE et al., 2005). In Brazil, for example, coffees are classified based on their cup quality in seven categories: strictly soft, soft, softish, hard, rioysh, rio and rio zona (BRASIL, 2010). On the other hand, Kenya, Colombia and Central American countries have their own cup quality classification (BEE et al., 2005). It is important to mention that the sensory parameters of the raw coffee are ideally evaluated when roasting and grinding are conducted under controlled conditions. The Specialty Coffee Association of America, that maintains standards for the classification of specialty coffees in an international level, recommends that, to most accurately assess the quality of coffees, the beans must be roasted to a light to light-medium degree of roast, thus the cupper can clearly perceive the flavors and fragrances of the coffee. In addition, the samples should be ground immediately prior to cupping, no more than 15 minutes before infusion with water (SCAA, 2009).
unpleasant flavors and/or aromas. Besides the exposed drawback, in general, consumer demands related to food quality have resulted in an enormous increase in food standards, moving to zero-defects (TRIENEKENS and ZUURBIER, 2008). As a result, future technologies for the assessment of food quality will require sensitivity, miniaturization of instrumentation for portable use and simple sample preparation steps (CHO and KANG, 2011), contrary to the current sensory-based method used to assess the quality of coffees. Thus, there is a need to develop fast and reliable methods to assess the quality of roasted coffees.
A good example of such rapid, non-destructive and accurate fingerprinting techniques is infrared spectroscopy (PETRACCO et al., 2005, RODRIGUEZ-SAONA and ALLENDORF, 2011). In particular, much attention has been given to Fourier transform infrared (FTIR) spectroscopy, which detects fundamental molecular vibrations as a result of molecular absorption of mid-infrared radiation, and NIR spectroscopy, which measures broad overtone and combination bands of fundamental molecular vibrations (LARKIN, 2011). Many studies have shown that these techniques in association with multivariate statistics can be successfully applied to the analysis of crude, roasted and ground coffee and the coffee beverage. FTIR has been applied to the discrimination of arabica and robusta varieties (KEMSLEY et al., 1995), detection of adulterants (BRIANDET et al., 1996, REIS et al., 2013), discrimination between decaffeinated and regular coffees (RIBEIRO et al., 2010), evaluation of roasting degree (LYMAN et al., 2003, WANG and LIM, 2012, WANG et al., 2011) and geographical authentication (WANG et al., 2009). NIR spectroscopy has been applied to the discrimination and quantification of arabica and robusta blends (ESTE AN-D E et al., 2004a, PIZARRO et al., 2007a, DOWNEY et al., 1997, DOWNEY and BOUSSION, 1996), quantification of caffeine, theobromine and theophylline (HUCK et al., 2005), evaluation of roasting degree (ALESSANDRINI et al., 2008) and prediction of sensory properties (ESTEBAN-DIEZ et al., 2004b, RIBEIRO et al., 2011).
flavor; sour beans, related to sour, acetic, and oniony tastes; and immature beans, that impart astringency and bitterness to the beverage (BEE et al., 2005, CLARKE, 1987b). The negative impact of such beans has led the scientific community to devote much effort to the characterization of defects from a chemical, physical and morphological point of view (BEE et al., 2005, VASCONCELOS et al., 2007, OLIVEIRA et al., 2006, FRANCA et al., 2005b, FRANCA et al., 2005a, RAMALAKSHMI et al., 2007).
Recently, CRAIG et al. (2011, 2012b) applied FTIR, using different measurement techniques, for the classification of defective and non-defective crude coffees. These measurement techniques included attenuated total reflectance (ATR), diffuse reflectance Fourier transform spectroscopy (DRIFTS) and transmittance measurements using KBr discs. In sequence, SANTOS et al. (2012) applied NIR to quantify defective and non-defective crude beans, from arabica and robusta coffees, and from different geographical origins. When it turns to roasted coffee, MANCHA AGRESTI et al. (2008) observed that, based on their volatile profiles, immature and black coffee could be discriminated from non-defective and sour coffee beans, while MENDONÇA et al. (2009a) did not find statistical difference among the electrospray ionization-mass spectra of defective and non-defective arabica coffees.
In view of the aforementioned, the objective of the present study was to evaluate the potential of FTIR and NIR spectroscopy for the classification and quantification of defective (black, immature, light and dark sour) and non-defective roasted coffee blends. The specific objectives that characterize the main steps of this study are:
to evaluate the feasibility of employing DRIFTS for the discrimination between defective and non-defective roasted and ground coffees;
to evaluate the feasibility of employing ATR-FTIR for the discrimination and quantification of defective and non-defective roasted and ground coffees;
to evaluate the feasibility of employing NIR for the discrimination and quantification between defective and non-defective roasted and ground coffees;
2. LITERATURE REVIEW
2.1. Coffee: From fruits to roasted coffee
The coffee plant is an evergreen shrub or small tree from the Rubinaceae
family with different species. The most economically important species are Coffea arabica L. (arabica coffee), that may become 4-6 m tall, and Coffea canephora Pierre
ex Froehn (robusta coffee), that may grow 8-12 m. In cultivation both species are pruned to manageable heights of less than 2 m and less than 3 m in mechanically harvested plantations in Brazil (SIVETZ, 1979, ANZUETO et al., 2005). Although all species within the genus Coffea are of tropical African origin (BRIDSON and VERDCOURT, 1988), coffee cultivation is now widespread in tropical and subtropical regions, with the bulk of arabica coffee concentrated in Latin America and robusta coffee predominant in South-East Asia and Africa (ANZUETO et al., 2005).
Brazil is the leading coffee producer, with 36% of the world coffee production and 30% of the global exportations. In 2012, were produced and exported 50.5 and 33.5 million bags (60 kg), respectively (ABIC, 2013). The arabica coffee is the oldest known specie and is cultivated in mountainous regions at optimal altitudes from 1000 to 2000 m and optimal temperature from 15 to 24 °C. It is more susceptible to diseases, pests and frosts. The arabica specie produces those coffees most appreciated by discerning coffee drinkers (BANKS et al., 1999, CLARKE and MACRAE, 1985), and represents 60.3% of the world coffee supply (ICO, 2013).
Robusta coffee, on the other hand, grows at relatively low altitudes; tolerates higher temperatures and heavier rainfall, and demands higher soil humus content than arabica. Usually robusta is processed via dry processing and is mostly used to constitute coffee blends, soluble and instant coffees (BANKS et al., 1999). The demand for robusta has been especially high in recent years, since it provides a less costly alternative to Arabica. Nowadays this specie represents approximately 39.7% of the coffee produced worldwide, and Vietnam is the leading producer (ICO, 2013).
plano-convex in shape, grooved on the flat side, and consist mostly of endosperm with a small embryo at the base of the seed. Those seeds are enveloped in a silverskin and and a fibrous endocarp (parchment). Robusta beans are usually smaller, rounder and present a tighter centre cut than those of arabica (ANZUETO et al., 2005).
2.1.1. Green coffee processing
Harvesting of the coffee fruit should only start after a careful examination of the level of maturation, when most of the fruits are ripe, with a minimum presence of unripe fruits. It can be accomplished in different ways: by stripping onto the ground (not recommended), or onto sheets, by selective hand picking or by mechanical means. It is widely believed that quality coffee can only be obtained if selective hand picking is used, in order to guarantee that only ripe coffee fruits will be harvested. This is certainly valid for small plantations, but becomes a long-standing myth on modern medium-sized to large estates. Top-quality coffee can be produced regardless of the harvesting technique. When unwanted fruits are picked, which is unavoidable, quality must be maintained by post-harvest separation techniques, so that high quality coffee may still be produced from the remaining ripe fruits (BEE et al., 2005).
Figure 1. Flow chart of raw bean processing. Adapted from BORÉM (2008)
The dry process is practiced where the climate is considerably warm and dry following harvest and where the copious quantities of water required for the wet process may not be available. Most of robusta coffees and most of the Brazilian crop are handled this way (CLARKE and MACRAE, 1985). In this process, the whole fruits are dried on large patios under the sun and/or in mechanical driers. Because of the long time required to dry the beans (from 2 to 4 weeks), the cost of labour and the chance for proliferation of different microorganisms on the fruit skin, artificial drying has also been used instead of or in addition to natural drying (VINCENT, 1987).
conducted in three ways. The traditional wet process consists in the removal of the pulp by a pulper, followed by the removal of the mucilage from the parchment by biological fermentation. The pulped natural process produces beans known in Brazil as cereja descascado. In this process, the husk and part of the mucilage are
mechanically removed by a pulper, and the beans in parchment are dried in patios or artificial dryers. Fermentation for the removal of mucilage is not used, thus, this process consumes less water and energy than wet process. The quality of pulped coffee, when well processed, has been shown to be excellent, with the advantage of producing coffee with greater body than the wet processed coffee (BEE et al., 2005, BORÉM, 2008). In a study comparing different processing techniques, it was found that pulped natural coffee beans presented more positive attributes of quality, less defects and lower microbial count (SANTOS et al., 2009). The third processing consists in removing the husk and the mucilage mechanically, resulting in the demucilaged coffee (BORÉM, 2008).
The operations carried out subsequently to dry, wet or pulped natural processing aim to prepare the green beans for consumption and exportation. An artificial re-drying step is performed to ensure that the moisture level of the beans is lower than 11%. This is especially important to provide stability during storage and to enable husk and parchment to be removed more easily. The cleaning step is performed to remove impurities, such as metal pieces and foreign bodies. It can be carried out by the use of a hopper with screens to remove large and medium-sized impurities, followed by a magnetic separator to remove metal pieces, and cleaner-separator which combines sifting and pneumatic dust removal (VINCENT, 1987).
Figure 2. Schematic layout of an electronic sorting machine (Source:
http://www.buhlergroup.com)
2.1.2. Raw bean classification
The classification of the coffee beans, which includes physical and sensorial analysis, is a crucial phase in the commercialization process, influencing in price quotations as well as national regulations governing importation into consuming countries. Unfortunately, the existence of a variety of classification systems means that each country adopts a different classification, requiring equivalency norms for use at international level. Overall, the classification is based on the evaluation of all parameters related to coffee bean described in Table 1 (BEE et al., 2005).
Table 1. Parameters used in commercial classification
Parameter Description
Designation Species: C. arabica/ C. robusta
Processing: natural (dry), pulped natural and washed (wet)
Geographical origin Crop year
Classification by bean size Size and shape of the beans Classification by type (number of
defects)
Defective beans and foreign matter
Density Specific mass of the beans
Humidity Moisture content
Color and appearance Coloration and uniformity of the beans
Roast Roast regularity, smell, etc
Cup quality Characteristic aroma and flavors
Adapted from BEE et al. (2005) and CLARKE et al. (1987b)
recognized by the bean color and appearance of the silverskin. Washed coffee is translucent, shiny and green-bluish. A green-bluish color in washed coffee indicates freshness and high quality, while a yellowish color is a sign of old and low quality coffee. Natural coffee has a semi-opaque color and a yellowish or even brown skin. Pulped natural coffee has an intermediate aspect. (e) Observing the uniformity of a roasted coffee sample helps to identify defects that were not observed previously (BEE et al., 2005).
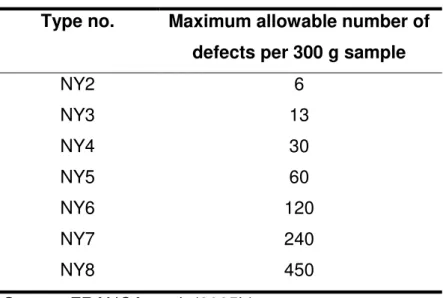
With regard to the classification by type, most producing countries adopt their own classification system to describe the presence of defective beans, which will be explored in details in section 2.2. At the international level the ‘New York Coffee and Sugar Exchange’ introduced the concept of the black bean equivalent according to which all defects are accounted for in terms of equivalence to black beans, as indicated in Tables 2 and 3 (BEE et al., 2005, FRANCA et al., 2005b). These defects are visually identified and manually sorted in a 300 g sample by a professional trained for green coffee classification.
Table 2. Summary description of the type classification system
Type no. Maximum allowable number of
defects per 300 g sample
NY2 6
NY3 13
NY4 30
NY5 60
NY6 120
NY7 240
NY8 450
Table 3. Equivalence ratings according to the type classification system
Defect type and quantity Equivalency (defects)
1 black bean 1
2 sour beans 1
5 immature beans 1
2/5 insect damaged beans 1
1 small stone 1
1 large stone 5
1 small twig 1
1 large twig 5
Source: FRANCA et al. (2005b)
In terms of cup quality, each producing country weighs organoleptic defects in a different way, which may lead to discrepancies in sensorial evaluation between producing and consuming countries. Brazilian coffees, as an example, are classified into cup quality according to the ranking shown in Table 4. Rioysh, rio and rio zona beans are considered defects associated with irregular beans in cup taste or with off-taste. These beans present normal appearance but medicinal and phenolic flavor of
iodine. These defects are caused by overripe fruits contaminated by microorganisms on branch, or dried under contact with patio soil contaminated by microorganisms and/or trichloroanisole (BEE et al., 2005).
Table 4. Cup quality classification
Cup quality Description
Strictly soft The same as soft, but more accentuated Soft Pleasant, mild and sweetish flavor and taste
Softish Mildly sweetish and soft taste, without harshness or astringency Hard Sour, astringent and harsh taste, but without strange taste Rioysh Mild flavor of iodoform
Rio Typical and accentuated flavor of iodoform
Besides the aforementioned classifications, coffee certification has gained importance in the international commercialization of the raw beans. Studies have shown that the demand for certified and verified coffee will continue to grow strongly in the foreseeable future (ZAMBOLIM, 2007; ICO, 2013). These certifications may assure not only the quality of the bean, but it may also assure that a coffee was produced under good agricultural practices and management, safe and healthy working conditions, no child labor and protection of the environment. Some examples of certifications applied to coffees are Fairtrade, UTZ Kapeh and EureGAP (ZAMBOLIM, 2007).
2.1.3. Roasting and grinding
Coffee roasting consists of applying considerable heat to the beans, which must be kept in motion to ensure an uniform roast, until their color reaches the desired shade of brown and their aroma is fully developed. At this stage the coffee must be rapidly cooled by air current with or without the aid of water spray or “quench” (BONNLANDER et al., 2005, CLARKE and MACRAE, 1985). The principles of roasting vary from a mechanical, with a wide variety of rotating drums, a thermal, including contact, radiation and convective radiation heat transfer, and an operational point of view (BONNLANDER et al., 2005). Conventional and newer developments on roasting techniques were described by CLARKE (1987b) and CLARKE and VITZTHUM (2008).
Table 5. Approximate percentage of dry mass loss for different roasting degrees
Degree of roast Dry mass loss (%)
Light 1-5
Medium 5-8
Dark 8-12
Very dark >12
Source: CLARKE (1987a)
The main transformations occurring in the bean with increasing temperature from a macroscopic standpoint are given in Table 6. The color changes and the formation of micro fissures in the bean can be observed in Figure 3.
Table 6. Macroscopic changes during roasting Temperature
within
the bean (°C) Effect
20-130 Liquid-vapour transition of water. Color fades
130-140 First endothermic maximum. Yellow coloring and swelling with beginning of non-enzymatic browning. Roast gases are formed and start to evaporate
140-160 Complex series of endothermic and exotermic peaks. Color changes to light brown. Large increase in bean volume and micropores. Rests of silverskin are removed. Little fissures at the surface occur. Aroma formation starts
160-190 Roasting reactions move towards the inner dry structure of the bean 190-220 Micro fissures inside the beans. Smoke escapes. Large volumes of
carbon dioxide escape and leave the bean porous. Typical flavor of roasted coffee appears.
Figure 3. Stereo microscope section of a bean: (a) green; (b) toasted to 70 °C; (c)
roasted, showing the porous structure. Source: BONNLANDER et al. (2005)
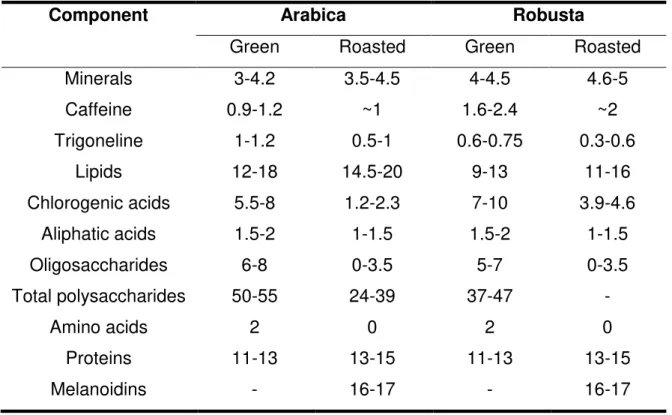
Following the above mentioned reactions, numerous chemical changes also occur in the bean during roasting. Among them, sucrose is partly dehydrated and hydrolized to reducing sugars, giving rise to many volatile and non-volatile compounds, water and carbon dioxide, and the rest being pyrolysed (caramelized). The Mailllard reaction, which generates melanoidins, has a low activation energy and is favored in the presence of reactive nitrogen compounds. Polysaccharides, except the highly insoluble cellulose, are partly solubilized generating anhydrides and polymers, such as melanoidins. The lipid fraction remains almost the same during roasting, with a slightly increase in the levels of trans fatty acids, and a decrease in the
levels of linoleic acids, cafestol, and tocopherols. Regarding nitrogen compounds, caffeine remains stable, 50% of the trigonelline is decomposed to nicotinic acids and other compounds, free amino acids are pyrolysed or react to form Maillard products, and proteins are denatured. The mineral content does not change. Most of the chlorogenic acids content is hydrolysed, isomerated and, to a smaller extent, lactonized. The compounds formed are melanoidins, free quinic acid, quinides, phenols and volatile compounds. Finally, carboxylic acids are formed during the first stages of roasting due to carbohydrate hydrolysis, but are degraded after a longer exposition to heat. Thus, light roasted coffees contain higher quantities of carboxylic acids than dark roasted (SIVETZ, 1979, LYMAN et al., 2003, BONNLANDER et al., 2005, CLARKE and MACRAE, 1985).
Table 7. Summary of composition data (%dry weight) for green and roasted arabica
and robusta coffee beans
Component Arabica Robusta
Green Roasted Green Roasted
Minerals 3-4.2 3.5-4.5 4-4.5 4.6-5
Caffeine 0.9-1.2 ~1 1.6-2.4 ~2
Trigoneline 1-1.2 0.5-1 0.6-0.75 0.3-0.6
Lipids 12-18 14.5-20 9-13 11-16
Chlorogenic acids 5.5-8 1.2-2.3 7-10 3.9-4.6
Aliphatic acids 1.5-2 1-1.5 1.5-2 1-1.5
Oligosaccharides 6-8 0-3.5 5-7 0-3.5
Total polysaccharides 50-55 24-39 37-47 -
Amino acids 2 0 2 0
Proteins 11-13 13-15 11-13 13-15
Melanoidins - 16-17 - 16-17
Source: CLARKE and MACRAE (1985)
2.1.4. Quality assurance of the roasted coffee
As discussed so far, many physical and sensory parameters are used to classify the raw bean, and such classification is determinant in the coffee commercialization process and price quotations. On the other hand, there is a lack of methodologies to assess the quality of roasted coffees from the market.
At the international level, ISO has standards for the determination of bulk density of the whole beans (ISO, 2011a) and caffeine content (ISO 2009, ISO 2011b). But in terms of quality, each country adopts its own system. In Brazil, for example, roasted coffees from the market are officially inspected by means of moisture content, which should not be higher than 5%, and by means of the presence of impurities, fruit parts (e.g. hulls, husks) and foreign matter, that should not exceed 1%. Individually, the presence of foreign matter should not exceed 0.1% (BRASIL, 2010). The current method used to identify the presence of those impurities and foreign matter is, however, based on the microscope analysis of coffee samples. Since the method relies on the visual examination of small amounts of sample, it is subject to lack of reproducibility. Microbiologic and mycotoxin analyses may also be conducted. In addition, the cup test was initially proposed to evaluate the global quality of the beverage. The sensory characteristics to be evaluated would be the fragrance, aroma, acidity, bitterness, astringency, taste, residual taste, influence of defective beans, body and beverage category, which is divided in strictly soft, soft, softish, hard, rioysh, rio and rio zona. A coffee with global score lower than 4 would be disqualified and forbidden to be sold (BRASIL, 2010). This regulation was later revoked and the sensory analysis is currently not being applied for the inspection of coffees from the market (BRASIL, 2013).
calibrate instrumental screening methodologies (FERIA-MORALES, 2002, PETRACCO et al., 2005). A good example of such a rapid, non-destructive fingerprinting technique is near-infrared spectroscopy that, in previous studies, has accomplished the prediction of sensory parameters in roasted coffee (PETRACCO et al., 2005, RIBEIRO et al., 2011, ESTEBAN-DIEZ et al., 2004b).
2.2. Coffee: Defective beans
The type and number of defective beans influence significantly the quality of the coffee beverage. Table 8 shows a summary of the main defects visually identified, their origin and their effect on the brew flavor and/or roasting process. It is important to note that other defects not listed in the Table may also occur.
Table 8. Main defects visually identified among coffee beans, their origin and their
effect in the brew flavor and/or roasting process
Group Defect Brew flavor/roasting Origin
Foreign matter Stones, sticks, clod Effect mainly economic H/P Fruit parts Bean parchment, dried
cherry, husk fragment
Non-specific downgrading, lack of flavor
P
Irregularity/integrity of bean shape
Shell, bean fragment, broken bean, insect damaged bean, etc.
Uneven roast, bitterness, less acidity
F/P
Irregular in color and surface texture
Black, black-green, sour, immature, mouldy bean, etc.
Slow roast, harshy/strange flavors, less acidity,
astringency, metallic flavor
F/H/P/S
F, Field damaged beans: genetic problems, environmental conditions and attacks by pests and diseases.
H, Harvested-damaged beans: inadequate crop management
P, Process-damaged beans: imperfect processing operations (pulping, washing, drying, cleaning, hulling, etc.)
S, Storage damaged beans: deficient storage
Adapted from BEE et al. (2005) and MIYA et al. (1973)
beans within the cherry on the tree, over-ripe cherry fallen on the ground or attacked by fungi and other pests. Sour beans are associated with ‘overfermentation’ during the wet process or with beans that have been in adverse conditions, becoming fermented by bacteria or xenophilic moulds, with the embryo dead. Immature beans derive from unripe coffee beans. Black-green beans occur due to the fermentation of unripe coffee beans (BEE et al., 2005, CLARKE, 1987b).
Only a few studies have attempted to discriminate defective and non-defective beans. Prior to roasting, these beans can be discriminated by several physical and chemical parameters (MENDONCA et al., 2009b, VASCONCELOS et al., 2007, FRANCA et al., 2005b, SANTOS et al., 2012). After roasting, solid phase micro extraction gas chromatography-mass spectrometry (SPME-CG-MS) has shown success in achieving this purpose. TOCI and FARAH (2008) reported volatile compounds that could be used as potential defective coffee markers. MANCHA AGRESTI et al. (2008) showed that roasted defective and non-defective coffees could be separated into two distinct groups based on their volatile profiles: immature/black beans and non-defective/sour coffees. In spite of the positive results reported in the previously mentioned studies, the drawbacks of the technique employed must be considered. First, the volatile composition of coffee beans may vary according to many parameters such as soil composition, climate, agricultural practices, and most importantly, roasting conditions, making the achievement of reproducible results arduous. In addition, the SPME-CG-MS technique is costly, time consuming, and not suitable for routine analysis. Sequentially, MENDONÇA et al. (2009a) employed electrospray-ionization mass spectrometry for the same purpose, but no discrimination among defective and non-defective coffees was observed after roasting.
2.2.1. Physical attributes
non-defective beans by size is efficient among arabica coffee beans. For robusta coffee only sour and black beans can be discriminated (MENDONÇA et al., 2009b). A comparison between the densities of green defective and non-defective beans have shown that there is no significant difference between them except for robusta black beans, which have a lower density than the others. During roasting, there is an increase in the volume and lost in the mass, which results in a decrease in the density of the bean. Because arabica black beans are smaller, their volume increases less than others resulting in higher density after roasting (MENDONÇA et al., 2009b, FRANCA et al., 2005b, FRANCA et al., 2005a). However, MENDONÇA et al. (2009bb) did not find a significant difference among robusta black beans.
Green beans contain 10-13% of moisture content, but no significant difference was found among the moisture content levels of non-defective and defective beans (CLARKE and MACRAE, 1985, RAMALAKSHMI et al., 2007). During roasting under the same conditions, the moisture loss is lower among defective than among non-defective beans, indicating that non-defective beans roast at a lower level (VASCONCELOS et al., 2007). This observation is explained by the fact that defective beans contain less sucrose than non-defective ones.
2.2.2. Chemical attributes
In actual amounts, sucrose is the major free sugar present in green coffee, varying with species, variety, stage of maturity, processing and storage conditions (CLARKE and MACRAE, 1985). The presence of immature and fermented beans is directly related to the sucrose level in a given sample. Sucrose levels are expected to increase with coffee maturation and, since this is the main free sugar available, sucrose levels decrease if fermentation occurs (MAZZAFERA, 1999). Before roasting, MAZZAFERA (1999) found that immature-black and immature Brazilian beans present one-thirty and one-fifth of the sucrose level of a normal bean. This was also observed for Vietnamise robusta coffee, where black beans contained 0.9% sucrose and non-defective beans contained 4% (BEE et al., 2005). VASCONCELOS et al. (2007) and RAMALAKSHMI et al. (2007) found higher levels of sucrose in non-defective compared to defective beans. After roasting, only traces of sucrose were detected by VASCONCELOS et al. (2007) in light roasted coffee and no sucrose was detected in medium and dark roasting degrees. Polysaccharides are present in green coffee in amounts of 40-50% d.b., with mannans, galactans, cellulose and araban being the most important (CLARKE and MACRAE, 1985). Other polysaccharides such as starch or pectin are present at only low levels in mature coffee beans (BEE et al., 2005). After medium roasting, approximately 75% of the original polysaccharides remained (CLARKE and MACRAE, 1985). VASCONCELOS et al. (2007) have observed higher levels of total carbohydrates before and after roasting in non-defective than in defective coffee, but such result was determined by difference.
The green coffee lipids are composed of coffee oil substantially present in the endosperm and a small amount in the wax, located in outer layers of the beans. The oil contains triglycerides and a considerable amount of other lipid components. The lipids loss during roasting is minimal (CLARKE and MACRAE, 1985). Arabica coffee contains higher level of oil than robusta, and non-defective beans contain higher levels than defective ones (MAZZAFERA, 1999, OLIVEIRA et al., 2006, VASCONCELOS et al., 2007). Nevertheless, OLIVEIRA et al. (2006) did not find a significant difference in the fatty acid profile of both defective and non-defective coffee, before or after roasting.
made, the protein content in green coffee is close to 10% with little quantitative and qualitative differences between species (BEE et al., 2005, CLARKE and MACRAE, 1985). MAZZAFERA (1999) reported higher levels for black beans in comparison to immature and immature-black. Nevertheless, this result did not correlate with free amino acid content, which was higher for immature beans than black and immature-black coffees. COELHO et al. (2000) also observed higher levels of protein in immature-black coffee. VASCONCELOS et al. (2007) and OLIVEIRA et al. (2006) did not find a significant difference in the protein contents of defective and non-defective coffees, before or after roasting. RAMALAKSHMI et al. (2007), on the other hand, reported slightly lower protein contents for low quality coffees.
Trigonelline is a nitrogenous base with a pyridine ring that is decomposed during roasting in the order of 50-80%, giving rise to volatile compounds of sensory significance (CLARKE and MACRAE, 1985). Half of the volatile compounds generated during its thermal degradation consist of pyridines and pyrroles, both detected in roasted coffee (MANCHA AGRESTI et al., 2008). Nicotinic acid, which also exhibits a pyridine ring, is especially important from a sensory and a nutritional point of view, since it is an essential vitamin (CLARKE and MACRAE, 1985). Prior to roasting, FRANCA et al. (2005b) reported trigonelline levels of approximately 1% in non-defective, immature and sour coffee beans and lower values (~0.8%) for black beans. FRANCA et al. (2005a) did not find significant differences in trigonelline levels between defective and non-defective coffee beans. FARAH et al. (2006) reported a strong negative correlation between trigonelline levels and poor quality and Rio-off flavor. After roasting, no significant correlation between trigonelline levels and cup quality was observed. Slightly higher levels of trigonelline were observed for black/sour beans, which was associated to the fact that such beans attained lighter roasting degrees in comparison to other classes (FRANCA et al., 2005b, FRANCA et al., 2005a).
only in defective beans or low quality coffee, indicating that this amine could be a potential marker for the detection of defective beans in green coffee. After roasting, the levels of amines decreased dramatically. In light roasted coffee, only traces of serotonin were found while, in the medium and dark roasted coffees, no amines were found.
Caffeine is an alkaloid, with a methylated dioxypurine structure relatively stable to roasting. Although caffeine sublimation point is at 178 ° C, the pressure build-up within the bean and the poor rate of diffusion of vapor through its outer layers leads to low losses of caffeine during roasting unless severe roasting conditions are employed (CLARKE and MACRAE, 1985). MAZZAFERA et al. (1999) did not find significant difference in the caffeine levels of defective and non-defective coffee. Using a UV-based methodology, FARAH et al. (2006) found that the concentrations of caffeine and trigonelline were higher in high quality coffees in comparison to bad quality ones. The same observation was made by FRANCA (2005a) and RAMALAKSHMI et al. (2007). Nonetheless, FRANCA et al. (2005b) found that non-defective beans exhibited lower caffeine levels than non-defective ones.
The types of acids found in coffee are aliphatic carboxylic acids but also phosphoric acid, some alicyclic and heterocyclic acids, and chlorogenic acids that will be discussed separately. The presence of acids in the beverage contributes to sensory parameters such as acidity and astringency, and may add flavor effect through aroma and taste in the case of undissociated molecules. Aliphatic acids that may add desirable flavors to the beverage are pyruvic, methylbutyric, methylvaleric, 2-ethylbutyric and levulinic. It has been observed that coffees stored for a long time are slightly more acid than those made from corresponding new crop (WOODMAN, 1985). Studies have demonstrated that prior to roasting defective present higher acidity than non-defective beans, with highest values for sour beans. Acidity decreases after roasting without difference among defective and non-defective beans. It must be considered that such acidity may also be influenced by the presence of chlorogenic acids (VASCONCELOS et al., 2007, FRANCA et al., 2005a, RAMALAKSHMI et al., 2007).
excessive roasting may lead to the destruction of these compounds (CLARKE and MACRAE, 1985). According to WHITE (1995), the CQA content of green coffee beans can be used as an indicator of quality and maturity, in a way that the relationship diCQA/CQA is higher in immature beans in comparison to non-defective beans. FARAH et al. (2006) observed that prior to roasting the low quality immature and black-green beans had higher levels of CGA, and 5-CQA and 5-FQA had a high relationship with poor beverage quality. Light roasted and medium roasted low quality coffees were correlated with high levels of 3-CQA, CQA, 5-CQA, and 5-CQA, 4-FQA, and 5-4-FQA, respectively. 93% of the original CGA content was lost during dark roast, and no relationship between CQA and coffee quality was found. Furthermore, it was found a positive relationship between CGA content, especially 5-CQA, and color intensity of the beans. Indeed, CLARKE and MACRAE (1985) have previously reported that the greater the discoloration in the sequence green, yellow, brown to black, the lower the total CGA content and the lower the CGA:diCQA molar ratio.
There is no evidence that arabica and robusta differ significantly in their levels of mineral content, but studies suggest that dry-processed arabica and robusta coffee have slightly higher levels than wet-processed ones. This is probably due to leaching out of minerals during the fermentation and washing stages of the wet-processed coffee (BEE et al., 2005, CLARKE and MACRAE, 1985). Potassium represent 40% of the total minerals of the coffee beans (BEE et al., 2005). OLIVEIRA et al. (2006) and VASCONCELOS et al. (2007) found higher mineral content in defective than non-defective beans, with black beans exhibiting the highest amount.
followed by black and immature. Results from principal component analysis (PCA) indicated that defective and non-defective beans could be separated into two groups based on their volatile profile, one represented by immature and black beans, and other by non-defective and sour beans. These findings suggested that sour and black beans could be associated with the fermentation of non-defective and immature beans, respectively.
2.2.3. Sensory attributes
Black beans are generally regarded as giving a ‘heavy’ and ‘ashy’ flavor to the beverage. Their volatile profile is distinct from non-defective or other defective beans, being considered the worst intrinsic defect. The black-green beans are characterized by astringency and a taste reminiscent of rotten fish. Sour beans are regarded as especially important in downgrading flavor, contributing to sour, oniony and fermented taste and smell. Immature beans contribute to the astringency, due to the presence of tannins, which in low concentrations produce an acceptable gustatory sensation called ‘mouthfeel’. It also adds bitterness and metallic taste to the beverage (COELHO, 2000, CLARKE, 1987b, MANCHA AGRESTI et al., 2008).
Studies have demonstrated that the smell and taste of defective beans can be perceived even at low levels. COELHO et al. (2000) evaluated the sensory attributes of Brazilian coffees, previously classified as strictly soft, after an increasing addiction of immature, sour and black beans. Before the addition of defective beans, higher values of positive attributes, such as peanut, nuts, cereal and caramel, were observed. With the inclusion of 5 to 10% of immature beans the attribute astringency was noted. 30% of immature beans were sufficient to increase the attribute chemical, oily and fermented. The defect black was the most detrimental to the quality of the beverage, contributing to the attributes bitter and sour. The transition of the cup quality classification from strictly soft to hard occurred after the addition of 19.49%, 16.36% and 14.26% of immature, sour or black beans, respectively.
the astringency and metallic tastes of immature beans are perceivable at percentages of immature beans as low as 1%.
2.3. FTIR and NIR spectroscopy
2.3.1. Basic concepts
The electromagnetic radiation covers a wide wavelength range, from low-energy radio waves to high-energy γ-rays, as illustrated in Figure 4. When exposed to radiation, many processes may occur in an atom or molecule. A molecule may undergo rotational, vibrational, electronic or ionization processes, in order to increasing energy. A molecule may scatter light in a Raman process. Nuclear magnetic resonance and electron spin resonance processes involve transitions between nuclear spin and electron spin states, respectively. Nevertheless, an atom may only undergo an electronic transition or ionization because it has no rotational or vibrational degrees of freedom. Spectroscopy is basically an experimental subject concerned with the absorption, emission or scattering of electromagnetic radiation by atoms or molecules (HOLLAS, 2004). At each of the electromagnetic regions, different information on the radiated sample may be obtained.
Figure 4. Regions of the electromagnetic spectrum and processes that may occur in
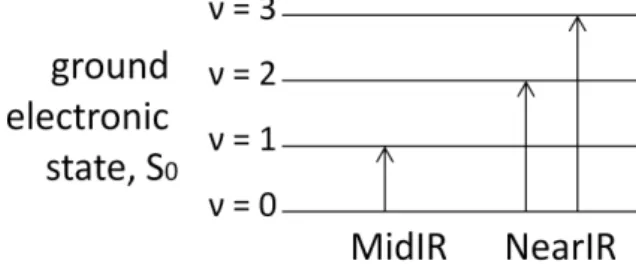
The regions of the electromagnetic spectrum where molecular vibration will take place are far-infrared, mid-infrared and near-infrared. When a sample is radiated with IR light at each of these regions different chemical bonds absorb this light at different wavelengths, depending on the atoms connected, the surrounding molecules, and the type of vibration the absorbance gives rise to (THYGESEN et al., 2003). The low energetic far-infrared is typically absorbed by heavy molecules such as inorganic and organometallic substances (SMITH, 2002), which limits the application of this radiation to food systems. The other two infrared regions of the spectrum give rise to different techniques: MIR and NIR spectroscopy. Figure 5 presents an energy level diagram showing the states involved in MIR and NIR techniques.
Figure 5. Energy level diagram showing the states involved in infrared absorption.
NIR spectroscopy measures the broad overtone and combination bands of some of the fundamental vibrations and is an excellent technique for rapid and accurate quantification analysis, overcoming MIR (LARKIN, 2011). The main disadvantage is that the superposition of many overtone and combination bands causes broad peaks and a very low structural selectivity in comparison to MIR, where many fundamental peaks can be observed in isolated positions (KAROUI and DE BAERDEMAEKER, 2007). Of all the optical spectroscopic techniques, NIR offers the greatest diversity of instrumentation principles, including FT, scanning-grating, diode array, filter, light-emitting diode and acoustic-optical tuneable filter spectrometers. This diversity of instrumentation principles as well as the development of the equipments allowed NIR to be applied in online and at-line modes in food processing facilities (SABLINSKAS, 2005). While FTIR has been prominent and attractive in industrial applications over the past decade or more, NIR spectroscopy has been adopted in the food industry and in agriculture for more than 30 years (GAUGLITZ and VO-DINH, 2006).
2.3.1.1. Measurement Techniques
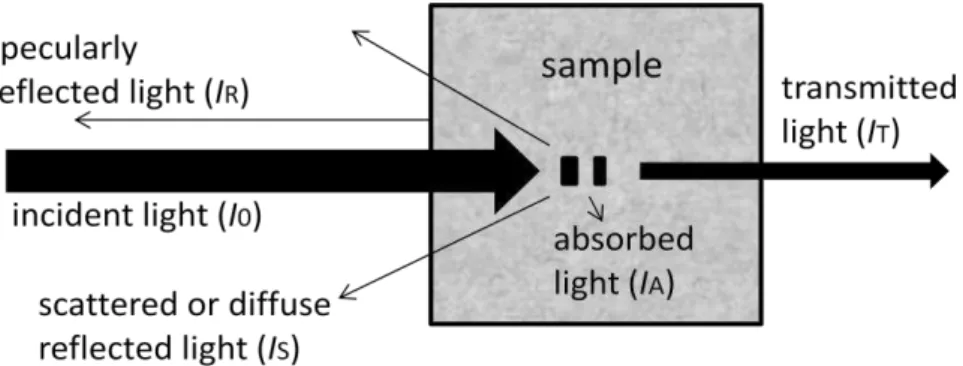
When interacting with a sample, incident light of intensity I0 may be partly reflected (IR) at optical interfaces, partly scattered (IS), absorbed (IA), and transmitted (IT), as shown in Figure 6.
Figure 6. Energy balance of incident light upon interaction with a sample
The energy balance for the incident light may be written as (STEINER, 2005):
The chemical information about the sample goes into IA. This value cannot be measured directly, but it can be evaluated knowing I0 , IR, IT and IS and applying these values to Eq. 1. In the commercial spectrometers only one detector is used to measure a particular couple of intensity values (I0 and either IT, IR, or IS). Thus, the goal of sample preparation is to bring the remaining intensities to zero (or close to zero) (STEINER, 2005).
Several measuring techniques can be employed to assess IR, IT or IS. The traditional technique used for MIR measurements is based on transmittance, usually requiring considerable sample processing, e.g. the production of KBr pellets for powder analysis. Transmittance requires very small samples, on the order of milligrams, and although this may be an advantage for identification of synthesized molecules, it can pose problems for heterogeneous materials, such as food, in relation to representativeness (KAROUI et al., 2010). In NIR spectroscopy, diffuse transmittance is usually measured in the region of the spectrum between 800 and 1100 nm, where weak absorptions enable useful data to be obtained from samples with 1-2 cm thickness, such as meat, cheese or whole grain (HUANG et al., 2008).
reflected. This measurement mode is suitable for thicker samples, such as wheat powder and fruits (HUANG et al., 2008).
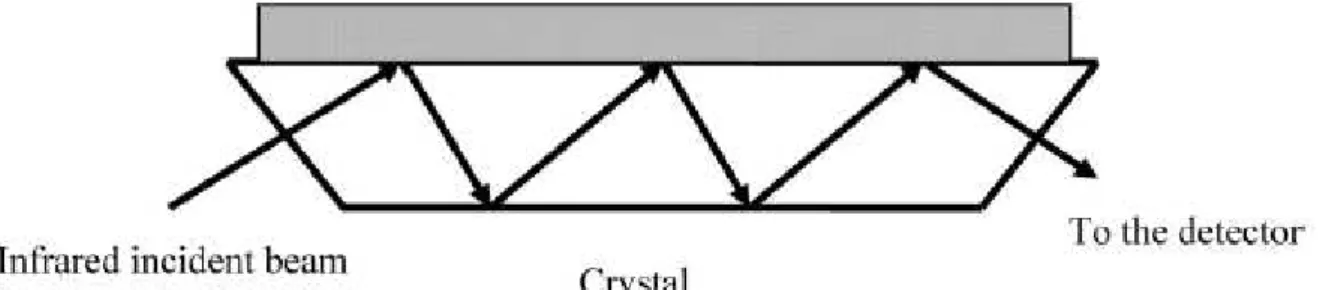
The introduction of the versatile and powerful reflectance technique called attenuated total reflectance (ATR) is probably the most useful increment in MIR measurement techniques (KAROUI et al., 2010). In this technique, a radiation beam enters a crystal and undergoes total internal reflection. The beam penetrates a fraction of a wavelength beyond the reflecting surface and when a material in close contact with the reflecting surface absorbs radiation, the beam loses energy at the wavelength where the material absorbs (see Figure 7). The depth of penetration is a function of the wavelength, the refractive index of the crystal, and the angle of incident radiation (STUART, 2005). ATR is a nondestructive method that requires little or no sample preparation and allows fast and simple sampling regardless of the state of the food system (liquid, gel, solid, etc.). However, attention must be given to the fact that a good contact between sample and crystal surface is needed, limiting the utility of ATR for thick powders. In addition, when using a zinc selenide crystal, the pH of liquid samples must be between 5 and 9 (KAROUI et al., 2010).
Figure 7. Attenuated total reflectance Fourier transform infrared (FTIR-ATR). Source:
KAROUI et al. (2010)
2.3.2. Applications in coffee analysis
A large number of studies have demonstrated the potential of FTIR and NIR in association with chemometrics for the analysis of coffee. The application of such techniques covers the analysis of crude, roasted and ground, soluble and instant coffees.
starch or chicory in soluble coffee (BRIANDET et al., 1996) and corn and coffee husks in roasted and ground coffee (REIS et al., 2013). Other studies aimed to classify defective and non-defective crude coffees (CRAIG et al., 2011, CRAIG et al., 2012b), classify decaffeinated and regular coffees (RIBEIRO et al., 2010), evaluate roasting conditions (LYMAN et al., 2003, WANG and LIM, 2012), and discriminate (WANG et al., 2011) and quantify (WANG et al., 2009) coffees from different geographical origins. In particular, the high structural selectivity observed in FTIR, where many fundamental peaks can be observed in isolated positions, makes this technique a powerful tool for assessing the composition of roasted coffees. In the carbonyl region (1680-800 cm-1), for example, it is possible to attribute peaks to different compounds such as vinyl esters/lactones, esters, aldehydes, ketones, and acids, and observe how the composition of such compounds change as the roasting degree increases or decreases (LYMAN et al., 2003, WANG and LIM, 2012, WANG et al., 2011).
Studies on NIR include the discrimination between arabica and robusta species (DOWNEY and BOUSSION, 1996, DOWNEY et al., 1997), the quantification of robusta in admixture with arabica coffee (PIZARRO et al., 2007a), the quantification of defective and non-defective crude beans enabling a fast assessment of coffee grade (SANTOS et al., 2012), the quantification of caffeine, theobromine and theophylline (PIZARRO et al., 2007b, HUCK et al., 2005), the prediction of roasting degree (ALESSANDRINI et al., 2008) and the prediction of sensory characteristics of the beverage (ESTEBAN-DIEZ et al., 2004b, RIBEIRO et al., 2011). Concerning the latter studies, based on NIR spectra, sensory parameters such as body, flavor, bitterness, cleanliness and overall quality could be predicted in espresso and roasted and ground coffee, and associated with regions of the spectra where different compounds may absorb.