Vol. 35, No. 01, pp. 123 – 130, January – March, 2018
* Corresponding author: Emerson Sarmento Gonçalves. E-mail: [email protected] dx.doi.org/10.1590/0104-6632.20180351s1s20160201
INFLUENCE OF REACTION TIME ON THE
STRUCTURE OF POLYANILINE SYNTHESIZED ON A
PRE-PILOT SCALE
Maria Alice Carvalho Mazzeu
1,4, Lohana Komorek Faria
2,3, Mauricio Ribeiro Baldan
5,
Mirabel Cerqueira Rezende
4,6and Emerson Sarmento Gonçalves
3,4,*1 IndustrialFostering and Coordination Institute (IFI), DCTA, 12228-901, São José dos Campos, SP, Brazil 2 Faculty of Engineering, Architecture and Urbanism (FEAU), Vale do Paraiba University (UNIVAP),
12244-000, São José dos Campos, SP, Brazil
3 Physical Chemistry Characterization Laboratory, Materials Division, Institute of Aeronautics and Space (IAE), DCTA,
12228-904, São José dos Campos, SP, Brazil
4 Technological Institute of Aeronautics (ITA), DCTA, 12228-900, São José dos Campos, SP, Brazil
5 Associated Laboratory of Sensors, National Institute of Space Research (INPE), 12227-010, São José dos Campos, SP, Brazil 6 Institute of Science and Technology, Federal University of São Paulo (UNIFESP), 12231-280, São José dos Campos, SP, Brazil
(Submitted: April 15, 2016; Revised: June 15, 2016; Accepted: September 30, 2016.)
Abstract – The aim of this work is to follow the structural variations of polyaniline (PAni) obtained by chemical oxidation on a pre-pilot scale, with different reaction times. Synthesis of PAni is well known, but when it is carried out on a pre-pilot scale, several factors can lead to structural changes and understanding these changes is important to improve controls on the synthesis process. The polymers formed were characterized by spectroscopic techniques (Raman spectroscopy, Fourier Transform Infrared - FTIR and UV-Visible). Degree of oxidation and yield were calculated for each reaction time. The analysis by FTIR, the calculated degree of oxidation and the yield showed significant changes in polymer structure at reaction times of 65 and 80 min. This result was attributed to the excessive oxidation of PAni, with the breaking of its polymer chain. The changes observed in the structure of PAni gave subsidies to the optimization of the process of obtaining polyaniline by chemical synthesis.
Keywords: Chemical reactor, spectroscopy, synthesis, conducting polymer.
INTRODUCTION
Intrinsic conducting polymers (ICPs) are among the most successful and important discoveries in modern polymer chemistry and physics. These polymers are suc-cessfully used in new advanced materials for photovolta-ic, optoelectronics, sensors, antistatic protection, catalysis, corrosion protection and so forth (Ogurtsov et al., 2013). Polyaniline (PAni) is an environmentally stable and
Brazilian Journal of Chemical Engineering
material. However, the commercial applications of PAni have been limited due to harsh chemical conditions in the synthesis and purification procedures that often lead to an inflexible polymer (Jaymand, 2013).
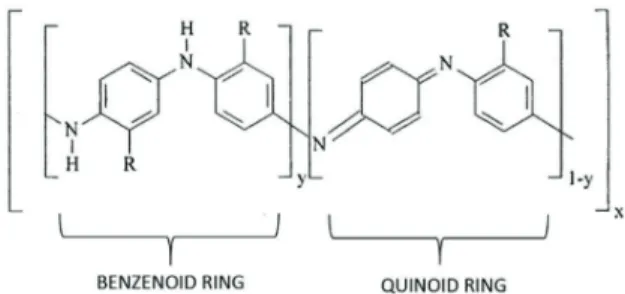
The oxidized and reduced states of PAni, and its de-rivatives, are represented by the index of “y” reduced units (benzenoid ring) and “1 - y” oxidized units (quinoid ring), as indicated in the chemical structure presented in Figure 1, where x is the polymerization degree (Albu-querque et al., 2004).
Figure 1. Benzenoid/quinoid rings (based on Albuquerque et al., 2004).
Three different oxidation states of the PAni, in base form, are known: the completely reduced leucoemeraldine (LB) is obtained when (1 - y) = 0; the oxidized form per-nigraniline (PB) is obtained when (1 - y) = 1; and the 50 % oxidized form emeraldine (EB) is obtained when (1 - y) = 0.5 (Albuquerque et al., 2004). Each PAni oxidation state exists in two forms, namely protonated and deproto-nated (Sapurina and Stejskal, 2010). The reaction parame-ters, such as acid concentration, temperature, time, oxi-dant concentration, aniline/oxioxi-dant molar ratio, concentra-tion and the nature of protonic acid and of the electrolyte have a great influence on the rate of chemical oxidative polymerization of aniline, as well as on its final properties (Dan and Sengupta, 2004; Chowdhury and Saha, 2005; Genies et al., 1985).
The influence of some reaction parameters on PAni structure is well established. In relation to aniline/oxidant mole ratio, it was reported that yield, color and electrical conductivity were strongly dependent on this ratio (Chowdhury and Saha, 2005). As the oxidant concentra-tion is increased above a mole ratio of 1 (oxidant/aniline mole ratio), the yield and intrinsic viscosity decrease. This may be attributable to over oxidation of radical cations responsible for both the growth rate and the chain length of the polymer (Dan and Sengupta, 2004).
The acidity of the medium can be considered the most important parameter of synthesis and has a decisive effect on the formed polymeric structure. The nature of the
ac-id’s anion, the ratio [monomer]: [acid] and the variation of over acidity of the reaction are factors that can induce alterations in the polymerization process, in the morphol-ogy and in the properties of the aniline oxidation products (Sapurina and Stejskal, 2010).
There are many papers on optimizing the preparation of PAni with variables like pH (Genies et al., 1985), kind of oxidizer (Fong and Schlenofft, 1995), temperature (Stejskal and Gilbert, 2002), and electrolyte effect (Matto-so, 1996). However, the results are difficult to compare because different studies have used different conditions of preparation and characterization (Blinova et al., 2007).
In this study, the synthesis of PAni was carried out on a pre-pilot scale, with different times of reaction, keeping the other parameters of synthesis constant. Through spec-trometric analysis by Fourier Transform Infrared (FTIR), Raman spectroscopy and UV-Visible, the quantification of the degree of oxidation and yield seeks to determine the changes that occur in the structure of PAni during the chemical synthesis, following the addition of oxidant until 2 h after the end of this addition, aiming at contributing to the optimization of this synthesis process.
MATERIALS AND METHODS Synthesis of PAni in different reaction times
Aniline solutions (1.0 M/1,8 L) and ammonium per-oxydisulfate (1.9 M/0,7 L) solutions have been prepared in aqueous solution containing 1.0 M hydrochloric acid and 1.0 M sodium chloride.
The salt addition was used to prevent freezing when synthesis is carried out at temperatures below 0°C (Sbaite et al., 2004).
The chemical synthesis was performed in a 5-L glass reactor with glass rods and Teflon naval type propellers, for agitation. A cooling jacket was connected to a con-stant temperature bath, containing ethylene glycol. The reactor temperature was maintained at (-5 ± 1)°C.
First, the aniline solution was added to the reactor and kept under constant stirring. Then ammonium peroxydi-sulfate solution was added drop-wise, through an addition funnel, at a rate of 14 ml per minute. The reaction times were 10, 20, 35 and 50 min, during the addition of the oxidant. After the complete addition of the ammonium peroxydisulfate solution, five other reactions continued stirring for 15, 30, 45, 60 and 120 min, respectively. The time the addition of ammonium peroxydisulfate solution started was considered the initial time of the reaction, so the final reaction times were 65, 80, 95, 110 and 170 min.
Brazilian Journal of Chemical Engineering Vol. 35, No. 01, pp. 123 – 130, January – March, 2018 the washing liquid was colorless and pH was around 6.
The polymer, re-suspended in a 1.0 M ammonium hy-droxide solution, was kept under agitation for 12 h to perform the deprotonation process. After deprotonation, the material was filtered again, washed with approximate-ly 10 L of distilled water and the power (dark brown col-or) was dried in a conventional oven at 60°C until con-stant weight.
Characterization of PAni
The FTIR spectra of the synthesized polymers were recorded on samples in powder form, without previous preparation, using a FTIR spectrometer Spectrum 2000 (PerkinElmer), in 4000 to 600 cm-1 region. The technique used was Attenuated Total Reflectance (ATR), with 120 N of torque.
The Raman spectra were recorded by pressing the powder sample on a glass slide. These analysis were per-formed on a Raman spectrometer model 2000 (Renishaw) with an Argon laser (0.5 MW) at 514.5 nm.
The Visible spectra were recorded in a UV-Visible spectrometer Lambda 35 (PerkinElmer) using 1-methyl-2-pyrrolidinone (NMP) as a solvent. PAni samples were dissolved in NMP, kept under stirring for 12 h and filtered to remove the undissolved material. The filtrate was diluted at a ratio of 1: 20 (v/v) in NMP and this solu-tion (0.01 g/L) was used to obtain the spectra.
The polymer yield was calculated by the ratio between the amount of PAni formed and the amount of aniline charged, in g (Chowdhury and Saha, 2005).
RESULTS AND DISCUSSION
The synthesis was carried out reproducing the same conditions of temperature, concentration of reactants and additives (HCl and NaCl). The only variable was the reaction time, considered in two distinct steps: PAni ob-tained during the addition of oxidant (reaction times ≤ 50 min) and PAni obtained after the addition of oxidant (re-action times > 50 min).
Polymerization of aniline
The reaction started immediately when the ammonium peroxydisulfate solution was added. The formation of a dark precipitate in the solution was observed from the beginning of the reaction. Under these synthesis condi-tions — temperature of -5°C, acidic medium (1 M HCl) and a high concentration of oxidant (1.9 M) —, this reac-tion is very fast and it is not possible to visually distin-guish if the reaction occurs in one or more steps. The
solid material formed remains in suspension throughout the reaction.
Generally, the oxidation of aniline in hydrochloric ac-id solution by ammonium peroxydisulfate gives PAni, sulfuric acid, hydrochloric acid and ammonium sulfate (Sedenková et al., 2011).
As the polymer was deprotonated with 1 M ammoni-um hydroxide, the formed PAni must not have conductive structures. In FTIR spectroscopy, the characteristic bands of conductivity are assigned to frequencies between 1237 and 1248 cm-1 and also in the region between 1124 cm-1 and 1160 cm-1 (Dimitrieva and Dunsch, 2011; Trchová et al., 1999; Tang et al., 1988). The Raman frequency relat-ed to conductivity, for a 514 nm excitation line, is local-ized at frequencies between 1335 and 1339 cm-1 (Morá-viková et al., 2012; Lapiński and Dubis, 2012). In the UV-Visible spectra, the protonated form of PAni shows absorption bands at 335 - 340 nm, 440 - 480 nm and 800 - 870 nm (Rao et al., 2000; Kavitha et al., 2012). The fre-quencies relating to PAni protonated in FTIR spectra bands were found with very low intensities, indicating that these bands can be trace amounts. In the Raman and UV-Visible spectra, bands assigned to conductivity have not been identified.
Yield of PAni
At 10 and 20 min reaction times, the oxidant was 20 and 40% of the total amount, respectively, and the yield was close to 17%. According to Yang and Weng (2009), PAni yield is greatly influenced by the molar ratio of oxidant/aniline. Therefore, this lower value is due to the smaller amount of oxidants present in the reaction. Chow-dhury and Saha (2005) demonstrated that the incomplete conversion of aniline to PAni, due to the smaller quanti-ties of oxidant, could lead to smaller yield, when the mole ratio aniline/oxidant is greater than 2.4 soluble oligomers could be produced.
At 35 min reaction time, 70% of the oxidant was add-ed and the yield almost doubladd-ed, going to 32.9%. A max-imum value of 66.0% was obtained at 50 min reaction time, when ammonium peroxydisulfate addition was complete. In 65 and 80 min reaction time, there was a decrease of the yield (34.5 and 39.9%) and it increased again for 95 min (58.7%), when it began to be stable (50.1 and 53.8% for 110 and 170 min reaction time, respective-ly).
Brazilian Journal of Chemical Engineering there is a high oxidant concentration (molar ratio
ani-line/oxidant less than 2.0), the formation of oxidation products with low molecular weight occurs, which are also water soluble, reducing the yield (Chowdhury and Saha, 2005). On the other hand, at 95, 110 and 170 min reaction times, the yields were close to 50%, indicating a stabilization. It is likely that the yield does not suffer major changes, even with the increased reaction time. The results obtained are consistent with those found by Cao et al. (1989), who obtained a yield from 36.9% and Ro-drigues and Paoli (1991) who obtained a yield lower than 80%.
FTIR spectroscopy
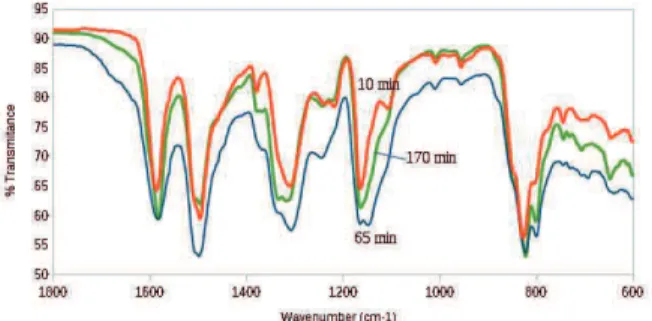
FTIR spectroscopy is a useful tool for various science and engineering fields, due to high sensitivity or selectivi-ty toward trace amounts of sample, as well as low noise to signal ratio; moreover, this method is easy and inexpen-sive. Apart from those qualitative applications, FTIR spectroscopy is also used in quantitative determinations (Arasi et al., 2009). Figure 2 shows the FTIR spectra of PAni EB for some reaction times.
Figure 2. FTIR spectra of PAni EB for 10 min, 65 min and 170 min reaction time.
The assignments of the absorption bands were de-scribed in several papers. The frequencies found for PAni samples obtained at different reaction times as well as the tasks set for each region are described next:
1. 1800 - 1450 cm-1 region, where the aromatic ring vibrations, N-H bending and C=N stretching are found. The bands attributed to C=C stretching in quinoid and benzenoid rings are found in this region too. These two very strong bands were used to determine the degree of oxidation (R), which is the ratio between the intensity of the band assigned to the quinoid ring (frequency of 1582 to 1587 cm-1, for this experiment) and the intensity of the
band assigned to the benzenoid ring (frequency of 1495 to 1498 cm-1, for this experiment). This variation is related to the oxidation of benzenoid rings, which are trans-formed into quinoid rings, including the transformation of amino groups into imino groups upon oxidation of the polymer (Kellenberger et al., 2012; Furukawa et al., 1988).
2. 1400 - 1240 cm-1 region, where the C-N stretching of aromatic amines is found. A strong band at 1306 - 1315 cm-1 appears at all reaction times. The 50 min reaction time begins to show a shoulder around 1330 cm-1, which, at the 170 min reaction time, turns into a doublet. The shoulder and the doublet imply that this band may contain more than a single vibrational mode (Kellenberger et al., 2011). The doublet can be associated with the existence of two different conformations of PAni (Nascimento, 2010). Other bands in this region (1377 - 1379 cm-1, 1239 - 1246 cm-1, 1220 - 1224 cm-1) have low intensity and do not show variations with the reaction time.
3. 1200 - 600 cm-1 region, where the bending vibra-tions in-plane and out-of-plane of C-H are found and two strong bands appear, one at 1160 - 1165 cm-1 and the other at 822 - 824 cm-1, with a small band behind it, at 830 cm-1. The 65 and 80 min reaction times feature a doublet at 1160 and 1147 cm-1. This second band can be attributed to the presence of pernigraniline base form (PB). A doublet with a shoulder near 1497 cm-1 and a shift to higher frequencies (1500 cm-1), which appears at the 80 min (doublet) and 65 - 95 min (shoulder) reaction times, can also be attributed to the PB form (Quillard et al., 1994). It is well established that, in the polymerization of aniline by strong oxidizers such as ammonium peroxy-disulfate, the initially formed product is PB (fully oxi-dized form), which is reduced to the EB form, due to excess aniline present in the solution (Beadle et al., 1998).
So, the main changes in the FTIR spectra to PAni ob-tained in different reaction times were found at 65 and 80 min, probably due to over oxidation.
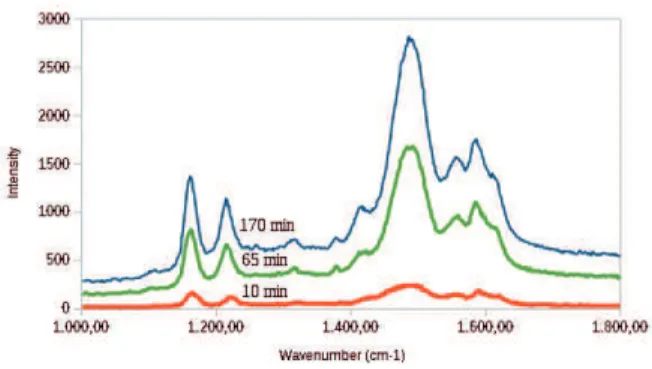
Raman spectroscopy
Raman scattering spectroscopy is useful to study and characterize different oxidation and doping forms of PAni (Nobrega et al., 2014). Raman spectra of PAni and other related polymers are usually rich in bands which corre-spond to a wide variety of vibrational modes,
characteris-tic for these species (Mažeikienė et al., 2007).
Brazilian Journal of Chemical Engineering Vol. 35, No. 01, pp. 123 – 130, January – March, 2018
Figure 3. Raman spectra of PAni EB at 10 min, 65 min and 170 min reaction time.
The band frequencies found in the Raman spectra for these polymers are aligned with the values found in the literature for the EB base form (Maser et al., 2003; Berra-da et al., 1995).
Generally, there are three regions in Raman spectra of PAni that are sensitive (Mažeikienė et al., 2007):
1. 1100 - 1200 cm-1 region, where C-H bending
vibra-tions of benzene or quinoid rings are more prominent. Two medium intensity bands were found in the range of 1162 to 1167 cm-1 and 1216 to 1223 cm-1, which were
attributed to quinoid and benzenoid rings, respectively. 2. 1210 - 1520 cm-1 region, stretching vibrations
char-acteristic of C-N (imine) and C=N. A band with greater intensity was found at 1485 - 1489 cm-1 and, besides this
band intensity varied with the time of reaction from the shortest time to the biggest one, the frequency did not show significant variation.
3. 1520 - 1650 cm-1 region, with the domain of C-C
and C=C stretching vibrations of the benzene and quinone rings. Overlapping bands were found at 1557 - 1560, 1586 - 1594and 1613 - 1619 cm-1, which varied in intensity
with the reaction time, that is, the longer the time, the greater the intensity. The variation in frequency was ran-dom, not being observed any pattern.
The assignment of frequencies for Raman spectrosco-py varies greatly with the laser frequency used, as well as with the polymer form (base or salt). The bands that are ascribed to the C-H bending in quinoid and benzenoid rings are close to 1160 and 1881 cm-1, respectively, giving
direct information about the degree of oxidation of PAni (Ogurtsov et al., 2013). In the spectra obtained for differ-ent reaction times, the band found at 1216 - 1223 cm-1
was assigned to the benzenoid ring due to the intensity and because there is not another band in this region that could be assigned to that.
UV-Vis spectroscopy
The UV-Vis spectra for several reaction times are shown in Figure 4.
Figure 4. UV-Vis spectra of PAni EB at 10 min, 65 min and 170 min reaction time.
The UV-Visible spectrum of PAni in base form is dominated by two absorption bands, one at 330 nm (IB), assigned to the π-π * transition in the benzenoid ring, and the other in the visible region, 630 nm (IQ), attributed to excitation in the quinoid rings (Bairi et al., 2013). The ratio between the intensity of IQ and the intensity of IB indicates the relative amount of quinoiddiimine units in PAni molecules, i.e. the oxidation state of PAni, which plays a key role in determining the properties of Pani (Wang and Jing, 2005). For the 10 to 170 min reaction times, the bands were found at the frequencies of 325 - 333 and 635 - 645 nm. The variation in frequency was random e not linear with the reaction time.
Measurement of the degree of oxidation (R)
The R value is an indicative of the PAni oxidation lev-el. It is calculated by the ratio R = IQ/IB, where I is the intensity of the UV-Visible or FTIR or Raman spectrum band; Q is the band corresponding to the quinoid ring and B is the band corresponding to the benzenoid ring, for each spectroscopic technique. For determining the intensi-ty of the bands corresponding to the absorption of quinoid and benzenoid rings, deconvolutions were carried out for the respective bands, with the aid of the software Origin 8, where the bands were fit using Lorentzian functions, after correction for the baseline. Figure 5 shows the for-mat of the bands for each technique, after deconvolution and fit. The spectra shown in the figure were obtained for the sample with 110 min reaction time.
Brazilian Journal of Chemical Engineering and R values obtained through the bands of FTIR,
UV-Visible and Raman spectra are shown in Table 1.
Table 1. R values (IQ/IB) for PAni obtained at different reaction times
Reaction time (min)
UV-Vis FTIR RAMAN
R=I630/I330 R=I1585/I1496 R=I1587/I1620
10 0.79 0.92 1.65
20 0.79 1.05 1.48
35 0.73 1.04 1.70
50 0.76 1.06 1.97
65 0.60 0.84 1.21
80 0.58 0.91 1.32
95 0.80 1.05 1.85
110 0.77 1,.05 1.80
170 0.76 1.14 1.91
Figure 5. Bands after fitting and deconvolution for 1. FTIR; 2. Raman; 3. UV-Visible. Reaction time of 110 min. Full line: normal bands; dashed line: bands after deconvolution.
The UV-Visible spectra results suffer interference from the solvent and the phase separation, due to the
par-tial solubility of PAni in NMP. The spectra were obtained for the polymer soluble in NMP, unlike the FTIR and Raman spectra, that were obtained with the material in powder form, without previous preparation and, therefore, without interference of the solvent.
The R values obtained from the FTIR spectra are very close to 1, the R values for Raman are above 1 and for UV-Visible, the R values are lower than 1. If the ratio between the two bands is less than 1.0, there are more benzene units within the polymer. A value of 1.0 defines the emeraldine type structure and the polymer can have higher conductivity (Abdiryim et al., 2005) in protonated form.
The material insoluble in NMP contributed to the re-duction of the UV-Visible intensity, resulting in lower values. Raman bands presented difficulty for deconvolu-tion, due to the proximity between them and the bands could overlap each other. The FTIR technique appears to be the best for determining the R value.
At 65 and 80 min reaction times, the R value decreas-es, regardless of the spectroscopic technique (FTIR, UV-Visible or Raman), when compared with other reaction times. As R is indicative of the degree of oxidation of the polymer, there is a reduction of the oxidation in those times. This reduction may be associated with a hydrolysis that occurs in more acidic media and becomes more sig-nificant for polymers exhibiting higher oxidation states than that of EB (Pron et al., 1988). The excessive oxida-tion of PAni, causing degradaoxida-tion of the polymer by hy-drolysis, can produce benzoquinone and hydroquinone (Chen et al., 2002).
The breaking of the carbon-nitrogen bonds by hydrol-ysis may lead to chain breaking or elimination of nitro-gen, if a terminal group is involved (Pron et al., 1988). For hydrolysis, a more acidic environment is needed and this condition is achieved due to the presence of hydro-chloric acid and sulfuric acid release as a by-product. This hydrolysis may also occur with a polymer having a higher oxidation state than that of EB. The FTIR spectra for 65 and 80 min reaction times have absorption frequencies that can be attributed to PB base, supporting the idea of an over oxidation of the polymer and a process of breaking the polymer chain, in agreement with the literature (Gos-podinova and Terlemezyan, 1998; Gao et al., 2011).
CONCLUSIONS
Brazilian Journal of Chemical Engineering Vol. 35, No. 01, pp. 123 – 130, January – March, 2018 and temperature) were maintained constant for each
syn-thesis, with the time as the single variable. The polymer produced at each reaction time was characterized by spec-troscopic techniques (FTIR, Raman and UV-Visible), degree of oxidation and yield.
Differences in yield were found, as a function of reac-tion time. In the addireac-tion step (10, 20, 35 and 50 min), this yield grew in a linear fashion, but it was reduced at times after the end of the addition (65 and 80 min), returning to grow and stabilizing at the longer times (95, 110 and 170 min). This variation in yield is consistent with the possi-bility of having occurred a hydrolysis at reaction times of 65 and 80 min, and stability indicates that, at 110 min after addition started, it is possible to obtain a constant value for the yield.
At 65 and 80 min reaction times the FTIR spectra show the possibility of PB being present along with EB, while the UV-Visible and Raman spectra show the typical bands of EB base.
These spectra were used to quantify the degree of oxi-dation and the obtained values show that, during the addi-tion, for 10 to 50 min reaction times, the R values showed little variation. In the 65 and 80 min reaction times, these values decreased. This behavior can be explained by the hypothesis of hydrolysis due to the excess of acid in the reaction medium and over oxidation of the polymer. Hy-drolysis leads to the breakdown of the polymer chain and over oxidation produces the more oxidized form of poly-aniline, the pernigraniline form.
At 95 to 170 min reaction times, the degree of oxida-tion increased again, with values very close at these reac-tion times. Therefore, under the evaluated condireac-tions of synthesis, the appropriate reaction time to obtain the best product was 110 min after the onset of the reaction.
ACKNOWLEDGMENTS
The authors thank the DCTA/IAE that, through the Physical Chemistry Characterization Laboratory, Materi-als Division (AMR), provided the necessary structure and materials for this study.
REFERENCES
Abdiryim, T., Xiao-Gang, Z. and Jamal, R., Comparative studies of solid-state synthesized polyaniline doped with inorganic acids, Materials Chemistry and Physics, 90, 367 (2005). Albuquerque, J. E., Mattoso, L. H. C., Faria, R. M., Masters, J.
G. and MacDiarmid, A. G., Study of the interconversion of polyaniline oxidation states by optical absorption spectroscopy, Synthetic Metals, 146, 1, (2004).
Arasi, A. Y., Jeyakumari, J. J. L., Sundaresan, B., Dhanalakshmi, V. and Anbarasan, R., The structural properties of Poly (aniline) -Analysis via FTIR spectroscopy, SpectrochimicaActa Part A: Molecular and Biomolecular Spectroscopy, 74, No. 5, 1229 (2009). Bairi, V. G., Bourdo, S. E., Moore, J. A., Schunackenberg, L.
K., Berry, B. C., Biris, A. S. and Viswanathan, T., Separation and spectroscopic/molecular weight snalysis of crude and purified polyaniline(s), Journal of Polymer Research, 20, No.193, 1 (2013).
Beadle, P. M., Nicolau, Y. F., Banka, E., Rannou, P. and Djurado, D., Controlled polymerization of aniline at sub-zero temperatures, Synthetic Metals, 95, 29 (1998).
Berrada, K., Quillard, S., Louam, G. and Lefrant, S., Polyanilines and substituted polyanilines: a comparative study of the Raman spectra of leucoemeraldine, emeraldine and pernigraniline, Synthetic Metals, 69, 201 (1995). Blinova, N. V., Stejskal, J., Trchová, M., Prokes, J. and
Omastová, M., Polyaniline and polypyrrole: A comparative study of the preparation, European Polymer Journal, 43, 2331 (2007).
Cao, Y., Andreattat, A., Heegert, A. J., and Smitht, P., Influence of chemical polymerization conditions on the properties of polyaniline, Polymer, 30, No.12, 2305 (1989).
Chen, W-C., Wen, T-C.andGopalan, A., The inductive behavior derived from hydrolysis of polyaniline, ElectrochimicaActa, 47, No.26, 4195 (2002).
Chowdhury, P. and Saha, B., Potassium dichromate initiated polymerization of aniline, Indian Journal of Chemical Technology, 12, 671 (2005).
Dan, A., Sengupta, P. K., Synthesis and Characterization of Polyaniline Prepared in Formic Acid Medium, Journal of Applied Polymer Science, 91, 991 (2004).
Dmitrieva, E. and Dunsch, L., How Linear Is “Linear” Polyaniline?, The Journal of Physical Chemistry B, 115, 6401 (2011).
Fong, Y. and Schlenofft, J. B., Polymerization of aniline using mixed oxidizers, Polymer, 36, No.3, 639 (1995).
Furukawa, Y., Ueda, F., Hyodo, Y., Harada, I., Nakajima, T. and Kawagoe, T., Vibrational spectra and structure of polyaniline, Macromolecules, 21, No. 5, 1297 (1988). Gao, M., Zhang, G., Zhang, G., Wang, X., Wang, S. and Yang,
Y., The resistance to over-oxidation for polyaniline initiated by the resulting quinone-like molecules, Polymer Degradation and Stability, 96, No.10, 1799 (2011).
Genies, E. M., Syed, A. A. and Tsintavis, C., Electrochemical study of polyaniline in aqueous and organic medium, Redox and kinetic properties, Molecular Crystals and Liquid Crystals, 121, No.1-4, 181 (1985).
Gospodinova, N. and Terlemezyan, L., Conducting polymers prepared by oxidative polymerization: polyaniline, Progress in Polymer Science, 23, No. 8, 1443 (1998).
Jaymand, M., Recent progress in chemical modification of polyaniline, Progress in Polymer Science, 38, 1287 (2013). Kavitha, B., Prakabar, K., Siva kumar, K., Srinivasu, D.,
Brazilian Journal of Chemical Engineering polyaniline, Journal of Applied Chemistry, 2, No.1, 16
(2012).
Kellenberger, A., Dmitrievaa, E. and Dunsch, L., The stabilization of charged states at phenazine-like units in polyaniline under p-doping: an in situ ATR-FTIR
spectroelectrochemical study, Physical Chemistry Chemical Physics, 13, 3411 (2011).
Kellenberger, A., Dmitrieva, E. and Dunsch, L., Structure Dependence of Charged States in “Linear” Polyaniline as Studied by In Situ ATR-FTIR Spectroelectrochemistry, The Journal of Physical Chemistry B, 116, No. 14, 4377 (2012). Kolla, H. S., Surwade, S. P., Zhang, X., MacDiarmid, A. G. and
Manohar, S. K., Absolute Molecular Weight of Polyaniline, Journal of American Chemistry Society, 127, No.48, 16770 (2005).
Lapiński, A., Dubis, A. T., Plonska-Brzezinska, M. E.,
Mazurczyk, J., Breczko, J. and Echegoyen, L., Vibrational spectroscopic study of carbon nano-onions coated with polyaniline, Physica Status Solidi C, 9, No. 5, 1210 (2012). Maser, W. K., Benito, A. M., Callejas, M. A., Seeger, T.,
Martinez, M. T., Schreiber, J., Muszynki, J., Chauvet, O., Osváth, Z., Koós, A. A. and Biró, L. P., Synthesis and characterization of new polyaniline/nanotube composites, Materials Science and Engineering C, 23, 87 (2003).
Mattoso, L. H. C., Polianilinas: Síntese, Estrutura e Propriedades, Quimica Nova,19, No.4, 388 (1996).
Mažeikienė, R., Tomkutė, V., Kuodis, Z., Niaura, G. and
Malinauskas, A., Ramanspectroelectrochemical study of polyaniline and sulfonatedpolyaniline in solutions of different pH, Vibrational Spectroscopy, 44, 201 (2007). Morávková, Z., Trchová, M., Exnerová, M. and Stejskal, J., The
carbonization of thin polyaniline films, Thin Solid Films, 520, 6088 (2012).
Nascimento, G. M., Spectroscopy of PolyanilineNanofibers, Nanofibers, Ashok Kumar (Ed.) ISBN: 978-953-7619-86-2, InTech. (2010).
Nobrega, M. M., Ceppatelli, M., Temperini, M. L. A. and Bini, R., Pressure-Induced Reactivity in the Emeraldine Salt and Base Forms of Polyaniline Probed by FTIR and Raman, The Journal of Physical Chemistry C, 118, No. 47, 27559 (2014). Ogurtsov, N. A., Noskov, Y. V., Fatyeyeva, K. Y., Ilyin, V. G., Dudarenko, G. V. and Pud, A.A., Deep impact of the template on molecular weight, structure, and oxidation state
of the formed polyaniline, The Journal of Physical Chemistry B, 117, 5306 (2013).
Pron, A., Genoud, F., Menardo, C. and Nechtschein, M., The effect of the oxidation conditions on the chemical polymerization of polyaniline, Synthetic Metals, 24, 193 (1988).
Quillard, S., Louarn, G., Lefrant, S., and MacDiarmid, A. G., Vibrational analysis of polyaniline: A comparative study of leucoemeraldine, emeraldine, and pernigraniline bases, Physical Review B, 50, 12496 (1994).
Rao, P. S., Ananda, J., Palaniappanb, S. and Sathyanarayana, D. N., Effect of sulphuric acid on the properties of polyaniline-HCl salt and its base, European Polymer Journal, 36, 915 (2000).
Rodrigues, M. A. and De Paoli, M-A., Electrochemical properties of chemically prepared poly (aniline), Synthetic Metals, 41-43, 2957 (1991).
Sapurina, I. Y. and Stejskal, J., The effect of pH on the oxidative polymerization of aniline and the morphology and properties of products, Russian Chemical Reviews, 79, No.12, 1123 (2010).
Sbaite, P., Huerta-Vilca, D., Barbero, C., Miras, M. C. and Motheo, A. J., Effect of electrolyte on the chemical polymerization of aniline, European Polymer Journal, 40, 1445 (2004).
Sedenková, I., Konyushenkoa, E. N., Stejskal, J., Trchová, M. and Prokes, J., Solid-state oxidation of aniline hydrochloride with various oxidants, Synthetic Metals, 161, 1353 (2011). Stejskal, J. and Gilbert, R. G., Polyaniline. Preparation of a
conducting polymer (IUPAC technical report), Pure and Applied Chemistry, 74, No.5, 857 (2002).
Tang, J., Jing, X., Wang, B. and Wang, F., Infrared Spectra of Soluble Polyaniline, Synthetic Metals, 24, 231 (1988). Trchová, M., Stejskal, J. and ProkeS, I., Infrared spectroscopic
study of solid-state protonation and oxidation of polyaniline, Synthetic Metals, 101, 840 (1999).