Research Article
Differential Evolutionary Constraints in the Evolution of
Chemoreceptors: A Murine and Human Case Study
Ricardo D’Oliveira Albanus,
1Rodrigo Juliani Siqueira Dalmolin,
1José Luiz Rybarczyk-Filho,
2Mauro Antônio Alves Castro,
1and José Cláudio Fonseca Moreira
11Departamento de Bioqu´ımica, Universidade Federal do Rio Grande do Sul, Rua Ramiro Barcelos 2600,
90040-180 Porto Alegre, RS, Brazil
2Departamento de F´ısica e Biof´ısica, Universidade Estadual Paulista, Distrito de Rubi˜ao J´unior, S/N, 18618-970 Botucatu, SP, Brazil
Correspondence should be addressed to Ricardo D’Oliveira Albanus; [email protected]
Received 7 August 2013; Accepted 23 October 2013; Published 23 January 2014
Academic Editors: M. Frank, B. Gantenbein-Ritter, B.-Y. Liao, and M. Shimoyama
Copyright © 2014 Ricardo D’Oliveira Albanus et al. his is an open access article distributed under the Creative Commons Attribution License, which permits unrestricted use, distribution, and reproduction in any medium, provided the original work is properly cited.
Chemoreception is among the most important sensory modalities in animals. Organisms use the ability to perceive chemical compounds in all major ecological activities. Recent studies have allowed the characterization of chemoreceptor gene families. hese genes present strikingly high variability in copy numbers and pseudogenization degrees among diferent species, but the mechanisms underlying their evolution are not fully understood. We have analyzed the functional networks of these genes, their orthologs distribution, and performed phylogenetic analyses in order to investigate their evolutionary dynamics. We have modeled the chemosensory networks and compared the evolutionary constraints of their genes inMus musculus,Homo sapiens,
andRattus norvegicus. We have observed signiicant diferences regarding the constraints on the orthologous groups and network
topologies of chemoreceptors and signal transduction machinery. Our indings suggest that chemosensory receptor genes are less constrained than their signal transducing machinery, resulting in greater receptor diversity and conservation of information processing pathways. More importantly, we have observed signiicant diferences among the receptors themselves, suggesting that olfactory and bitter taste receptors are more conserved than vomeronasal receptors.
1. Introduction
he ability to evaluate the environment has always been of vital importance to all organisms. In order to ind food, detect dangers, and search for reproductive partners, a constant appraisal of the outside world must be made by any organism. Chemosensory reception is one such tool for this task, and it is present in all life forms. Over the last decade, several studies were conducted in order to characterize the diferent chemosensory receptors (CR) genes [1–4]. In vertebrates, they are coded by six major multigene families: the trace amine-associated receptors (TAAR) [5], the olfactory recep-tors (OR) [6], the type I and II vomeronasal receptors (V1R and V2R) [3,4,7], and type I and II taste receptors (T1R and T2R) [1,2]. All proteins coded by these genes are G protein-coupled proteins [8].
Diferent from other environmental appraisal systems such as vision and hearing, which remained relatively stable once they were formed, chemosensory reception must be constantly tuned to an ever-changing environment of odors and toxins. his need for variability is relected in the organi-zation of the CR genes in the genome. In all studied species, it was found that these genes occur in great numbers, and there are considerable numbers of CR pseudogenes [4,9–11], suggesting that they are prone to duplication and inactivation events. here are theories to explain the evolution of CR genes [9,11–14], but several gaps regarding this subject still remain. For instance, there are no currently available data regarding the evolutionary dynamics of the chemosensory apparatus as a whole (i.e., the CR and its signal transducing machinery). Equally unclear are the diferences in evolutionary dynamics among the CR families.
In this work, we have tackled the evolution of the mammalian CR gene families and their signal transducing machinery from a systems biology-oriented approach. We have analyzed the orthologs distribution of the chemosensory machinery, their functional networks topologies, and their phylogenetic diversity inMus musculus, Rattus norvegicus, andHomo sapiens. We have found evidences that there are distinct evolutionary dynamics in the CR genes and the signal transducing apparatus. More importantly, we have observed signiicant diferences among the CR gene families, suggest-ing distinct evolutionary dynamics for each receptor type.
2. Methods
2.1. Data Collection. In order to determine which receptors are involved in each sensory modality, we have gathered data from the Gene Ontology (GO) Consortium [15] regarding
Homo sapiens, Mus musculus, and Rattus norvegicus. GO groups used were 0004984—MF Olfactory receptor activ-ity, 0007608—BP Sensory perception of smell, 0008527— MF Taste receptor activity, 0050909—BP Sensory percep-tion of taste, 0016503—MF Pheromone receptor activity, 0019236—BP Response to Pheromone. We have chosen these three species for our study due to robustness of their genomic/proteomic data available in databases. Studied genes were sorted in groups according to their receptor modality: olfactory receptors; taste receptors; and vomeronasal recep-tors. We made one further division of the GO taste group to separate taste receptors type 1 and 2 and study them sepa-rately because of their functional diferences. TAAR genes were withdrawn from our analysis due to lack of data in the databases. Also due to lack of available data, we have combined the two vomeronasal families (V1R and V2R) and studied them as a single group (VN). We have sorted all genes in GO groups into two functional categories: the irst con-sisted of genes coding the proteins directly involved in bind-ing chemical stimuli (the chemosensory receptors per se), and the second consisted of the rest of the genes related to signal transduction machinery (STM).
Functional network parameters of proteins coded by CR genes were gathered using STRING database (String-DB), version 8.3 [16], using their corresponding ENSEMBL IDs. To assemble these IDs, a cross-search was performed between GO, String-DB, HUGO Gene Nomenclature Consortium [17], Mouse Genome Informatics [18], Rat Genome Database [19], and BioMart [20] databases. Genes that presented ID divergences among databases were manually curated or removed from our analysis. String-DB analyses were made with a 0.7 combined score and only interactions generated from experiments and databases were used. his is a medium to high stringency parameter.
2.2. Topology and Evolutionary Plasticity Analysis. Topolo-gies of the receptors functional networks were analyzed by connectivity [�(�)] and clusterization [�(�)] indexes of their components.�(�)index is calculated by the number of
neighbors that an�node has in a network, and�(�) by the equation
� (�) = 2��
��(��−1), (1)
which represent general interactivity of�’s neighbors, where �� represents the number of their connections among each other. Evolutionary Plasticity Index (EPI) of the orthologous groups of these proteins was calculated by equation
EPI= 1 − ��
√��, (2)
where �� is the ortholog diversity in the eukaryotic tree, calculated using how many species the ortholog is found, and �� is its abundance, calculated by the number of ortholog members found in each species [21]. Orthology data of these proteins was also gathered using String-DB. All statistical analyses were made using one-way ANOVA with Tukey’s test. �(�)and�(�)indexes were compared by the Shannon diversity (�) of their distribution, using equation
� = − ∑ �ln�, (3)
where�is the probability of a value occurrence in any dataset. Entropy calculation was used in a complementary way in order to mathematically support or refute any observations in the connectivity and clusterization distribution behavior. In order to generate the graphical representations of the CR network, we have plotted String-DB interactions of all Gene Ontology groups proteins among each other using RedeR R package [22]. he list of all the genes analyzed in this work is presented in the Supplementary Material available online at http://dx.doi.org/10.1155/2014/696485.
2.3. Phylogenetic Analysis. Chemoreceptor genes sequences were gathered from the Chemosensory Receptor Database [23]. Alignments and trees were made with the MEGA 5.2 sotware [24], using, respectively, the Muscle alignment algo-rithm [25,26] and the Tamura-Nei model [27]. Parameters used were the default for each algorithm. Branch reliabil-ity was calculated using bootstrap method. 100 bootstrap replications were performed for T1R, T2R, and VN and 50 replications for OR. For entropy analysis, we have calculated the Shannon diversity of the phylogenetic trees by subsetting each tree into�consecutives samples of �size, where�is the tree size and�is the maximum tree depth (i.e., number of levels). his was made to detect whether tree diversity was consistent throughout the entire tree radius. One-way ANOVA was used in order to compare these results. We have chosen� as the number of levels as a means for deining proportional windows for each tree.
3. Results
Receptors STM EPI 1.0 0.8 0.6 0.4 0.2 0.0 ∗∗
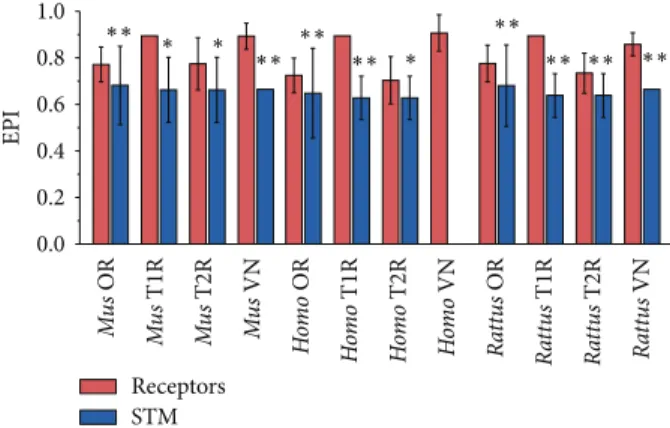
Figure 1: Mean EPI values of chemoreceptors (red) and signal transducing machinery (blue). he edges of the boxes indicate the upper and lower quartiles. he line at the center of each box indicates the median, the square represents the mean, and whiskers represent the standard deviation. Asterisks indicate statistically signiicant data (� < 0.001).
and their signal transducing machinery (STM). We have observed that CR genes as a whole have signiicantly higher plasticity values than the STM (Figure 1), indicating that CR genes have a broader ortholog distribution than the STM, meaning that the latter was subject to less variation during the course of evolution. To further corroborate these indings, we have compared each CR family separately to its signal transducing machinery. We have found that, in all cases but one, the EPI of each CR family was signiicantly higher than its STM (Figure 2). he exception was the human vom-eronasal (VN) genes, which lack their STM due to the loss of the TRPC2 channel [28,29].
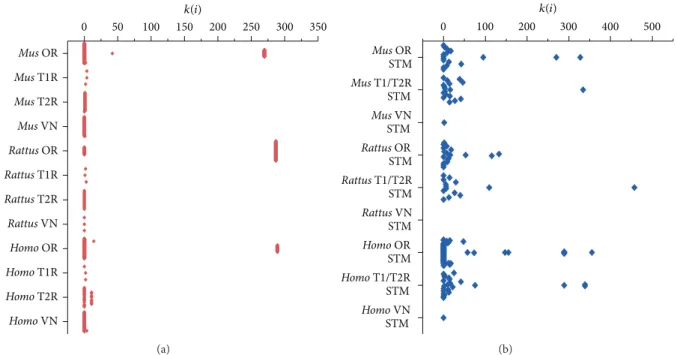
Next, we have compared the network topologies of each CR family and their STM. We have observed that most CR genes are functionally less connected than their STM. Most CR genes are connected only to their respective G proteins, indicating that they are located in the periphery of their functional networks (Figures 3and 4). his assumption is further supported by analyzing the Shannon diversity of the connectivity and clusterization indexes. We have found that the STM has higher diversity values for these indexes
(� < 0.05), suggesting that they occupy a broader range of
niches in their network. Exceptions to this are some olfactory receptors, which presented higher connectivity and clusteri-zation values among each other.
3.2. Diferences among the Diferent Chemosensory Families.
We have compared the EPI of the diferent CR families with themselves in order to identify diferences in their orthologs
EPI Receptors STM Mu s OR Mu s T1R Mu s T2R Mu s VN Ho m o OR Ho m o T1R Ho m o T2R Ho m o VN Ra tt u s OR Ra tt u s T1R Ra tt u s T2R Ra tt u s VN 0.0 0.2 0.4 0.6 0.8 1.0 ∗∗ ∗∗ ∗∗ ∗∗ ∗∗ ∗∗ ∗∗ ∗∗ ∗ ∗ ∗
Figure 2: Mean EPI values of chemoreceptors families (red) and their respective signal transducing machineries (blue). Plasticity values are shown in the vertical axis and the diferent subgroups are listed on the horizontal axis. Whiskers represent the standard deviation. Statistically signiicant data are indicated by double (� <
0.001) and single (� < 0.05) asterisks.
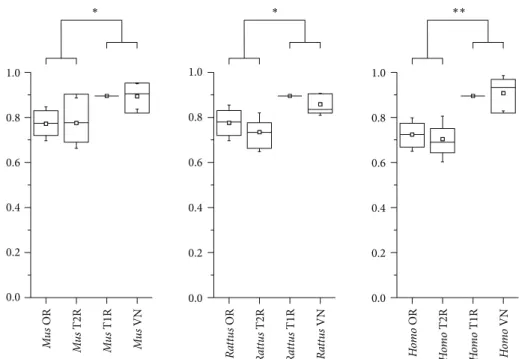
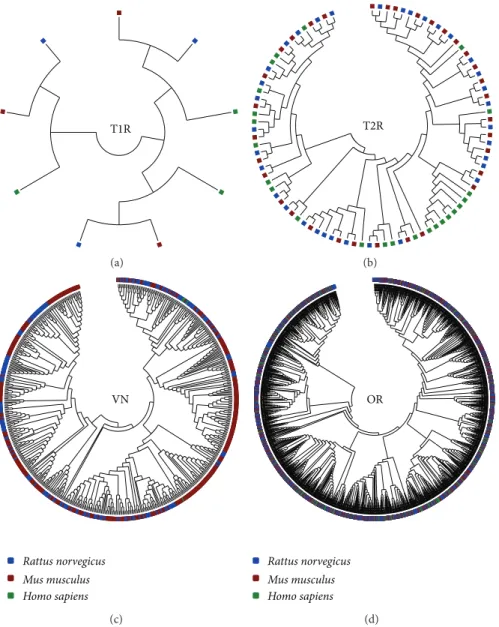
distribution. Due to lack of data regarding the V1R and V2R, we have considered these genes as a single group in our analysis (VN). Strikingly, we have observed that CR families can be sorted in two groups regarding their plasticity. he OR and T2R have signiicantly lower plasticity than the T1R and VN in the three mammals we have studied, indicating that they had evolved under diferent constraints in these species (Figure 5). To further assess these diferences, we have reconstructed the phylogenetic relationships among each CR family. We have observed that the OR, T1, and T2 genes form branches preferentially with their orthologs in other species, whereas the VN genes branches with their inparalogs (Figure 6). hese results are further supported by calculating the Shannon diversity index stepwise for each CR tree. We have found that the VN tree had signiicantly lower diversity values (� < 10−16) than the other CR, suggesting that the VN genes are less conserved than the other CR. he original trees with bootstrap replications conidence values can be found in the Supplementary Material.
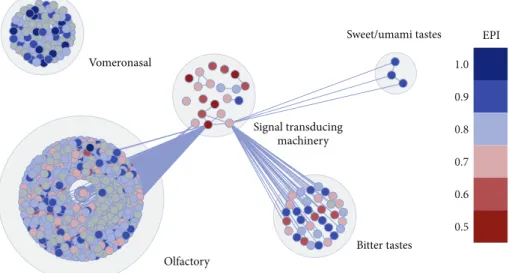
3.3. he Functional Organization of the CR Genes Network.
Finally, we have reconstructed the CR genes network in order to visualize its functional organization. We can observe that even though they form completely separate functional clusters, all the CR families, with the exception of VN, share the same STM cluster (Figure 7). his indicates that the STM machinery is essentially the same in every CR cell type.
4. Discussion
Mus OR
Mus T2R
Mus T1R
Mus VN
Rattus OR
Rattus T2R
Rattus T1R
Rattus VN
Homo OR
Homo T2R
Homo T1R
Homo VN
0 50 100 150 200 250 300 350
k(i)
(a)
Mus OR
STM
Mus T1/T2R STM
Mus VN
STM
Rattus OR
STM
Rattus T1/T2R
STM
Rattus VN
STM
Homo OR
STM
Homo T1/T2R STM
Homo VN
STM
0 100 200 300 400 500
k(i)
(b)
Figure 3: Connectivity values distribution for the chemoreceptors families (red) and their respective signal transducing machineries (blue). Values are shown in the vertical axis and the diferent subgroups are listed in the horizontal axis.
Mus OR
Mus T2R
Mus T1R
Mus VN
Rattus OR
Rattus T2R
Rattus T1R
Rattus VN
Homo OR
Homo T2R
Homo T1R
Homo VN
0.0 0.2 0.4 0.6 0.8 1.0
c(i)
(a)
Mus OR
STM
Mus T1/T2R STM
Mus VN
STM
Rattus OR
STM
Rattus T1/T2R
STM
Rattus VN
STM
Homo OR
STM
Homo T1/T2R STM
Homo VN
STM
0.0 0.2 0.4 0.6 0.8 1.0
c(i)
(b)
Figure 4: Clusterization values distribution for the chemoreceptors families (red) and their respective signal transducing machineries (blue). Values are shown in the vertical axis and the diferent subgroups are listed in the horizontal axis.
subject to radical changes in very short time windows. For instance, some plants are able to change their repertory of toxic secondary compounds in just a few generations [30], forcing herbivorous species that can potentially ingest these compounds to keep equally updated their ability for detecting these toxins. From an evolutionary point of view, this means that the genes coding these receptors must have a more
relaxed behavior in order to accommodate novelties in the environment.
1.0 0.8 0.6 0.4 0.2 0.0 1.0 0.8 0.6 0.4 0.2 0.0 1.0 0.8 0.6 0.4 0.2 0.0 EPI Mu s OR Mu s T2R Mu s T1R Mu s VN Ra tt u s OR Ra tt u s T2R Ra tt u s T1R Ra tt u s VN Ho m o OR Ho m o T2R Ho m o T1R Ho m o VN ∗ ∗ ∗∗
Figure 5: Mean EPI values of chemoreceptors families. Plasticity values are shown in the vertical axis and the diferent families are listed on the horizontal axis. he line at the center of each box indicates the median, the square represents the mean, and whiskers represent the standard deviation. Statistically signiicant data are indicated by double (� < 0.001) and single (� < 0.05) asterisks.
while the receptors themselves were free to experiment with the environment. By analyzing the network topology of the CR and STM, we have observed that CR occupy a peripheral position in their functional network. It has been proposed that proteins located in the periphery of their respective functional networks have elevated propensity to duplicate and undergo positive selection [31,32]. his happens because poorly connected and loose clusters are able to more ei-ciently accommodate evolutionary novelties such as gene duplications, deletions, and changes of function, and thus they become the “evolutionary motors” of their biological networks [33–35]. D’Antonio and Ciccarelli have recently demonstrated evidences supporting this assertion [36]. In their paper, these authors have thoroughly analyzed network properties, sequences, and orthology data fromE. coli, yeast, ly, and human. hey observed that genes acquired during evolution encode less connected and less central proteins that are subject to more duplication events. Conversely, it has been observed in other types of signal transducing cascades that the receptors are more constrained than the intermediate elements of their networks [37–40]. hese studies, however, were made with pathways such as those of insulin/TOR, which integrate information from inside the organism. As corporeal composition remained relatively the same through-out vertebrate evolution, intra- and extracellular components are not subject to radical variation, making necessary that internal signal transducing cascades must be more tightly constrained in order to consistently maintain their behavior. he environment, however, is constantly subject to changes, and the chemoreceptors cannot be too tightly constrained in
order to accommodate these luctuations. Our data support that CR are a special case of signal transducing pathways that have loosely constrained receptors.
T1R
(a)
T2R
(b)
VN
Rattus norvegicus Mus musculus Homo sapiens
(c)
OR
Rattus norvegicus Mus musculus Homo sapiens
(d)
Figure 6: Reconstructed phylogenetic tree of the chemoreceptor families. Each square represents a CR gene. Blue, red, and green squares representRattus norvegicus,Mus musculus, andHomo sapiensgenes, respectively. Phylogenetic trees were reconstructed with Tamura-Nei model. T1R: type I taste receptors; T2R: type II taste receptors; VN: vomeronasal receptors.
immune compatibility [43,44]. hese characteristics, albeit very important to long term adaptation and survival of the species as a whole, are not a major issue in direct survival of the individual.
An apparent contradiction in our analysis was the case of the T1R, which code sweet andumamireceptors. From our phylogenetic analysis, these receptors are tightly constrained. All three species have the same number of these receptors, each branching more closely with its orthologs in other species rather than the others of the same species. his inding is supported by an earlier analysis that found the same pattern in all vertebrate species [45]. However, by their ortholog dis-tribution, we have found high EPI values. hese receptors are grouped in the KOG1056 group, which encompasses 1790 proteins in 52 species, with most varied functions (e.g., bride of sevenless, a homeotic gene). he high-plasticity values
of T1R family are owed to the comprehensive reach of this orthologous group, suggesting that these receptors are con-strained members of a larger and more dynamic family of proteins. Albeit instigating, these assumptions can only be conirmed with further in-depth study of this interesting orthologous group.
Olfactory
Bitter tastes Sweet/umami tastes
Vomeronasal
Signal transducing machinery
1.0
0.9
0.8
0.7
0.6
0.5
EPI
Figure 7: Graphical representation ofMus musculuschemosensory network. EPI values are plotted on each node by a color scale. Higher plasticity is indicated by bluish colors and lower plasticity by reddish colors. he other networks are not shown in this paper. Nodes represent protein coding genes and edges, functional interactions.
deviation may be the reason why these receptors are under diferent evolutionary constraints.
Our results suggest that genes coding chemoreceptors were subject to more variation in the course of evolution than those coding signal transducing machinery, relecting their distinct functional roles in organisms. We have also found signiicant variation even among the diferent receptor modalities, suggesting, for the irst time to our notice, that olfactory and bitter taste receptors are, albeit less constrained than the transduction machinery, more conserved than vomeronasal receptors. hese diferences are due to the distinct ecological roles played by the receptors, with the low-plasticity olfactory and bitter taste receptors taking major part in direct survival of the organism, whereas high-plasticity vomeronasal receptors contribute to overall adaptation of the species. Sweet/umamireceptors cannot be analyzed by their orthologous distribution alone due to the large variability of their ortholog group, and further studies are needed in order to understand the selective pressures imposed on them. We believe that the chemoreceptor networks case is illustrative to demonstrate the generation of novelties through evolutionary tinkering. During the course of evolution, the chemosensory cells generated novel receptor clusters probably by dupli-cating older ones in order to perceive diferent sensory inputs. Even among these clusters, there is a great deal of evolutionary experimentation, so that the organisms can be kept up to date with their environment. he signal transduc-tion machinery and other informatransduc-tion pathways, however, remained essentially the same throughout generations.
Conflict of Interests
he authors declare that there is no conlict of interests regarding the publication of this paper.
References
[1] E. Adler, M. A. Hoon, K. L. Mueller, J. Chandrashekar, N. J. P. Ryba, and C. S. Zuker, “A novel family of mammalian taste receptors,”Cell, vol. 100, no. 6, pp. 693–702, 2000.
[2] G. Nelson, M. A. Hoon, J. Chandrashekar, Y. Zhang, N. J. P. Ryba, and C. S. Zuker, “Mammalian sweet taste receptors,”Cell, vol. 106, no. 3, pp. 381–390, 2001.
[3] I. Rodriguez, K. Del Punta, A. Rothman, T. Ishii, and P. Mombaerts, “Multiple new and isolated families within the mouse superfamily of V1r vomeronasal receptors,”Nature
Neu-roscience, vol. 5, no. 2, pp. 134–140, 2002.
[4] J. M. Young, M. Kambere, B. J. Trask, and R. P. Lane, “Divergent V1R repertoires in ive species: ampliication in rodents, deci-mation in primates, and a surprisingly small repertoire in dogs,”
Genome Research, vol. 15, no. 4, pp. 231–240, 2005.
[5] Y. Hashiguchi and M. Nishida, “Evolution of trace amine-associated receptor (TAAR) gene family in vertebrates: Lineage-speciic expansions and degradations of a second class of verte-brate chemosensory receptors expressed in the olfactory epithe-lium,”Molecular Biology and Evolution, vol. 24, no. 9, pp. 2099– 2107, 2007.
[6] L. Buck and R. Axel, “A novel multigene family may encode odorant receptors: A molecular basis for odor recognition,”Cell, vol. 65, no. 1, pp. 175–187, 1991.
[7] J. M. Young, H. F. Massa, L. Hsu, and B. J. Trask, “Extreme variability among mammalian V1R gene families,” Genome
Research, vol. 20, no. 1, pp. 10–18, 2010.
[8] P. Shi and J. Zhang, “Extraordinary diversity of chemosensory receptor gene repertoires among vertebrates,”Results and
Prob-lems in Cell Diferentiation, vol. 47, pp. 1–23, 2009.
[9] Y. Niimura, “Evolutionary dynamics of olfactory receptor genes in chordates: interaction between environments and genomic contents,”Human genomics, vol. 4, no. 2, pp. 107–118, 2009. [10] M. Nei, Y. Niimura, and M. Nozawa, “he evolution of animal
necessity,”Nature Reviews Genetics, vol. 9, no. 12, pp. 951–963, 2008.
[11] Y. Niimura and M. Nei, “Evolutionary dynamics of olfactory and other chemosensory receptor genes in vertebrates,”Journal
of Human Genetics, vol. 51, no. 6, pp. 505–517, 2006.
[12] J. M. Eir´ın-L´opez, L. Rebordinos, A. P. Rooney, and J. Rozas, “he birth-and-death evolution of multigene families revisited,”
Genome Dynamics, vol. 7, pp. 170–196, 2012.
[13] D. Dong, G. He, S. Zhang, and Z. Zhang, “Evolution of olfactory receptor genes in primates dominated by birth-and-death process,”Genome Biology and Evolution, vol. 1, pp. 258–264, 2009.
[14] Y. Niimura, “Evolutionary dynamics of olfactory receptor genes in chordates: interaction between environments and genomic contents,”Human genomics, vol. 4, no. 2, pp. 107–118, 2009. [15] M. Ashburner, C. A. Ball, J. A. Blake et al., “Gene ontology: tool
for the uniication of biology,”Nature Genetics, vol. 25, no. 1, pp. 25–29, 2000.
[16] L. J. Jensen, M. Kuhn, M. Stark et al., “STRING 8—A global view on proteins and their functional interactions in 630 organisms,”
Nucleic Acids Research, vol. 37, no. 1, pp. D412–D416, 2009.
[17] R. L. Seal, S. M. Gordon, M. J. Lush, M. W. Wright, and E. A. Bruford, “Genenames.org: he HGNC resources in 2011,”
Nucleic Acids Research, vol. 39, no. 1, pp. D514–D519, 2011.
[18] J. A. Blake, C. J. Bult, J. A. Kadin, J. E. Richardson, and J. T. Eppig, “he mouse genome database (MGD): Premier model organism resource for mammalian genomics and genetics,”Nucleic Acids
Research, vol. 39, no. 1, pp. D842–D848, 2011.
[19] M. R. Dwinell, E. A. Worthey, M. Shimoyama et al., “he rat genome database 2009: variation, ontologies and pathways,”
Nucleic Acids Research, vol. 37, no. 1, pp. D744–D749, 2009.
[20] S. Haider, B. Ballester, D. Smedley, J. Zhang, P. Rice, and A. Kasprzyk, “BioMart central portal: uniied access to biological data,”Nucleic Acids Research, vol. 37, no. 2, pp. W23–W27, 2009. [21] R. J. S. Dalmolin, M. A. A. Castro, J. L. Rybarczyk Filho, L. H. T. Souza, R. M. C. de Almeida, and J. C. F. Moreira, “Evolutionary plasticity determination by orthologous groups distribution,”
Biology Direct, vol. 6, article 22, 2011.
[22] M. A. A. Castro, X. Wang, M. N. C. Fletcher, K. B. Meyer, and F. Markowetz, “RedeR: R/Bioconductor package for representing modular structures, nested networks and multiple levels of hierarchical associations,”Genome Biology, vol. 13, article R29, 2012.
[23] D. Dong, K. Jin, X. Wu, and Y. Zhong, “CRDB: Database of chemosensory receptor gene families in vertebrate,”PLoS ONE, vol. 7, no. 2, Article ID e31540, 2012.
[24] K. Tamura, D. Peterson, N. Peterson, G. Stecher, M. Nei, and S. Kumar, “MEGA5: Molecular evolutionary genetics analysis using maximum likelihood, evolutionary distance, and max-imum parsimony methods,”Molecular Biology and Evolution, vol. 28, no. 10, pp. 2731–2739, 2011.
[25] R. C. Edgar, “MUSCLE: multiple sequence alignment with high accuracy and high throughput,”Nucleic Acids Research, vol. 32, no. 5, pp. 1792–1797, 2004.
[26] R. C. Edgar, “MUSCLE: a multiple sequence alignment method with reduced time and space complexity,”BMC Bioinformatics, vol. 5, article 113, 2004.
[27] K. Tamura and M. Nei, “Estimation of the number of nucleotide substitutions in the control region of mitochondrial DNA in humans and chimpanzees,”Molecular Biology and Evolution, vol. 10, no. 3, pp. 512–526, 1993.
[28] W. T. Swaney and E. B. Keverne, “he evolution of pheromonal communication,”Behavioural Brain Research, vol. 200, no. 2, pp. 239–247, 2009.
[29] B. Nilius and G. Owsianik, “he transient receptor potential family of ion channels,”Genome Biology, vol. 12, no. 3, article 218, 2011.
[30] T. Hartmann, “From waste products to ecochemicals: ity years research of plant secondary metabolism,”Phytochemistry, vol. 68, no. 22-24, pp. 2831–2846, 2007.
[31] P. M. Kim, J. O. Korbel, and M. B. Gerstein, “Positive selection at the protein network periphery: Evaluation in terms of structural constraints and cellular context,”Proceedings of the National
Academy of Sciences of the United States of America, vol. 104, no.
51, pp. 20274–20279, 2007.
[32] T. Yamada and P. Bork, “Evolution of biomolecular net-works lessons from metabolic and protein interactions,”Nature
Reviews Molecular Cell Biology, vol. 10, no. 11, pp. 791–803, 2009.
[33] X. Zhu, M. Gerstein, and M. Snyder, “Getting connected: Anal-ysis and principles of biological networks,”Genes and Develop-ment, vol. 21, no. 9, pp. 1010–1024, 2007.
[34] R. Albert, “Scale-free networks in cell biology,”Journal of Cell
Science, vol. 118, no. 21, pp. 4947–4957, 2005.
[35] Y. I. Wolfa, P. S. Novichkovb, G. P. Kareva, E. V. Koonina, and D. J. Lipmana, “he universal distribution of evolutionary rates of genes and distinct characteristics of eukaryotic genes of diferent apparent ages,”Proceedings of the National Academy of
Sciences of the United States of America, vol. 106, no. 18, pp. 7273–
7280, 2009.
[36] M. D’Antonio and F. D. Ciccarelli, “Modiication of gene dupli-cability during the evolution of protein interaction network,”
PLoS Computational Biology, vol. 7, no. 4, Article ID e1002029,
2011.
[37] D. Alvarez-Ponce, M. Aguad´e, and J. Rozas, “Network-level molecular evolutionary analysis of the insulin/TOR signal transduction pathway across 12 Drosophila genomes,”Genome
Research, vol. 19, no. 2, pp. 234–242, 2009.
[38] X. Wu, X. Chi, P. Wang, D. Zheng, R. Ding, and Y. Li, “he evo-lutionary rate variation among genes of HOG-signaling path-way in yeast genomes,”Biology Direct, vol. 5, article 46, 2010. [39] R. Jovelin and P. C. Phillips, “Expression level drives the pattern
of selective constraints along the insulin/tor signal transduction pathway in caenorhabditis,”Genome Biology and Evolution, vol. 3, no. 1, pp. 715–722, 2011.
[40] D. Alvarez-Ponce, M. Aguad´e, and J. Rozas, “Comparative genomics of the vertebrate insulin/TOR signal transduction pathway: A network-level analysis of selective pressures,”
Genome Biology and Evolution, vol. 3, no. 1, pp. 87–101, 2011.
[41] W. E. Grus and J. Zhang, “Distinct evolutionary patterns between chemoreceptors of 2 vertebrate olfactory systems and the diferential tuning hypothesis,”Molecular Biology and
Evo-lution, vol. 25, no. 8, pp. 1593–1601, 2008.
[42] J. I. Glendinning, “Is the bitter rejection response always adaptive?”Physiology and Behavior, vol. 56, no. 6, pp. 1217–1227, 1994.
[43] P. A. Brennan and K. M. Kendrick, “Mammalian social odours: Attraction and individual recognition,”Philosophical
Transac-tions of the Royal Society B: Biological Sciences, vol. 361, no. 1476,
pp. 2061–2078, 2006.
Submit your manuscripts at
http://www.hindawi.com
Hindawi Publishing Corporation
http://www.hindawi.com Volume 2014
Anatomy
Research International
Peptides
Hindawi Publishing Corporation
http://www.hindawi.com Volume 2014
Hindawi Publishing Corporation http://www.hindawi.com
International Journal of
Volume 2014
Zoology
Hindawi Publishing Corporation
http://www.hindawi.com Volume 2014
Molecular Biology International
Genomics
International Journal of
Hindawi Publishing Corporation
http://www.hindawi.com Volume 2014
The Scientiic
World Journal
Hindawi Publishing Corporationhttp://www.hindawi.com Volume 2014
Hindawi Publishing Corporation
http://www.hindawi.com Volume 2014
Bioinformatics
Advances inMarine Biology
Journal of Hindawi Publishing Corporationhttp://www.hindawi.com Volume 2014
Hindawi Publishing Corporation
http://www.hindawi.com Volume 2014
Signal Transduction
Journal ofHindawi Publishing Corporation
http://www.hindawi.com Volume 2014
BioMed
Research International
Evolutionary Biology International Journal of
Hindawi Publishing Corporation
http://www.hindawi.com Volume 2014
Hindawi Publishing Corporation
http://www.hindawi.com Volume 2014 Biochemistry Research International
Archaea
Hindawi Publishing Corporation
http://www.hindawi.com Volume 2014
Hindawi Publishing Corporation
http://www.hindawi.com Volume 2014 Genetics
Research International
Hindawi Publishing Corporation
http://www.hindawi.com Volume 2014
Advances in
Virology
Hindawi Publishing Corporation http://www.hindawi.com
Nucleic Acids
Journal ofVolume 2014
Stem Cells
International
Hindawi Publishing Corporation
http://www.hindawi.com Volume 2014
Hindawi Publishing Corporation
http://www.hindawi.com Volume 2014
Enzyme
Research
Hindawi Publishing Corporation
http://www.hindawi.com Volume 2014