PANOECONOMICUS, 2015, Vol. 62, Issue 5, pp. 643-661
Received: 05 March 2014; Accepted: 19 August 2015.
UDC 330.357:330.32(4-12) (4-191.2) DOI: 10.2298/PAN1505643P Original scientific paper
Monica Pop Silaghi
Department of Economics, Faculty of Economics and Business Administration,
Babeș-Bolyai University, Romania
Diana Alexa
Faculty of Economics and Business Administration,
West University of Timișoara, Romania
Acknowledgement: An earlier version of this paper was presented at European Economics and Finance Society (EEFS) 2012 conference in Istanbul. Both, the content and the title have been significantly revised. We thank the participants of EEFS 2012, prof. Xavier Galiegue and anonymous referees for their useful comments. We also thank prof. Vincent Daly for comments and grammar corrections. The usual disclaimer applies. We carried the work for the final version of this paper under the auspices of the grant for young researchers financed by Babeș-Bolyai University, GTC_34036.
Sources of Growth: Evidence from
Ten Central and Eastern European
Countries during 1993-2008
Summary: This paper carries out a growth accounting exercise for the 10 Central and Eastern European (CEE) countries that are part of the European Union over the period 1993-2008. We estimate the capital share (α) from a Cobb-Douglas production function in an intensive form, by employing panel data techniques. The Hausman and Chi-Square tests indicate that a Cross-Section Random Effects with Period Fixed Effects model best suits our data. Based on this model, we find a capital share between 0.45 and 0.83, higher than the usual 0.3-0.4 used in growth accounting literature. When we take into consideration the quality of labour force the estimated capital share slightly decreases, but still remains high, in a range between 0.39 and 0.79. Our growth accounting results reveal that, on average, capital per worker accumu-lation is the main engine of growth in CEE, followed by the contribution of total factor productivity (TFP). However, when dividing by sub-periods, we found that the contribution of TFP cannot be neglected since during 1997-2004 it proved to be the main engine of growth in some CEE countries (Czech Repub-lic, Slovakia, Hungary, Lithuania and Romania). Some policy implications are offered based on our results.
Key words:Growth accounting, TFP, Estimating capital share, Panel data, CEE.
JEL: O47, O57.
The aim of the present paper is to empirically estimate the capital share α from the Cobb-Douglas production function for Central and Eastern European (CEE) coun-tries during 1993-2008. The starting year is chosen so as not to encompass the earli-est year after the fall of the communism when TFP may have been higher for some countries. The ending year was chosen so as to eliminate the years of the severe crisis that affected these countries.
644 Monica Pop Silaghi and Diana Alexa
In explaining the growth determinants, Kosta Josifidis, Radmila Dragutinović Mitrović, and Olgica Ivančev (2012) focus on financial, trade and economic integra-tion among the Western Balkan and Emerging European economies in the period 1997-2009. Their findings suggest that EU membership benefits to the emerging economies compared with the Western Balkan economies, especially through an im-portant determinant such as foreign direct investments. This growth heterogeneity becomes more obvious when the analysis is carried out during the global instability.
We use the United Nations Conference on Trade and Development (UNCTAD 2014)1 data for the 10 CEE countries that are members of the EU for the period 1993-2008, with the exception of Latvia for which data is available starting from 1997, and we apply panel data estimation techniques for obtaining α, so as to take advantage of both the time and the cross-sectional dimension of our data. We expect that our estimated capital share will be higher than the conventional a-priori meas-ures of 0.3-0.4. To avoid an overestimated value of α when not considering human capital, we introduce a proxy for this variable in our estimation. By relying on our own estimates of α, we carry out a growth accounting exercise. For both, estimating
α and computing the growth decomposition, we employ a Cobb-Douglas production function in an intensive form. In this way, we shed a light on the growth process of these countries from this perspective and we offer some policy implications regard-ing the future actions that should be taken in this respect.
This paper is organised as follows: Section 1 reviews the related works on growth accounting for CEE, Section 2 explains the growth accounting methodology issues and the data, Section 3 describes the empirical methodology and presents the results for estimated α, Section 4 discusses the results of the growth decomposition, while Section 5 concludes and offers some policy implications.
1. Literature Review on CEE
Growth accounting exercises have been conducted for many transition economies from CEE, especially by institutions like International Monetary Fund (IMF) or Eu-ropean Central Bank. The growth process is often analysed in relation to these coun-tries’ accession to the European Union and the convergence process towards the liv-ing standards in EU.
In a study of IMF, Peter Doyle, Louis Kuijs, and Guorong Jiang (2001) ana-lyse the growth process in CEE-5 (Poland, the Czech Republic, Slovakia, Hungary and Slovenia), during 1989-1999. Assuming capital weights of 0.35, they discover that, during 1991-1999, capital accumulation was the main engine of growth in Czech Republic, Poland and Slovakia, while TFP had a major contribution in Hun-gary and Slovenia. Labour had a negative contribution in almost all CEE-5, except Slovak Republic. They conclude that the most rapidly growing countries exhibit growth that is intensive in TFP rather than in factor inputs, while the slower ones present the reverse tendency.
1United Nations Conference on Trade and Development.
645
Sources of Growth: Evidence from Ten Central and Eastern European Countries during 1993-2008
Schadler et al. (2006) study the growth of the 8 CEE that were member states of the EU at that time: the Czech Republic, Estonia, Hungary, Latvia, Lithuania, Pol-and, Slovakia and Slovenia. They compare the sources of growth in CEE-8 and other emerging economies, during 1990-2004 and find that CEE countries stand out from other developing countries by having small contributions from labour and remarkable contributions from TFP. Also, a two-speed catch-up process – rapid in the Baltics and slower in CEE-5 can be depicted, with the Baltics having larger contributions from TFP than the rest of the CEE.
Marco Neuhaus (2006) also performs growth accounting exercises for Hun-gary, Poland and the Czech Republic, for the period 1992-2001 and compares the results with those obtained for EU-12, Germany and US. He includes different prox-ies for labour – employment and number of hours worked – and different specifica-tions – breaking down the effect of labour into the effect of population growth and other changes and computing the relative contribution of each factor to economic growth. The analysis revealed that capital and TFP were the main engines of growth for the three transition countries – with TFP having a bigger relative contribution. Also, all three analysed countries experienced a strong decline in the contribution of labour, compared to the industrialised countries.
Garbis Iradian (2007) looks at the growth process mainly in the CIS countries, taking also into consideration the growth in 3 Baltic countries, 5 Central European countries, 6 Southeast European countries, over the period 1991-2006. Unlike the previous mentioned studies, Iradian (2007) estimates the input shares for these transi-tion economies, by using econometric techniques (Fixed Effects and Two Stage Least Squares). The growth accounting decomposition reveals that, using the esti-mated input shares, capital accumulation proves to be the main engine of growth.
Ryszard Rapacki and Mariusz Prochniak (2009) perform a detailed analysis of the growth path in 27 transition economies from the CEE and the Commonwealth of Independent States (CIS), during 1990-2003, carrying out also a growth accounting exercise for the selected countries. By assuming a share of physical capital of 0.3-0.4 and a labour contribution of 0.6-0.7, they reach the conclusion that TFP is the most important engine of growth. The fastest TFP growth in CEE is achieved in the Baltic States, while from the other transition economies Turkmenistan, Serbia and Monte-negro have the highest TFP growth rates.
646 Monica Pop Silaghi and Diana Alexa
both western and socialist countries. However, since the growth of human and physi-cal capital were lower in the socialist countries, so was the growth of per capita GDP. Akos Dombi (2013) considers that the post-socialist period of the CEEC can be divided into 3 periods: transformation period (1990-1994), robust growth and catching-up (1995-2007) and the crisis period (post 2008). By looking at the volatili-ty of the growth rates after 1995, Dombi (2013) finds two groups within CEEC: a group characterised by a high dispersion of the growth rates (Baltic states, Romania and Bulgaria) – that meant miraculously high growth rates before 2007 and also sharp decline after 2008, and a group with a more stable GDP growth characterised by smaller negative growth rates (Czech, Slovakia, Hungary, Poland and Slovenia). By applying a growth accounting methods on the last two periods, results point out that capital accumulation was the main source of growth, while labor and multifactor productivity had marginal contributions. By using a development accounting exercise having Germany as the benchmark, the results point out that although growth in GDP per hour in CEEC is much slower, there is a potential to catch-up, but the “sluggish” GDP levels as opposed to other western countries can be blamed on lower capital intensities. As capital accumulation was driven mainly from FDI - with savings rates being smaller than investment rates - and this left CEEC exposed to external shocks. As a consequence, CEEC were hit by the financial crisis more than other western countries and found it difficult to find a recovery path.
Katarzyna A. Baran (2013) tries to find the main determinants of growth in CEEC-4 (Hungary, Poland, Slovakia, Czech Republic) during 1995-2010 by apply-ing two methods: Solow growth accountapply-ing approach and a non-parametric (produc-tion-frontier) approach that enables the further decomposition of changes in TFP into changes in efficiency of production and technological changes. The growth account-ing approach points out that while in Czech Republic and Slovak Republic TFP and capital accumulation seem to have relatively equal contribution to growth, in Hun-gary capital accumulation was the main source of growth, while in Poland TFP ac-counted for 70% of total growth. The further quadripartite decomposition reveals that the productivity growth was driven mainly by efficiency improvements (technologi-cal catch-up) and by human capital accumulation in the CEEC-4, rather than tech-nological change or physical capital accumulation.
Our paper tries to make a contribution to the current related literature, firstly by estimating the capital share instead of considering it an a-priori measure and se-condly by employing an intensive form of the production function which accounts also for human capital. In this way, results and policy implications could offer a dif-ferent perspective.
2. Growth Accounting and Data Issues
Growth accounting exercise, pioneered by Robert Solow (1957), explains the main sources of growth, by decomposing output growth into the accumulation of inputs (labour and capital) and a residual measure that captures the efficiency of these in-puts, called Total Factor Productivity (TFP).
647
Sources of Growth: Evidence from Ten Central and Eastern European Countries during 1993-2008
and on the assumption of constant returns to scale. This is a strong assumption; how-ever, it may be a useful one for the purpose of the present study for CEE countries.
Our estimations are based on the standard aggregate production function (in the intensive form), under the assumption of Hicks-neutral technological efficiency, as in other related empirical works (see for example Aamer S. Abu-Qarn and Sulei-man Abu-Bader 2009).
The production function has the following form:
= , , (1)
where: represents the aggregate output at time t, represents the stock of capital at time t, represents the overall employment at time t, represents TFP, which captures a series of factors that affect productivity, such as technology levels, human capital, management and institutional factors, but also geographical or cultural fac-tors. Being a residual, when estimated, it also contains measurement errors or biases due to methodological assumptions.
The general equation of the growth accounting exercise is:
= + 1 − + , (2)
where: , , , denote the derivatives of the considered variables (Y, K, L, A) with respect to time, , , , are the growth rates of the considered variables, α and (1-α) are the shares of capital and labour in total income, following the assumptions of competitive markets and constant returns to scale.
Equation (1) can be written in an intensive form, in terms of growth per unit of labour. In this case, the intensive form of the growth accounting formula is:
= + , (3)
where = , = denote the aggregate output and stock of capital per worker. In order to apply the growth accounting formula (3) to the CEE countries, one needs to obtain data on the growth rates of GDP and capital per worker and to choose an appropriate measure for α.
Data on GDP and employment for the 10 CEE countries are taken from UN-CTAD and International Labour Organisation (ILO 2014)2. Obtaining the capital stock is one of the main challenges of a growth accounting exercise, since such data for transition or developing economies is hard to find.
There is no evidence of a capital stock database for the all 10 CEE countries, so we have constructed it ourselves, using the Perpetual Inventory Method (PIM). This methodology is widely used in the literature (see for example Vikram Nehru and Ashok Dhareshwar 1993). The PIM methodology uses the investment series and depreciation to construct the capital stock and it is based on the following equation:
2International Labour Organisation.
648 Monica Pop Silaghi and Diana Alexa
= 1 − + , (4)
where: is capital stock at time t, is investment at time t, δ is the depreciation rate of the capital stock.
As a proxy for investment, we used the Gross Fixed Capital Formation series, taken from UNCTAD and considered different depreciation rates (4%, 5% and 6%). Nehru and Dhareshwar (1993) use a 4% depreciation rate for all countries in their estimations for the World Bank, while Ishaq M. Nadiri and Ignar R. Prucha (1997) find a 5.9% depreciation rate for the physical capital after performing calibrations on US manufacturing sector. However, recent studies have considered a 5% deprecia-tion rate for developing and transideprecia-tion economies (see Abdelhak Senhadji 2000; Ira-dian 2007; Moisa Altar, Ciprian Necula, and Gabriel Bobeica 2010).
When using PIM, the initial capital stock is needed. There are various ap-proaches how to construct the initial stock of capital (Arnold Harberger 1978; Walter G. Park 1995; Raphael Bergoeing et al. 2002), all of them making assumptions about the growth rate of the capital stock or about the relationship between capital and out-put. We used the approach by Harberger (1978), which is widely used in the litera-ture. Harberger’s method is based on the assumption that the economy is in the steady state so the capital increases by the same growth rate as the output, over the given period. Therefore, incorporating this assumption in the PIM equation (4), we will get the expression for the initial stock of capital:
= / + , (5)
where: g is the growth rate of capital, is equal to the growth rate of output, over the studied period, is the initial stock of capital, is the investment in the first pe-riod.
Since we use an intensive form of the production function for our growth ac-counting exercise, we are interested in determining only one of the factor shares, namely the capital share α.
649
Sources of Growth: Evidence from Ten Central and Eastern European Countries during 1993-2008
As a third method, some studies estimate the input shares from the Cobb-Douglas production function in a log-linear form. Usually these studies find capital shares that are higher than 0.35, also in the case of developed countries. Our study is comparable with studies from this category, it considers the Cobb-Douglas produc-tion funcproduc-tion in an intensive form:
= + ∙ + . (6)
Rather than considering a-priori values or measuring just the share of the la-bour input, we estimate the input shares from an intensive form of a Cobb-Douglas production function. The production function in an intensive form incorporates both the effect of labour and capital leading to share estimates that are closer to reality.
3. Empirical Methodology and Results
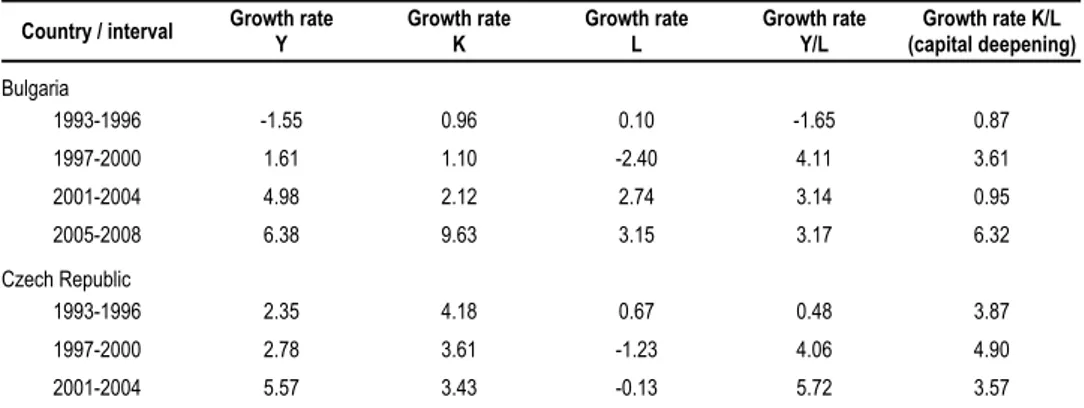
Before carrying out any estimation, it is worthwhile to describe the stylized facts re-garding the data of the considered sample. After the initial shock at the beginning of the 1990s, the CEE countries start their recovery (Table 1). For the period 1993-1996 only two of them report negative growth rates (Lithuania -4.68% and Bulgaria -1.50%) while some of them experience impressive output growth (Slovakia: 6.33%, Poland: 5.56%) On the other hand, the overall employment (L) starts to drop, for some countries continuing to decrease late in the 1990s and even in 2000. With the exception of Slovenia, all countries report periods of a drop in L, some of them (Es-tonia, Hungary, Lithuania and Romania) having to deal with negative average growth rates for the period 1993-2008. As a result of the increase in output and a drop in employment, the production per worker goes up, reaching average growth values as high as 9.10% in Estonia or 8.28% in Lithuania during 1997-2000. Also the capital deepening process is intensified, stimulated also by the growth of investments, which leads to important increases in the capital stock. With the labour production factor generally decreasing, it is clear that growth process may be driven by a mixture of capital deepening and the remaining residual Total Factor Productivity (TFP). In this paper, we intend to determine the contribution of each of them to the output growth in CEE by starting from a Cobb-Douglas production function.
Table 1 GDP, Employment and Capital Deepening Growth in CEE, during 1993-2008
Country / interval Growth rate
Y
Growth rate K
Growth rate L
Growth rate Y/L
Growth rate K/L (capital deepening)
Bulgaria
1993-1996 -1.55 0.96 0.10 -1.65 0.87
1997-2000 1.61 1.10 -2.40 4.11 3.61
2001-2004 4.98 2.12 2.74 3.14 0.95
2005-2008 6.38 9.63 3.15 3.17 6.32
Czech Republic
1993-1996 2.35 4.18 0.67 0.48 3.87
1997-2000 2.78 3.61 -1.23 4.06 4.90
650 Monica Pop Silaghi and Diana Alexa
2005-2008 1.72 4.03 1.53 0.19 2.46
Estonia
1993-1996 0.64 4.34 -5.00 5.93 9.89
1997-2000 7.03 7.07 -1.93 9.10 9.20
2001-2004 6.74 9.26 0.99 5.69 8.19
2005-2008 5.69 10.58 2.49 3.09 7.91
Hungary
1993-1996 1.34 2.26 -2.75 4.24 5.21
1997-2000 3.66 3.16 1.40 2.23 1.74
2001-2004 4.22 3.74 0.29 3.92 3.44
2005-2008 2.22 3.56 -0.13 2.35 3.71
Latvia
1993-1996 n.a. n.a. n.a. n.a. n.a.
1997-2000 5.63 8.41 -0.16 5.85 8.70
2001-2004 7.76 10.09 1.98 5.68 7.96
2005-2008 6.90 12.32 2.53 4.22 9.55
Lithuania
1993-1996 -4.58 0.63 -1.07 4.97 1.53
1997-2000 4.32 2.78 -3.62 8.28 6.66
2001-2004 7.80 3.89 0.72 7.09 3.21
2005-2008 7.08 7.21 1.44 5.55 5.71
Poland
1993-1996 5.56 5.65 0.18 5.98 5.88
1997-2000 5.21 9.10 -0.72 6.02 9.95
2001-2004 2.97 5.01 -1.27 4.29 6.39
2005-2008 5.44 6.13 3.45 1.92 2.59
Romania
1993-1996 3.95 4.51 0.12 5.05 4.90
1997-2000 -1.23 3.76 -0.39 -0.83 4.18
2001-2004 6.12 4.69 -0.46 6.61 5.17
2005-2008 6.42 9.00 0.58 5.81 8.38
Slovakia
1993-1996 6.33 4.57 2.69 3.61 2.07
1997-2000 2.88 5.37 -1.41 4.34 6.88
2001-2004 4.47 3.50 0.81 3.64 2.68
2005-2008 7.85 4.83 2.91 4.81 1.87
Slovenia
1993-1996 3.98 5.31 1.30 3.05 4.42
1997-2000 4.52 7.43 0.46 4.06 6.97
2001-2004 3.49 6.58 0.13 2.10 6.47
2005-2008 5.28 6.22 2.42 3.73 3.75
Notes: Capital Stock computed using PIM, with 5% depreciation rate.
651
Sources of Growth: Evidence from Ten Central and Eastern European Countries during 1993-2008
The intensive form of the production function reduces heteroskedasticity and eliminates multicolinearity that might exist between K and L. Using panel data tech-niques, we assume that the CEE share common production technologies, so that the same Cobb-Douglas production function holds for all countries. By exploring both the time and cross-section dimension of the data we gain more observations, there-fore increasing the degrees of freedom and reducing collinearity among explanatory variables. We can control for heterogeneity across individuals.
Our estimated Cobb-Douglas production function is a two-way error compo-nent model, where, besides the individual effects, we will also test for any time spe-cific effects:
, = + ∙ , + + + , , (7)
where - apart from the variables already mentioned - we have: represents the un-observable individual effect, represents the unobservable time effects,
, represents the remainderstochastic disturbance term, with , ~ IID(0, ).
We also use the human capital augmented model, as it is known that α tends to be overestimated in the absence of human capital (Gregory N. Mankiw, David Ro-mer, and David N. Weil 1992):
, = + ∙ , + + + , , (8)
where: HC is the human capital variable, proxied by the average years of schooling from the Robert Barro and Jong-Wha Lee (2010) database; LHC is the human capital augmented labour and it is computed by multiplying the general employment (L) with the years of schooling (HC); Y/LHC, K/LHC represent the output (capital) per skill-augmented worker.
For the human capital variable, since the data is available at 5 years’ interval, we employed interpolation to build the annual series. This may not be problematic since in these countries, no drastic events have happened so as to disturb this varia-ble. However, we ran the estimations also for 5 years averages data, although our sample, in this case, is quite small.
We will estimate each of the Equations (7) and (8) in three different ways. First, we estimate them by using individual fixed effects (FE), which assumes that is fixed for each individual, representing each country’s time invariant specif-ic effects. This model implies that the fixed effects are correlated with the regressors.
Second, we estimate them by assuming individual random effects (RE). In this way, is assumed to be random, so the loss of degrees of freedom from the FE model can be avoided (Badi H. Baltagi 2008, p.17). Also, this implies that the indi-vidual effects are no longer correlated with the regressors.
652 Monica Pop Silaghi and Diana Alexa
Third, after choosing between FE and RE models, we have also tested whether time fixed effects are present. Due to their proximity, their economic relations and the fact that there are all members of the EU, it is very possible for unexpected events or yearly variations to have an effect on the output across all 10 CEE. We test if the time effects bring new information to the model or if they are unnecessary, by using a Chi-Square redundancy test. The redundancy test for the time fixed effects checks whether the time effects are redundant or they add new information to our regression.
For the RE models, we have also reported θ, used to partially demean/quasi-demean the data, as it is known that the RE model can also be estimated inside the OLS framework using quasi-demeaned data:
− = − + − ), (9)
where: θ represents the quasi-demeaning factor and takes values between 0 and 1. The extreme values represent special cases: if θ = 0 the estimated model will be OLS and if θ = 1 we will estimate FE. The θ factor also gives a hint whether the model is closer to OLS or to FE.
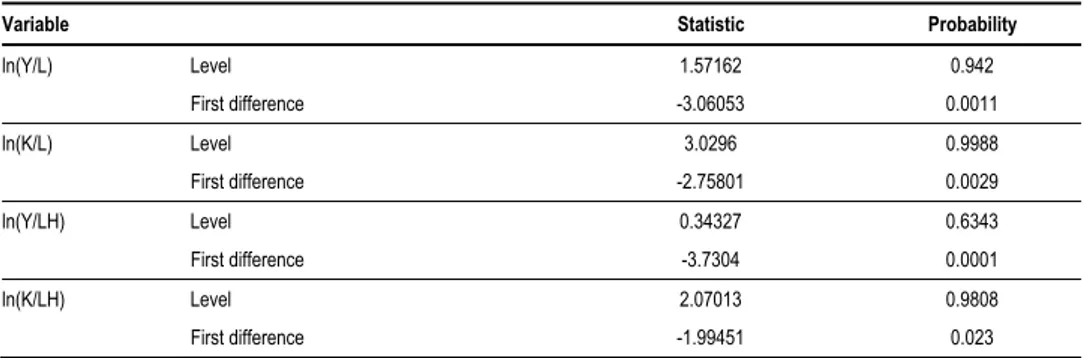
Before proceeding with our estimations, we have also performed Unit Root Tests, as the FE and RE models are suitable for stationary variables. We have per-formed by the test by Kyung S. Im, Hashem Pesaran, and Yongcheol Shin (2003), (IPS test), which has the null hypothesis that all individuals follow a unit root process. It controls for heterogeneous coefficients, allowing each individual to have its own unit root process.
Table 2 IPS (2003) Panel Unit Root Test Results
Variable Statistic Probability
ln(Y/L) Level 1.57162 0.942
First difference -3.06053 0.0011
ln(K/L) Level 3.0296 0.9988
First difference -2.75801 0.0029
ln(Y/LH) Level 0.34327 0.6343
First difference -3.7304 0.0001
ln(K/LH) Level 2.07013 0.9808
First difference -1.99451 0.023
Source: Own results based on UNCTAD (2014) and ILO (2014) data.
As it can be seen from Table 2, all variables present unit root in levels, but they become stationary after they are first differenced. Therefore we will use the first differences of the variables when estimating Equations (7) and (8).
653
Sources of Growth: Evidence from Ten Central and Eastern European Countries during 1993-2008
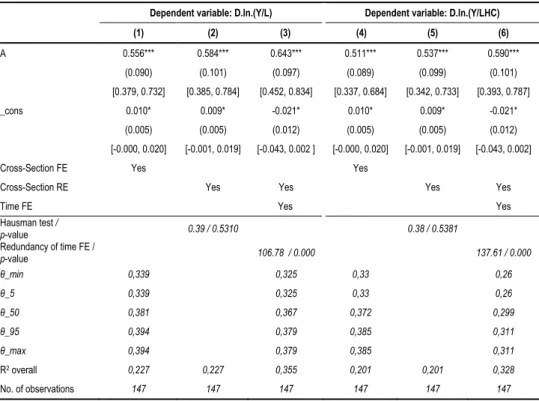
As it can be seen, the RE specification is preferred to the FE specification in both models. The p-values of the Hausman test are much greater than 0.05, therefore the null cannot be rejected. This shows that the individual characteristics are not cor-related with the regressors and they may have an effect on our dependent variable. The fact that the individual effects are not correlated with the regressors allows us to potentially include these effects in our regression and test their impact on the output. From this point of view, the RE leaves open the possibility that the individual charac-teristics of CEE may have an effect on our dependent variable (growth). The time fixed effects are also present and they are jointly significant, as we reject the hypo-thesis of redundant time fixed effects. The time fixed effects represent the unob-served factors that affect the output and are common to all CEE countries in a given year, but they vary within time. We can say that they represent the variation over time of the overall TFP. Therefore, the Hausman and Chi-Square tests indicate that the most suitable model is the Cross-Section RE, Time FE, in columns (3) and (6). If we look at θ, when considering the Cross Section Random and Time Fixed Effects model - columns (3) and (6), we can see that it takes values between 0.325-0.379 and 0.26-0.311, proving that our model is closer to the pooled OLS than to the FE model. Given the fact that our panel is unbalanced, the distribution of θ is reported instead of a single value, as it would be the case with a balanced panel.
Looking at the estimated α and its corresponding 95% confidence interval, it can be seen that it lies between 0.452 and 0.834 in column (3) and it is significant at a 1% level. The α coefficient slightly decreases when human capital is included in the estimation, being comprised between 0.393 and 0.78 (column (6)). Our findings support the fact that, in the developing countries of CEE, the share of capital seems to be higher than the a-priori values of 0.3-0.4 used in the literature. Also, we con-firm the theory that the omission of human capital from the production function leads to an overestimation of the physical capital share. Results in the same range are ob-tained when reconsidering the depreciation rate from 5% to 4%/6% or when using 5 years averages. Tables with results can be provided upon requests. In this latter case, we are in line with the empirical studies that use 3 or 5 years averages to mitigate the effect of business cycles and we also avoid the interpolation of the HC variable. By using time dummies, we tried to mitigate the effect of the business cycles. However, by using 5 years averages, our sample becomes quite small, thus boosting larger con-fidence interval and making the limits of this interval unreliable.
654 Monica Pop Silaghi and Diana Alexa
Table 3 Estimation of the Cobb-Douglas Production Function in an Intensive Form
Dependent variable: D.ln.(Y/L) Dependent variable: D.ln.(Y/LHC)
(1) (2) (3) (4) (5) (6)
Α 0.556*** 0.584*** 0.643*** 0.511*** 0.537*** 0.590***
(0.090) (0.101) (0.097) (0.089) (0.099) (0.101)
[0.379, 0.732] [0.385, 0.784] [0.452, 0.834] [0.337, 0.684] [0.342, 0.733] [0.393, 0.787]
_cons 0.010* 0.009* -0.021* 0.010* 0.009* -0.021*
(0.005) (0.005) (0.012) (0.005) (0.005) (0.012)
[-0.000, 0.020] [-0.001, 0.019] [-0.043, 0.002 ] [-0.000, 0.020] [-0.001, 0.019] [-0.043, 0.002]
Cross-Section FE Yes Yes
Cross-Section RE Yes Yes Yes Yes
Time FE Yes Yes
Hausman test /
p-value 0.39 / 0.5310 0.38 / 0.5381
Redundancy of time FE /
p-value 106.78 / 0.000 137.61 / 0.000
θ_min 0,339 0,325 0,33 0,26
θ_5 0,339 0,325 0,33 0,26
θ_50 0,381 0,367 0,372 0,299
θ_95 0,394 0,379 0,385 0,311
θ_max 0,394 0,379 0,385 0,311
R2 overall 0,227 0,227 0,355 0,201 0,201 0,328
No. of observations 147 147 147 147 147 147
Notes: *, **, *** indicate significance at 1%, 5%, 10% significance levels. Standard errors are in parenthesis, 95%
confi-dence level estimates in brackets. The distribution of θ is presented, with the minimum and maximum possible value, to-gether with the 5, 50 and 95 percentiles.
Source: Own estimations based on UNCTAD (2014) and ILO (2014) data.
4. Growth Decomposition Findings
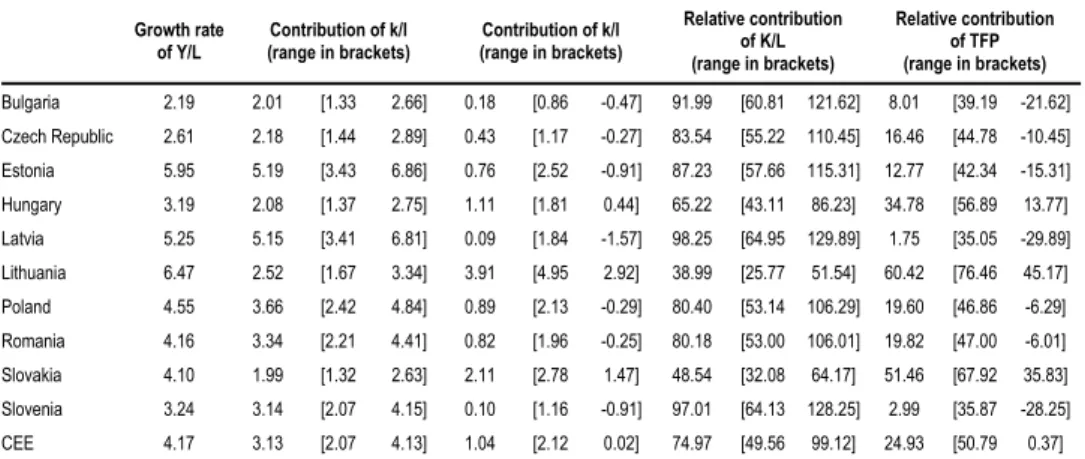
Table 4 presents the results of our growth accounting exercise over the period 1993-2008 in the CEE. The average growth rate of the GDP per worker in the mentioned period is decomposed into the contributions of capital per worker and TFP. We use the capital share α = 0.59 estimated in the human capital augmented model with Cross-Section RE and Time FE - Table 2, column (6) to compute the contribution of K/L and TFP. We also present the ranges that the contribution of K/L may have; as-suming that α is confined between the lower and the upper limits of the estimated 95% confidence interval. The relative contributions are also computed, as they allow us to better compare the impact of K/L and TFP among countries.
655
Sources of Growth: Evidence from Ten Central and Eastern European Countries during 1993-2008
and Romania. Only in 2 countries it can be said that TFP was the main engine of growth, namely in Lithuania and Slovakia, where the relative contribution of TFP was 60.42% and 51.46% respectively. Overall, if we look at the growth process of all 10 CEE countries taken together, it can be seen that the average impact of K/L was around 75%, while TFP is on average responsible for about a quarter of the region’s growth rate. When considering the lower limit of the confidence interval (α = 0.39), closer to the values used in literature, the relative contribution of TFP increases to 50.8%. Although in this case, we could say that at a regional level the TFP is respon-sible for roughly more than a half of the growth, at a country level the changes are not very drastic. Even if in some countries the overall relative contribution of TFP moves closer to 50% (Romania and Poland), only in one of them – Hungary the economy shifts to a TFP-growth-driven-process. Considering this scenario, however, the impact of capital accumulation still remains substantial. When α approaches the higher limit of 0.78, the contribution of TFP in most of the countries is negative, the growth process being exclusively driven by K/L. In this case, the capital deepening process, correlated with other factors seems to have generated a loss of efficiency which is reflected in TFP.
Table 4 Growth Accounting Exercise, Averages over the Period 1993-2008
Growth rate of Y/L
Contribution of k/l (range in brackets)
Contribution of k/l (range in brackets)
Relative contribution of K/L (range in brackets)
Relative contribution of TFP (range in brackets)
Bulgaria 2.19 2.01 [1.33 2.66] 0.18 [0.86 -0.47] 91.99 [60.81 121.62] 8.01 [39.19 -21.62] Czech Republic 2.61 2.18 [1.44 2.89] 0.43 [1.17 -0.27] 83.54 [55.22 110.45] 16.46 [44.78 -10.45] Estonia 5.95 5.19 [3.43 6.86] 0.76 [2.52 -0.91] 87.23 [57.66 115.31] 12.77 [42.34 -15.31] Hungary 3.19 2.08 [1.37 2.75] 1.11 [1.81 0.44] 65.22 [43.11 86.23] 34.78 [56.89 13.77] Latvia 5.25 5.15 [3.41 6.81] 0.09 [1.84 -1.57] 98.25 [64.95 129.89] 1.75 [35.05 -29.89] Lithuania 6.47 2.52 [1.67 3.34] 3.91 [4.95 2.92] 38.99 [25.77 51.54] 60.42 [76.46 45.17] Poland 4.55 3.66 [2.42 4.84] 0.89 [2.13 -0.29] 80.40 [53.14 106.29] 19.60 [46.86 -6.29] Romania 4.16 3.34 [2.21 4.41] 0.82 [1.96 -0.25] 80.18 [53.00 106.01] 19.82 [47.00 -6.01] Slovakia 4.10 1.99 [1.32 2.63] 2.11 [2.78 1.47] 48.54 [32.08 64.17] 51.46 [67.92 35.83] Slovenia 3.24 3.14 [2.07 4.15] 0.10 [1.16 -0.91] 97.01 [64.13 128.25] 2.99 [35.87 -28.25] CEE 4.17 3.13 [2.07 4.13] 1.04 [2.12 0.02] 74.97 [49.56 99.12] 24.93 [50.79 0.37]
Notes: Based on the estimates from Table 2, column (6), α= 0.59, ranges are calculated based on the limits of 95%,
CI = [0.39, 0.78].
Source: Own estimations based on UNCTAD (2014) and ILO (2014) data.
656 Monica Pop Silaghi and Diana Alexa
equation used: we employ an intensive form of the production function while other studies usually employ the extensive form. These studies also suggest, indirectly, an increase of the available physical resources per worker, (as K increases and L de-creases), in line with our findings. By using the capital deepening K/L (or capital intensity), we already capture an efficiency effect of the production factors in our K/L factor, therefore diminishing the contribution of TFP.
Our findings challenge the idea that the Baltic States had impressive TFP con-tributions. We find that only in Lithuania was TFP the main engine of growth, in Latvia and Estonia growth was triggered by capital per worker accumulation. The high TFP contributions in Latvia and Estonia found in other studies (Rapacki and Prochniak 2009) could be in fact efficiency gains caused by the capital deepening process, which due to the increase of capital available to one worker, can be trans-lated into labour productivity. We depicted that only in Lithuania can the high con-tribution of TFP be attributed to some other factors rather than the supposed efficien-cy gained by a capital deepening process.
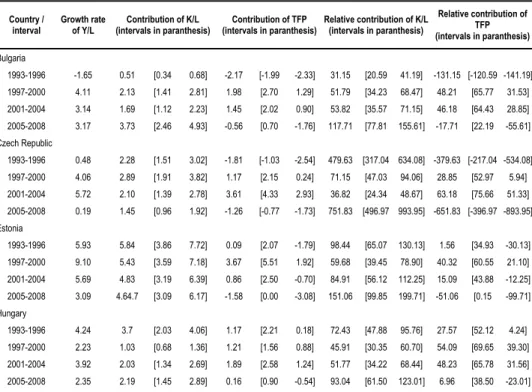
Table 5 presents the growth accounting exercise in CEE in 4-year intervals: 1993-1996, 1997-2000, 2001-2004, 2005-2008. Tables with the estimates of α for each interval can be provided upon request. Since the sample is small in each case, the obtained estimates may not be reliable for being used in the growth accounting exercise. However, they are situated within the limits of our obtained range (0.39-0.78).
Table 5 Growth Accounting Exercise in CEE over 4-Years Interval
Country / interval
Growth rate of Y/L
Contribution of K/L (intervals in paranthesis)
Contribution of TFP (intervals in paranthesis)
Relative contribution of K/L (intervals in paranthesis)
Relative contribution of TFP (intervals in paranthesis)
Bulgaria
1993-1996 -1.65 0.51 [0.34 0.68] -2.17 [-1.99 -2.33] 31.15 [20.59 41.19] -131.15 [-120.59 -141.19] 1997-2000 4.11 2.13 [1.41 2.81] 1.98 [2.70 1.29] 51.79 [34.23 68.47] 48.21 [65.77 31.53] 2001-2004 3.14 1.69 [1.12 2.23] 1.45 [2.02 0.90] 53.82 [35.57 71.15] 46.18 [64.43 28.85] 2005-2008 3.17 3.73 [2.46 4.93] -0.56 [0.70 -1.76] 117.71 [77.81 155.61] -17.71 [22.19 -55.61] Czech Republic
1993-1996 0.48 2.28 [1.51 3.02] -1.81 [-1.03 -2.54] 479.63 [317.04 634.08] -379.63 [-217.04 -534.08] 1997-2000 4.06 2.89 [1.91 3.82] 1.17 [2.15 0.24] 71.15 [47.03 94.06] 28.85 [52.97 5.94] 2001-2004 5.72 2.10 [1.39 2.78] 3.61 [4.33 2.93] 36.82 [24.34 48.67] 63.18 [75.66 51.33] 2005-2008 0.19 1.45 [0.96 1.92] -1.26 [-0.77 -1.73] 751.83 [496.97 993.95] -651.83 [-396.97 -893.95] Estonia
1993-1996 5.93 5.84 [3.86 7.72] 0.09 [2.07 -1.79] 98.44 [65.07 130.13] 1.56 [34.93 -30.13] 1997-2000 9.10 5.43 [3.59 7.18] 3.67 [5.51 1.92] 59.68 [39.45 78.90] 40.32 [60.55 21.10] 2001-2004 5.69 4.83 [3.19 6.39] 0.86 [2.50 -0.70] 84.91 [56.12 112.25] 15.09 [43.88 -12.25] 2005-2008 3.09 4.64.7 [3.09 6.17] -1.58 [0.00 -3.08] 151.06 [99.85 199.71] -51.06 [0.15 -99.71] Hungary
657
Sources of Growth: Evidence from Ten Central and Eastern European Countries during 1993-2008
Latvia
1993-1996 n.a. n.a. n.a. n.a. n.a. n.a. n.a. n.a. n.a. 1997-2000 5.85 5.13 [3.39 6.79] 0.71 [2.45 -0.94] 87.80 [58.03 116.07] 12.20 [41.97 -16.07] 2001-2004 5.68 4.70 [3.11 6.21] 0.98 [2.57 -0.54] 82.79 [54.73 109.45] 17.21 [45.27 -9.45] 2005-2008 4.22 5.63 [3.72 7.45] -1.42 [0.49 -3.23] 133.56 [88.28 176.57] -33.56 [11.72 -76.57] Lithuania
1993-1996 4.97 0.90 [0.60 1.21] 4.06 [4.37 3.76] 18.14 [11.99 24.29] 81.86 [88.01 75.71] 1997-2000 8.28 3.93 [2.60 5.26] 4.35 [5.68 3.02] 47.43 [31.35 63.50] 52.57 [68.65 36.50] 2001-2004 7.09 1.90 [1.25 2.54] 5.20 [5.84 4.55] 26.74 [17.68 35.81] 73.26 [82.32 64.19] 2005-2008 5.55 3.37 [2.23 4.51] 2.18 [3.32 1.04] 60.70 [40.12 81.27] 39.30 [59.88 18.73] Poland
1993-1996 5.98 3.47 [2.29 4.58] 2.52 [3.69 1.40] 57.95 [38.31 76.61] 42.05 [61.69 23.39] 1997-2000 6.02 5.87 [3.88 7.76] 0.14 [2.13 -1.75] 97.59 [64.51 129.02] 2.41 [35.49 -29.02] 2001-2004 4.29 3.77 [2.49 4.99] 0.52 [1.80 -0.69] 87.89 [58.10 116.20] 12.11 [41.90 -16.20] 2005-2008 1.92 1.53 [1.01 2.02] 0.39 [0.91 -0.10] 79.75 [52.72 105.43] 20.25 [47.28 -5.43] Romania
1993-1996 5.05 2.89 [1.91 3.82] 2.16 [3.14 1.23] 57.21 [37.82 75.64] 42.79 [62.18 24.36] 1997-2000 -0.83 2.46 [1.63 3.26] -3.29 [-2.46 -4.09] -297.79 [-196.84 -393.68] 397.79 [296.84 493.68] 2001-2004 6.61 3.05 [2.02 4.03] 3.56 [4.60 2.58] 46.13 [30.49 60.98] 53.87 [69.51 39.02] 2005-2008 5.81 4.95 [3.27 6.54] 0.87 [2.54 -0.73] 85.09 [56.24 112.49] 14.91 [43.76 -12.49] Slovakia
1993-1996 3.61 1.22 [0.81 1.61] 2.39 [2.81 2.00] 33.75 [22.31 44.62] 66.25 [77.69 55.38] 1997-2000 4.34 4.06 [2.68 5.36] 0.28 [1.66 -1.03] 93.53 [61.83 123.65] 6.47 [38.17 -23.65] 2001-2004 3.64 1.58 [1.04 2.09] 2.06 [2.60 1.55] 43.39 [28.68 57.36] 56.61 [71.32 42.64] 2005-2008 4.81 1.10 [0.73 1.46] 3.70 [4.08 3.35] 22.94 [15.17 30.33] 77.06 [84.83 69.67] Slovenia
1993-1996 3.05 2.61 [1.72 3.45] 0.45 [1.33 -0.39] 85.41 [56.45 112.91] 14.59 [43.55 -12.91] 1997-2000 4.06 4.11 [2.72 5.43] -0.05 [1.34 -1.37] 101.25 [66.93 133.86] -1.25 [33.07 -33.86] 2001-2004 2.10 2.83 [1.87 3.74] -0.72 [0.24 -1.63] 134.32 [88.79 177.58] -34.32 [11.21 -77.58] 2005-2008 3.73 3.01 [1.99 3.98] 0.71 [1.74 -0.26] 80.85 [53.44 106.89] 19.15 [46.56 -6.89] CEE
1993-1996 3.52 2.53 [1.67 3.35] 0.99 [1.84 0.17] 71.98 [47.58 95.21] 28.02 [52.42 4.79] 1997-2000 4.72 3.70 [2.45 4.90] 1.02 [2.27 -0.18] 78.44 [51.85 103.85] 21.56 [48.15 -3.85] 2001-2004 4.79 2.85 [1.88 3.77] 1.94 [2.91 1.02] 59.47 [39.31 78.69] 40.53 [60.69 21.31] 2005-2008 3.48 3.16 [2.09 4.19] 0.32 [1.39 -0.70] 90.80 [60.02 120.21] 9.20 [39.98 -20.21]
Notes: Based on the estimates from Table 2, column (6), α= 0.59, ranges are calculated based on the limits of 95%,
CI = [0.39, 0.78].
Source: Own estimations based on UNCTAD (2014) and ILO (2014) data.
This gives us a better understanding of the way that capital accumulation and TFP have affected the growth process during our period of study.
658 Monica Pop Silaghi and Diana Alexa
For example, in the intervals with the highest growth rates the main factor of growth proves to be TFP in 4 CEE: Czech Republic, Lithuania, Romania and Slova-kia. For these countries, the highest Y/L growth rate was achieved in the second in-terval of our study (1997-2000 Lithuania) or the third inin-terval (2001-2004 for Czech Republic and Romania), while Slovakia had the greatest growth rate during 2005-2008. During those intervals, the relative contribution of TFP varied between 52.57% in Lithuania and 77.06% in Slovakia. For the other 5 countries of our group, capital accumulation per worker was the main source of growth during the intervals with the highest growth rate. However, even in some of these countries, TFP proves to have substantial contributions to the highest growth rates, as it is the case in Bulgaria (48.21%), Estonia (40.32%) and Hungary (48.23%).
Looking at the evolution of the TFP contribution, we can distinguish some patterns in CEE. It can be seen that in some countries in the first interval of the study (1993-1996) TFP seems to have small contributions in Estonia, Latvia, Slovenia, even negative ones (in Bulgaria and Czech Republic). During 1997-2004, TFP proves to be an important source of growth, in some countries even more important than K/L accumulation, as is the case in Hungary in 1997-2000, Czech Republic and Slovakia during 2001-2004 and Lithuania and Romania during 1997-2004. In the last 4 years (2005-2008), in most of the countries, the relative contribution of TFP has dropped significantly (in Hungary, Lithuania, Romania), being even negative in some countries (Bulgaria, Czech Republic, Estonia, Latvia).
This pattern supports the view that the contribution of TFP to growth is based on the elimination of the inefficiencies rather than on technological progress and in-novation. The small or negative contributions from the beginning of the interval might show the presence of inefficiencies in the production process inherited from the centrally planned economy (especially present in Bulgaria, Czech Republic, Es-tonia, Hungary, Romania). The rise in the TFP contribution during 1997-2004 is a sign that these weaknesses are being eliminated and the economic reforms are start-ing to pay off, whereas the drop from 2005-2008 might suggest that, once this transi-tion process is completed, these countries must find other sources of maintaining high contributions from TFP, such as investments in human capital, in R&D, stimu-lating innovation etc.
5. Conclusions
In this paper, we carried out a growth accounting exercise for CEE countries by es-timating the share of capital per worker from a Cobb-Douglas production function. The main contribution of our paper is that we estimated the input share of capital, rather than using an a-priori measure of α. The choice of a random effects model with time fixed effects, based on empirical tests, proved to be the most suitable to the data. The capital share α in CEE lies between 0.45 and 0.83 and 0.78 which is in line with the theory that α tends to be higher when estimated using econometrics. Our findings also support the view that the capital shares are higher in developing coun-tries due to higher marginal products being expected.
659
Sources of Growth: Evidence from Ten Central and Eastern European Countries during 1993-2008
our growth accounting decomposition reveals that the main factor of growth in CEE during 1993-2008 was capital per worker accumulation and the labour productivity that stems from it. This is true for 8 out of 10 CEE, excluding Lithuania and Slova-kia. However, the contribution of TFP to growth cannot be neglected, especially dur-ing 1997-2004, when TFP proved to be the main engine of growth in most of the countries, leading to very high growth rates.
660 Monica Pop Silaghi and Diana Alexa
References
Abu-Qarn, Aamer S., and Suleiman Abu-Bader. 2007. “Sources of Growth Revisited:
Evidence from Selected MENA Countries.” World Development, 35(5): 752-771.
Abu-Qarn, Aamer S., and Suleiman Abu-Bader. 2009. “Getting Income Shares Right: A
Panel Data Investigation for Countries of the OECD.” Economic Development
Quarterly, 23(3): 254-266.
Altar, Moisa, Ciprian Necula, and Gabriel Bobeica. 2010. “Estimating Potential GDP for
the Romanian Economy. An Eclectic Approach.” Journal of Economic Forecasting,
0(3): 5-25.
Baltagi, Badi H. 2008. Econometric Analysis of Panel Data. 4th ed. Chichester: John Wiley
& Sons.
Baran, Katarzyna A. 2013. “The Determinants of Economic Growth in Hungary, Poland,
Slovakia and the Czech Republic during the Years 1995-2010.” Equilibrium,
Quarterly Journal of Economics and Economic Policy, 8(3): 7-26.
Barro, Robert, and Jong-Wha Lee. 2010. “A New Data Set of Educational Attainment in the World, 1950-2010.” National Bureau of Economic Research Working Paper 15902.
Bergoeing, Raphael, Patrick J. Kehoe, Timothy J. Kehoe, and Raimundo Soto. 2002. “A
Decade Lost and Found: Mexico and Chile in the 1980s.” Review of Economic
Dynamic, 5(1): 166-205.
Collins, Susan M., and Barry P. Bosworth. 1996. “Economic Growth in East Asia:
Accumulation versus Assimilation.” Brookings Papers on Economic Activity, 2:
135-191.
Dombi, Akos. 2013. “Economic Growth and Development in Central and Eastern Europe
after the Transformation.” Public Finance Quarterly, 58(4): 452-468.
Doyle, Peter, Louis Kuijs, and Guorong Jiang. 2001. “Real Convergence to EU Income Levels: Central Europe from 1990 to the Long Term.” International Monetary Fund Working Paper 01/146.
Gollin, Douglas. 2002. “Getting Income Shares Right.” Journal of Political Economy, 110(2):
458-474.
Harberger, Arnold. 1978. “Perspectives on Capital and Technology in Less Developed
Countries.” In Contemporary Economic Analysis, ed.M. J. Artis and R. A. Nobay,
42-72. London: Croom Helm.
Im, Kyung S., Hashem Pesaran, and Yongcheol Shin. 2003. “Testing for Unit Roots in
Heterogenous Panels.” Journal of Econometrics, 115(1): 53-74.
Iradian, Garbis. 2007. “Rapid Growth in Transition Economies: Growth-Accounting Approach.” International Monetary Fund Working Paper 07/64.
Josifidis, Kosta, Radmila Dragutinović Mitrović, and Olgica Ivančev. 2012.
“Heterogeneity of Growth in the West Balkans and Emerging Europe: A Dynamic
Panel Data Model Approach.” Panoeconomicus, 59(Special Issue): 157-183.
Mankiw, Gregory N., David Romer, and David N. Weil. 1992. “A Contribution to the
Empirics of Economic Growth.” Quarterly Journal of Economics, 107(2): 407-437.
661
Sources of Growth: Evidence from Ten Central and Eastern European Countries during 1993-2008
Nehru, Vikram, and Ashok Dhareshwar. 1993. “A New Database on Physical Capital
Stock: Sources, Methodology and Results.” Revista de Analisis Economico, 8(1):
37-59.
Neuhaus, Marco. 2006. The Impact of FDI on Economic Growth. Berlin: Springer-Verlag.
Park, Walter G. 1995. “International R&D Spillovers and OECD Economic Growth.”
Economic Inquiries, 33(4): 571-591.
Rapacki, Ryszard, and Mariusz Prochniak. 2009. “Economic Growth in Twenty-Seven
Transition Countries, 1990-2003.” Eastern European Economics, 47(2): 69-112.
Schadler, Susan, Ashoka Mody, Abdul Abiad, and Daniel Leigh. 2006. “Growth in the Central and Eastern European Countries of the European Union.” International Monetary Fund Occasional Paper 252.
Senhadji, Abdelhak. 2000. “Sources of Economic Growth: An Extensive Growth
Accounting Exercise.” International Monetary Fund Staff Papers, 47(1): 129-158.
Solow, Robert. 1957. “Technical Change and the Aggregate Production Function.” Review of
Economics and Statistics, 39(3): 312-320.
Van Leeuwena, Bas, and Peter Földvári. 2013. “Capital Accumulation and Growth in
662 Monica Pop Silaghi and Diana Alexa