Genomic Pathogen Typing Using Solid-State
Nanopores
Allison H. Squires1, Evrim Atas1, Amit Meller1,2*
1Department of Biomedical Engineering, Boston University, Boston, Massachusetts, 02215, United States of America,2Department of Biomedical Engineering, The Technion–Israel Institute of Technology, Haifa, 32000, Israel
Abstract
In clinical settings, rapid and accurate characterization of pathogens is essential for effec-tive treatment of patients; however, subtle genetic changes in pathogens which elude tradi-tional phenotypic typing may confer dangerous pathogenic properties such as toxicity, antibiotic resistance, or virulence. Existing options for molecular typing techniques charac-terize the critical genomic changes that distinguish harmful and benign strains, yet the well-established approaches, in particular those that rely on electrophoretic separation of nucleic acid fragments on a gel, have room for only incremental future improvements in speed, cost, and complexity. Solid-state nanopores are an emerging class of single-molecule sen-sors that can electrophoretically characterize charged biopolymers, and which offer signifi-cant advantages in terms of sample and reagent requirements, readout speed,
parallelization, and automation. We present here the first application of nanopores for sin-gle-molecule molecular typing using length based“fingerprints”of critical sites in bacterial genomes. This technique is highly adaptable for detection of different types of genetic varia-tion; as we illustrate using prototypical examples includingMycobacterium tuberculosis and methicillin-resistantStreptococcus aureus, the solid-state nanopore diagnostic plat-form may be used to detect large insertions or deletions, small insertions or deletions, and even single-nucleotide variations in bacterial DNA. We further show that Bayesian classifi-cation of test samples can provide highly confident pathogen typing results based on only a few tens of independent single-molecule events, making this method extremely sensitive and statistically robust.
Introduction
Subtle genetic changes in bacteria can produce large variations in factors affecting pathogenic-ity, such as toxicpathogenic-ity, antibiotic resistance, and virulence. These genetic variations are not only used to trace the epidemic and phylogenetic relationships among strains of bacteria, but are also critically important in clinical settings for proper patient diagnosis and treatment. Most existing approaches require sample incubation and growth over the course of multiple days prior to testing, and nearly all require expert handling of samples and interpretation of results.
OPEN ACCESS
Citation:Squires AH, Atas E, Meller A (2015) Genomic Pathogen Typing Using Solid-State Nanopores. PLoS ONE 10(11): e0142944. doi:10.1371/journal.pone.0142944
Editor:Niyaz Ahmed, University of Hyderabad, INDIA
Received:August 4, 2015
Accepted:October 28, 2015
Published:November 12, 2015
Copyright:© 2015 Squires et al. This is an open access article distributed under the terms of the Creative Commons Attribution License, which permits unrestricted use, distribution, and reproduction in any medium, provided the original author and source are credited.
Data Availability Statement:All relevant data are within the paper and its Supporting Information files.
Funding:This study was supported by the National Institutes of Health (NHGRI grant no. R01 HG-005871 and NIBIB R21 EB017377) and from the Israeli Centers of Research Excellence (I-CORE) program (Center #1902/12).
Traditional phenotypic typing techniques such as serotypes, biotypes, phage-types, and anti-biograms lack the necessary sensitivity to distinguish between closely related pathogen strains, and therefore fail to adequately capture these critical variations for clinical applications. Gel-based techniques such as restriction fragment length polymorphism (RFLP) or cleaved ampli-fied polymorphic sequences (CAPS) require a large amount of time and results are not easily compared or transferred among labs. Next-generation sequencing is an increasingly popular method of fully characterizing bacterial strains [1] and may be used for typing strains accord-ing to the sequences of a panel of housekeepaccord-ing genes, as in multi-locus sequence typaccord-ing (MLST) [2], but this approach is more commonly used to tracepost hocepidemic and phyloge-netic relationships among clinical isolates. Furthermore, the complexity and quantity of sequencing data far exceeds the minimum information required to efficiently and accurately diagnose a patient. For example, bioinformatics studies suggest that a panel of just 30–50 single nucleotide variations (SNVs) could be used to uniquely identify thousands of strains of Myco-bacterium tuberculosis [3,4]. Yet SNVs are not the only source of variation among pathogens; polymorphisms from SNVs and short indels up to genetic changes as large as whole plasmids or sets of genes may be responsible for critical changes to pathogenicity. Thus there exists a clear clinical need for a novel approach to molecular typing that can quickly and simply screen patient samples for a panel of widely varying known genetic polymorphisms of dangerous pathogens.
Solid-state nanopores may be used to discriminate the lengths of unlabeled individual bio-polymers such as DNA molecules across a wide range of lengths [5,6]. Biopolymers are electro-phoretically attracted and threaded through a voltage-biased nanoscale pore drilled in an ultrathin freestanding SiNxmembrane [7,8]. When a DNA molecule is threaded through a
nanopore, it partially blocks the flow of ions moving through the pore, allowing real-time detection of the analyte by monitoring changes in the ion current. Nanopore sensing is bio-chemically simple, as it does not require labeling of the analyte with radioactive or fluorescent probes, yet it can be used to detect minute quantities of nucleic acid molecules, surpassing the sensitivity of bulk methods [8]. Moreover, nanopore sensing involves relatively simple instru-mentation (primarily a current amplifier) and may be used to analyze thousands of molecules in just a few minutes, making this technique an ideal candidate for applications such as nucleic acid based diagnostics.
single, parallelizable device, could be extended to probe a large panel of critical sites within a genome for point-of-care determination of critical pathogenic properties and sequence typing.
Results and Discussion
Detection of DNA Sequence Polymorphisms in Solid-State Nanopores
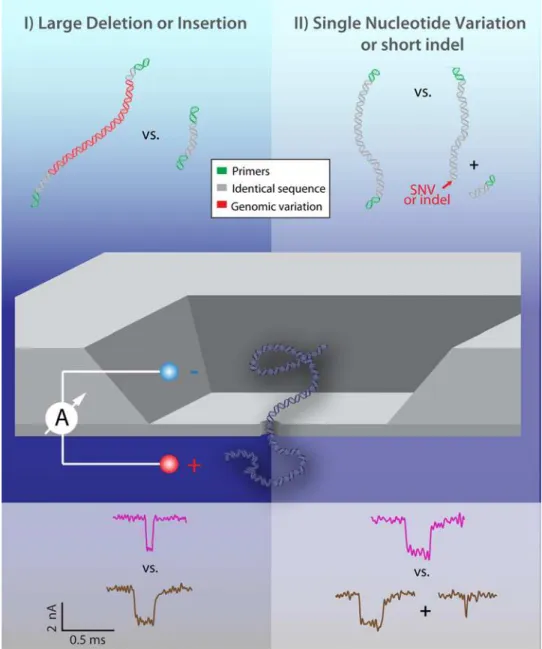
The simplest form of nanopore translocation analysis involves the measurement of the depth of each current blockade (ΔIB) and the dwell time of each molecule within the pore (tD). Both Fig 1. Two Principal Modes for Nanopore Discrimination of Pathogen Genomic Variation.Mode I: Direct length detection according to analyte translocation dwell time and depth enables discrimination of longer vs. shorter fragments; i.e: whether or not an insertion or deletion is present (left). Mode II: Prior to translocation, samples are exposed to a restriction enzyme that cuts at the site of a SNV or short indel or mutation. Detection of cleaved vs. uncleaved DNA fragments in the nanopore reveals whether or not the critical genomic variation is present.
parameters have been shown to grow nonlinearly with DNA length, forming the basis for frag-ment length separation in the nanopore system. The statistical distributions of these indepen-dently measured quantities may be used to distinguish between analytes of different lengths, such as DNAs [5,6,9], or proteins having identical molecular weight but slightly different charge or 3D structure [10–13]. Variation in the translocation dwell-time (tD) in solid-state nanopores measured for different DNA lengths (l), are empirically described by a power law: tD*lα
whereα= 1.38±0.02, which has been reproduced by multiple experimental approaches [5,9,14]. Using a log-scale distribution of translocation times to estimate the distribution of tD, note that the difference in log(tD) for two sequences (lengthsl0andl0+Δl) is more apparent
for shorter lengthl0as compared with the insertions and deletionsΔl(i.e. whenΔl/l0*1)
according toEq 1:
DlogðtDÞ alogð1þDl
l0Þ ð1Þ
If the presence of two fragment lengths must be identified from within a single sample, it is desirable that their distributions ofΔIBortDshould be as well-separated as possible. Further-more, if the presence of a cut sample must be distinguished from an uncut sample, then byEq 1the peak produced by the shorter part of a cut sample will appear farther away from the uncut peak than the longer part of a cut sample. To statistically distinguish the samples, it is desirable for the peak of the shorter part to be as dissimilar as possible from the uncut peak. Therefore, asymmetrically cut DNA pieces from a restriction digest are more readily distin-guished from the original uncut length than those produced by symmetrically positioned restriction sites, provided that the shorter piece is of sufficient length to be detected by the nanopore. In cases where separation between two similar length biopolymers (Δl/l0*1) is required, the measured histograms of eitherΔIBortDmay overlap significantly, making dis-crimination between these molecules difficult. Combinations of multiple fragment lengths within a sample pose additional challenges, as their more complicated distributions may over-lap or otherwise preclude simple contour cluster separation.
In the context of sequence typing, identification of fragments by sizing will indicate the presence of specific insertions and deletions that may enhance or reduce pathogenicity or oth-erwise uniquely identify a pathogenic strain. Upper bounds onΔlare set by: 1) sample prepara-tion parameters and limitaprepara-tions; for example, robust and fast PCR amplificaprepara-tion is most easily achieved for fragment lengths of ~102–103bp [15] and 2) nanopore stability considerations; for example, nanopores are more frequently clogged by very long DNA (>20 kbp). Lower bounds onl0are set by nanopore sensitivity; while several groups have demonstrated detection
of small DNA fragments (<50 bp) [16] we find that a minimuml0on the order of ~100 bp is
more reliable since it is readily detectable in small nanopores with no additional modifications [5], producing an extremely small fraction of missed events due to the finite system bandwidth. Thus a reasonable design range for sequence typing fragments is ~100 bp minimum length for l0, ranging up to a few thousand base pairs maximum length forl0+Δl. Many types of common
Using these design principles, we present here two alternative modes of detection that illus-trate the wide range of genomic variations that may be detected using a single sensor. For large insertions or deletions (Fig 1: Mode I, left panel), a nanopore may be used to discriminate the raw change in DNA length caused by the presence or absence of this sequence according to the duration of translocation events. For short indels, mutations, or single nucleotide variations (SNVs) (Fig 1: Mode II, right panel), which are more difficult to identify solely by length as dis-cussed above, we utilize a restriction enzyme. The sample is only cut in the presence (or absence) of the critical sequence, and subsequent detection in a nanopore reveals either one or two fragments in the nanopore according to the observed durations and blockage levels of translocation events.
Event Diagram Discrimination of Sample Length and Composition
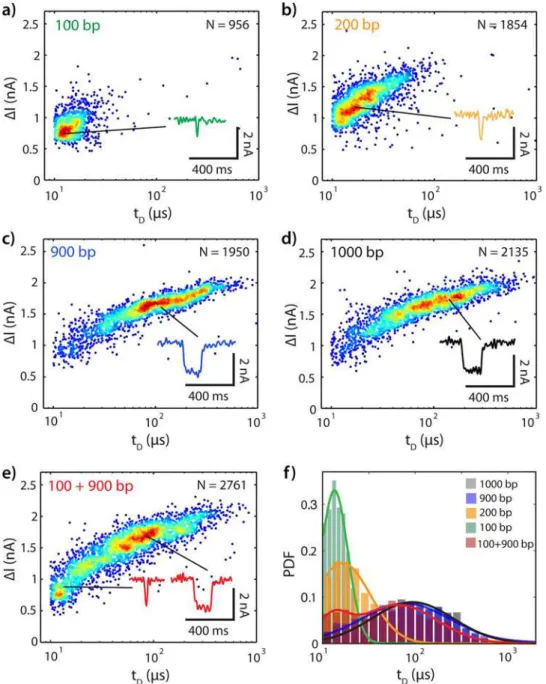
We first experimentally illustrate the practical length resolution of the nanopore platform for identifying sample length and composition. We analyzed samples containing mixtures of DNA fragments composed of one or two well-defined lengths. The resulting event diagrams create unique fingerprints that can be used to distinguish different lengths of DNA (Mode I) or whether or not a fragment of DNA has been cut (Mode II).Fig 2A–2Eshow event diagrams for 100 bp, 200 bp, 900 bp, 1000 bp, and 100+900 bp DNA in a single nanopore (diameter 4.8 nm, effective height 7 nm) at +300 mV bias (for additional examples, see Figs B-E inS1 File). Here, each translocation event is represented by its corresponding ion current event amplitude (ΔIB) and dwell time (tD). From comparison ofFig 2A and 2D, it is evident that insertions and dele-tionsΔlseveral times larger than the base length (here:Δl:l0= 9:1) are indeed easily distinguish-able (Fig C inS1 File). Comparison ofFig 2A and 2Billustrates thatΔl= 100 bp results in reasonably distinct event diagrams forl0= 100 bp, which may be distinguished to>95%
confi-dence with just a few events each, taking both dwell time and current amplitude into consider-ation (Fig D inS1 File). However, atl0= 900 bp a minimum of several hundred events are
required to confidently (>95%) differentiatel0(Fig 2C) froml0+Δl(1000 bp,Fig 2D), since
their event diagrams overlap significantly (Fig E inS1 File). Returning toEq 1, forΔl= 100 bp, we expectΔlog(tD) = 0.415 forl0= 100 bp, andΔlog(tD) = 0.063 forl0= 900 bp. For the data shown inFig 2F,Δlog(tD) = 0.1 forl0= 100 bp, andΔlog(tD) = 0.03 forl0= 900 bp. The inability to easily and quickly discriminate the 900 bp DNA from the 1000 bp DNA demonstrates the practical limits set on Mode I sample identification according to the size of the insertion or deletion that must be detected.
Fig 2Eillustrates how Mode II may overcome these limitations by digesting DNA into frag-ments: here, a highly asymmetric ratio of lengths in a mixed sample (100+900 bp) clearly facili-tates sample identification as compared to the full length 1000 bp DNA (Fig 2D). However, Mode II also presents a more challenging case for quantitative discrimination between an uncut and a cut sample. Whereas single-length samples can be identified using either theirtD orIBdistribution (as shown inFig 2F), the longer fragment in a cut sample may share signifi-cant overlap with the uncut sample. This is particularly true in the case of a highly asymmetric cut site.
Bayesian Statistical Treatment of Nanopore Data
samples, which must fall into one of two (or a few) known possible genetic variation classifica-tions at each relevant locus, we have developed a classification framework for nanopore sensing based upon Bayesian classification [19]. This approach enables surprisingly rapid identification of unknown samples, and more importantly, provides an estimate of the statistical confidence associated with these classifications.
Fig 2. Translocation Event Diagrams Uniquely Identify DNA Fragment Lengths in a Single Nanopore. (a) 100 bp at 1 nM. (b) 200 bp at 1 nM. (c) 900 bp at 1 nM. (d) 1000 bp at 1 nM. (e) 1:1 combination of 100 bp and 900 bp, total concentration 2 nM. (f) Semilog(x) distributions of translocation dwell times for all samples (a)-(e). Translocations for all samples were collected in a single nanopore (4.8 nm diameter, effective thickness ~7 nm) with a +300 mV bias relative totrans(open pore current: 13 nA). To facilitate visualization of population density, a random white noise offset below the acquisition rate of this data (-2μs<Δt<+2μs, acquisition rate 250 kHz) has been added to eachtD.
The event diagrams shown inFig 2may be modeled as probability density functionsZi
describing the likelihood of observing a translocation with depthIBand dwell timetD. Here, we find the maximum likelihood fit of a Gaussian Mixture Model (GMM) to the event diagram to describe each distribution as a sum of one or more two-dimensional covariant Gaussian proba-bility density functions (Eq 2).
pðθ
modeljZÞ ¼ X
k
wkgðθmodeljmk;SkÞ
where: gðθ
modeljmk;SkÞ ¼
1 2pðjS
kj 1=2
Þexp ðθ
model mkÞ 0
Sk 1
ðθ
model mkÞ
2
ð2Þ
Here,p(θmodel|Z) is the GMM for caseZfor the model data setθmodel(here: variablesIBandtD)
summed over allkcomponents,wkis the relative weighting of each component such that X
k
wk¼1,μkis the mean of each component, andSkis the covariance matrix of each
compo-nent. We then calculate the posterior likelihood,p(Zi|θ), that an unknown sample translocation
data set,θ, belongs to thea prioridistributionZiaccording to Bayes’rule (Eq 3):
pðZijθÞ ¼
pðθjZ
iÞ PðZiÞ X
j pðθjZ
jÞ PðZjÞ
ð3Þ
The“unknown”sample is then assigned to whicheverZiyields the higher posterior likeli-hood. The posterior likelihood also represents the expected accuracy of the resulting decision. Here, the prior probabilities are taken to be equal,P(Zi) = 0.5. In a clinical application, the prior probabilities may be adjusted to account for the known incidence of each possible case in the clinical population under consideration, and additional weighting factors may be included to bias the classifier and thereby avoid costly diagnostic errors.
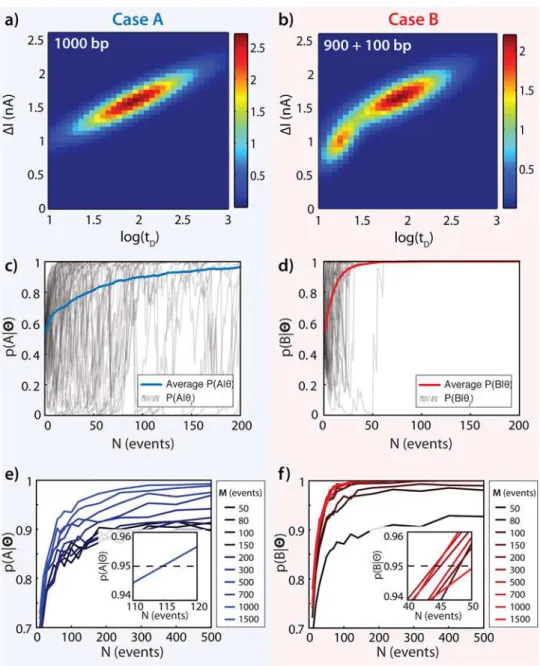
Fig 3illustrates the utility of this approach for discrimination between probability density functions with significant overlap, as would be the case for sensing Mode II (Fig 1).Fig 3A and 3Bshow the maximum-likelihood Gaussian Mixture Model fits to the event diagrams for enzy-matically“uncut”DNA and for“cut”DNA. The color temperature indicates the relative proba-bility density of the model at each location.Fig 3Ashows the GMM for 1000 bp DNA (Case A), which represents a whole fragment that does not contain the critical sequence for digestion by a particular restriction enzyme. This produces a single population on the Gaussian mixture model fit. InFig 3B, a 100+900 bp DNA equimolar mixture represents a restriction-digested sample that was originally 1000 bp long, with the critical digestion site located at 100 bp from one end of the DNA (Case B). This mixture shows two clear populations in the GMM, one matching the 100 bp event diagram fingerprint (Fig 2A), and one matching the 900 bp event diagram fingerprint (Fig 2C), which has significant overlap with the 1000 bp GMM inFig 3A. Notably, the GMM fit for this two-component sample is readily distinguishable from the full-length 1000 bp sample due to the clear peak at short timescales caused by the 100 bp fragment.
The confidence with which an unknown sample may be classified increases with the number of translocations collected,N.Fig 3C and 3Ddepict the posterior probabilitiesp(A|Θ) orp(B| Θ) forcorrectlyassigning an unknown sample to either caseA(uncut, 1000 bp) or caseB(cut,
average posterior probabilities for correctly identifying an A sample and a B sample, respec-tively, averaged over all 1000 simulation runs. These clearly highlight a general trend emerging from our data: a rapid increase in the probability forNof just a few tens of events from the unknown test sample, followed by a slow increase for larger values ofN.
Fig 3. Gaussian Mixture Models for Mode II Classification of 1000 bp vs. 900+100 bp DNA Fragments. (a) 2-D GMM for 1000 bp DNA fragment translocations. (b) 2-D GMM for 900+100 bp DNA fragment translocations. (c) Bayesian posterior estimatesp(A|Θ) of correctly identifying a data setΘas Case A, calculated for each increment ofNpoints inΘ, repeated 1000 times (first 50 shown in gray) and averaged (blue), each usingM= 1500 points in the model data set. (d) Bayesian posterior estimatesp(B|Θ) of correctly
identifying a data setΘas CaseB, calculated for each increment ofNpoints inΘ, repeated 1000 times (first
50 shown in gray) and averaged (red), all usingM= 1500 points in the model data set. (e) Bayesian posterior estimatesp(A|Θ) for test data sets ofNpoints given a model based on data set sizeM. Each point represents the average of 1000 separate bootstrap simulations. (f) Bayesian posterior estimatesp(A|Θ) for test data sets
ofNpoints given a model based on data set sizeM. Each point represents the average of 1000 separate bootstrap simulations. Insets: range ofNfor whichp(A|Θ) reaches 0.95. SeeMethodsandS1 Filefor complete numerical simulation details.
The rate of convergence and maximum confidence of the posterior probability curves shown inFig 3C and 3Dare also dependent upon the numberMof translocations used for fit-ting the GMM.Fig 3E and 3Fshow posterior probability curves forAandBfor a range of model data set sizes,M. It is clear that larger training sets are necessary to achieve high levels of confidence; in this case, if fewer than M = 700 samples make up the training sets, the confi-dence level of correctly identifying the cut fragments does not rise above 95%, even for rela-tively largeN= 500 translocations. However, the number of pointsMrequired in the model set varies widely depending upon the similarity of the distributions to be discriminated: for exam-ple, for the distributions shown inFig 4, only aboutM= 100 data points are necessary to exceed 95% confidence with onlyN= 50 test points (Fig G inS1 File). Insets show the number of translocation events required for each posterior probability to reach a 95% confidence thresh-old (N = 45 events and N = 115 events for identifying an A sample or a B sample, respectively). These curves allow quantitative determination of how many translocations from an unknown sample should be collected in order to verify the sample identity with any desired level of confi-dence for any pair or set of possible cases under consideration. Surprisingly, we find here that only a few tens of events are necessary to confidently classify an unknown cut or uncut sample. At typical nanopore collection rates (~1 event/second for ~1 nM DNA) less than a minute would be sufficient to obtain a confident result. Additionally, the curves shown inFig 3C–3F
illustrate that the limiting case (for this example) is actually the uncut sample; that is, more translocations from an unknown sample are required to confidently identify a sample asA (1000 bp) rather thanB(900+100 bp).
Pathogen Discrimination Sensitivity Down to Single-Nucleotide
Variations
We demonstrate here the highest sensitivity of our proposed analysis by discrimination of criti-cal single nucleotide variations in actual pathogen genomes, selected at sites that are known to alter pathogenicity. We selected two model pathogens with very different characteristic pheno-typic effects caused by a lone SNV:S.aureus, in which a SNV confers antibiotic resistance via theparCgene, andM.tuberculosis, in which a SNV affects virulence via themazGgene. The emergence of methicillin-resistantS.aureus(MRSA) strains in recent years has increased the incidence of severe nosocomial and community-acquired infections. The wide variation in antibiotic resistance across this set of pathogens necessitates either immediate treatment with broad-spectrum antibiotics that can perpetuate the evolution of resistant strains, or accurate but expensive and time-consuming pathogen characterization prior to treatment, or (often) both. MRSA exhibits a relatively high degree of genetic variation due in large part to frequent horizontal gene transfer [20]. Antibiotic resistance in strains of MRSA is often conferred by mobile genetic elements (MGEs), which are large insertions or deletions that can contain one or more whole genes from related bacteria or phages [21]. MRSA also exhibits frequent small mutations and indels [18]. In contrast,M.tuberculosis, the bacterium responsible for tubercu-losis (TB), exhibits relatively little genetic diversity among its various strains [22] but has rap-idly increasing incidence of antibiotic-resistant and hypervirulent strains.
avirulent (H37Ra) strains, which differ only in several key SNVs and indels [18]. This pair has been widely used as reference strains for studying virulence and pathogenesis ofM. tuberculo-sis, and H37Ra is even used to boost immunogenicity during TB immunization.
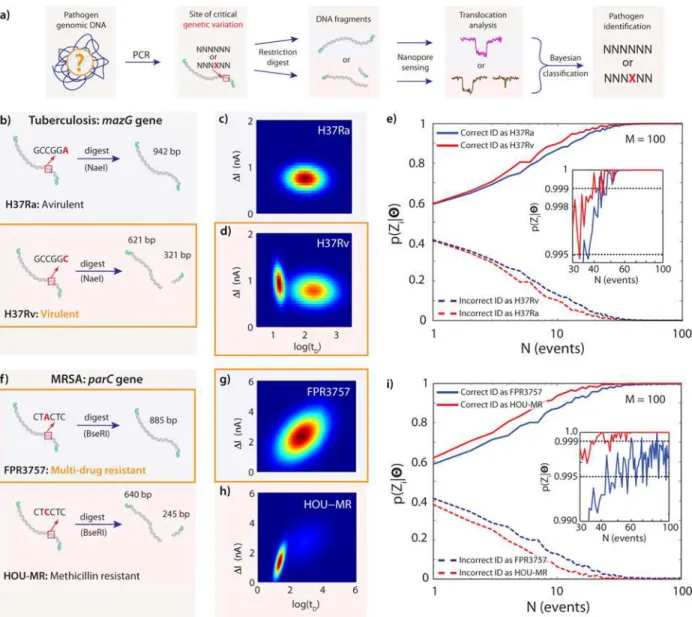
Fig 4Ashows the main steps of sample preparation required to amplify and digest each locus of interest from a pathogen sample. For each pathogen, we focused on specific genes where single nucleotide variations are significantly correlated with the pathogenicity of the Fig 4. Gaussian Mixture Models of DNA Fragments for Actual Mode II Pathogen Typing at the SNV Level.(a) Diagram of the main steps in sample preparation, detection, and classification: PCR fragments from isolated pathogens are subjected to a restriction digest, which recognizes and cuts only one genomic variant. Nanopore translocations are used to classify the pathogen according to the combination of fragment lengths detected. (b) ThemazGgene of the avirulentM.tuberculosisstrain H37Ra is not cut by NaeI (942 bp), while the same gene in the closely related virulent strain H37Rv, which differs by only a single A-to-C mutation, is cut by NaeI (621bp + 321 bp). (c) Gaussian mixture model (one component) fit to translocations ofmazGfragments from H37Ra. (d) Gaussian mixture model (two components) fit to translocations ofmazGfragments from H37Rv. (e) Posterior probabilities for correctly identifying the H37Ra and H37Rv strains as a function of number of translocation events collected from an unknown sample, simulated using bootstrap sampling from nanopore translocation data. (f) TheparCgene of the multi-drug-resistant MRSA strain FPR3757 is not cut by BseRI (886 bp) due to a single C-to-A mutation, while the closely related and less resistant strain HOU-MR is cut by BseRI (640bp + 245 bp). (g) Gaussian mixture model (one component) fit to translocations ofparCfragments from FPR3757. (h) Gaussian mixture model (two components) fit to translocations ofparCfragments from HOU-MR. (i) Posterior probabilities for correctly identifying the FPR3757 and HOU-MR strains as a function of number of translocation events collected from an unknown sample, simulated using bootstrap sampling from nanopore translocation data.
strains: ThemazGgene inM.tuberculosisencodes an NTP pyrophosphohydrolase, which pro-motes cell viability under oxidative stress [24]. A single nucleotide variation of C to A inmazG at location 239 bp in H37Ra is believed to be critical to the original emergence of this less viru-lent strain (as compared to the original H37Rv from which it derives) by conferring a competi-tive advantage during aging-mediated cell lysis [25]. We designed primers and obtained an amplicon of 942 bp for this gene. As shown inFig 4B, digestion was performed with NaeI (NEB) to produce fragments of 321 bp and 621 bp for H37Rv. The amplicon from H37Ra was subjected to the same digestion protocol, but did not contain a cut site and therefore remained full-length (942 bp). We confirmed the amplification of themazGgene and its subsequent digestion by running native PAGE gels, as shown inS1 File.Fig 4C–4Dshow the GMM fit for the amplified fragment from H37Ra and its counterpart from H37Rv. The GMM fit for the cut H37Rv sample is clearly distinguishable from that of the uncut H37Ra. Based on the bootstrap simulations shown inFig 4E and 4Ffor Bayesian classification posterior estimates as a function of test data set sizeM, theseM.tuberculosisstrains can be distinguished with>99.5% confi-dence inN= 50 translocations or fewer, using a model data set size of only ~100 points (see Fig G inS1 Filefor additional numerical simulation data).
For the MRSA strains, we chose theparCgene (2.4 Kb) and amplified a subregion that includes a critical SNV site. While both strains are methicillin resistant, the FPR3757 shows a much larger spectrum of antibiotic resistance [26]. Specifically, the SNV in the FPR3757 parC gene (C to A) is believed to confer fluoroquinolone resistance. Amplicons (885 bp) from these strains were digested with BseRI, as shown inFig 4F. The amplicon from the HOU-MR strain will produce two fragments upon digestion: 245 bp and 640 bp. The amplicon from FPR3757 does not have the cut site for BseRI, so it remains uncut (885 bp) (see Fig A inS1 File).Fig 4G and 4Hshow the GMM fits for the digested samples from FPR3757 and HOU-MR, respec-tively. Based on the bootstrap simulation shown inFig 4Ifor Bayesian classification posterior estimates as a function of test data set size, this SNV can be used to discriminate between FRP3757 and HOU-MR with>99.5% confidence in N = 80 translocations or fewer, based on a model data set size of only ~100 points (see Fig H inS1 Filefor additional numerical simulation data).
A critical aspect of the approach outlined here is careful sample design to allow efficient sample identification at each site under consideration. Both Mode I and Mode II sensing depend upon differences in translocation time and blockage level caused by differences in sam-ple length. In addition to PCR design of samsam-ple length, these variables are controlled by a mul-titude of factors, including pore geometry, material, and functionalization, electrical bias, and buffer conditions. Mode II sensing is additionally dependent upon the location of the restric-tion site within a fragment; asymmetric sites may produce a more obvious change in transloca-tion dwell time or in blockage level, but very short fragments may produce dwell times below the sensing resolution of the nanopore, leading to“missed”events. These factors can be bal-anced for any given nanopore system to enable both Mode I and Mode II sensing and minimize the possibility for missed events. Note that for Mode I type sensing, the restriction digest is eliminated, conserving both time and resources. However, Mode II type sensing is more suit-able to discriminate critical single nucleotide variations, which alter pathogenicity, and also proves the high sensitivity of our method.
Conclusion
well-suited to make statistically robust diagnostic classifications among different DNA lengths with real single-molecule data, even in cases where the distributions significantly overlap. Uti-lizing a Bayesian statistical model, we have demonstrated that nanopore sensing can be used to discriminate among pathogens based on well-known genomic variations. Both large indels (Mode I) or short indels and single nucleotide variations (Mode II) can be targeted using proper sequence-specific digestion with off-the-shelf restriction enzymes. Furthermore, the Bayesian classifiers indicate the statistical confidence of each classification as a function of the number of nanopore events obtained in each measurement. Even at this preliminary stage of development we find that only a few tens of events (obtained in just a few minutes using a sin-gle pore) are sufficient to produce a statistically reliable result with well-defined and small error margins.
Our method is general and can be adapted to address many different“multiple-choice” clin-ical questions using a nanopore biosensor or other single molecule approaches. Future exten-sions of this work may seek to design and implement large panels of critical sites that represent the minimum sets necessary to characterize genomic variation for various applications in healthcare and research, and to develop additional sensing modalities. Although the primary design challenge currently remains linked to the location and availability of restriction diges-tion sites, we expect that the ongoing development of designer restricdiges-tion enzymes, for example systems based on modular zinc fingers [27], TALENs [28], or CRISPR-like proteins will pro-vide additional design flexibility for this technique.
The nanopore fingerprinting approach presented here addresses clear needs in clinical molec-ular diagnostics for a rapid and simple sensor that can identify a wide range of genomic variation in pathogens to inform treatment options. We have shown here discrimination of both large and small scale genomic variations between pathogen strains, down to single SNVs. The large, flexible sample design space for lengths, cut sites, and enzyme selection at each critical locus ensures that the technique is highly customizable for different genomic variation panels that could profile pathogenicity, antibiotic resistance, or even sequence type. The inherent scalability, minimal sample requirements, speed, and simple readout of the nanopore platform would all facilitate on-site and perhaps even automated use: As successive events are recorded, an increasingly clear fin-gerprint of translocation times and blockage levels will permit online software to“call”the sam-ple as soon as enough events have been accumulated. Our technique is highly portable and customizable, and the binary data would be readily transferrable among different labs.
Materials and Methods
Chip and Nanopore Fabrication
Nanopore chips were fabricated on a 4”silicon wafer coated with SiO2(500 nm) and low-stress
amorphous silicon nitride (SiNx, 60 nm). The SiNxwas locally thinned to<10 nm (1.5–2μm
circular wells) using a controlled RIE etch. Freestanding membranes of SiNx(60x60μm) were
created by through-etching the wafer with KOH, with the locally etched wells aligned to the etched freestanding SiNxmembranes. Nanopores were fabricated in the thinned SiNxregions
using a high resolution TEM (Jeol 2010F), as previously reported [29]. Pore formation pro-ceeded with visual feedback by iterating through a uniformly expanded beam for imaging the nanopore diameter during formation and converging the beam to locally sputter and melt the membrane. Pores of 4 ± 0.2 nm could be consistently formed.
Sample Preparation
(ATCC125618) were freshly obtained from American Type Culture Collection (ATCC). In order to obtain themazGgene from bothM.tuberculosisstrains, we designed primers for PCR amplification (35 cycles, denaturation 98°C / 10s, annealing 65°C / 30s, extension 72°C / 30 s; final extension, 72°C / 5 min) using New England Biolabs Phusion polymerase. The same pro-tocol was used for both strains using the same primers. We chose a restriction enzyme specific to the single nucleotide variation: for themazGgene in H37Rv, NaeI (New England Biolabs) will cut the amplicon into two pieces of 321 and 621 bp, whereas themazGgene from H37Ra will not be digested with this enzyme (942 bp). Two different strains of methicillin-resistantS. aureus(USA300-HOU-MR; ATCC1BAA-1718 and USA300-FPR3757; ATCC1BAA-1556) were used in order to distinguish a single nucleotide variation in theparCgene. The amplicon for the MRSAparCgene was digested with the restriction enzyme BseRI (New England Bio-labs), which cut the HOU-MR fragment into two pieces (245 bp and 640 bp), while the FPR3757 fragment remained full-length (885 bp). PCR for the MRSA strains was performed under similar conditions as for theM.tuberculosisgene amplification. Sequences and further details for these specific genes and corresponding PCR primers are provided inS1 File.
Data Acquisition and Analysis
Electrical NP measurements were performed in a dark, double-insulated Faraday cage using our custom cell (described elsewhere) [30]. The ion current was measured using an Axopatch 200B (Molecular Devices) at 100 KHz bandwidth, sampled at 250 kHz using a National Instru-ment card. Data was acquired and analyzed using custom LabView codes. Numerical simula-tions and data analysis were all performed using Matlab (MathWorks) and Igor Pro
(Wavemetrics).
Numerical Simulations
Posterior probabilities were estimated using bootstrap resampling without replacement on nanopore translocation data (>2000 events per data set). Reported posterior probabilities are the average of many (typically>1000) iterations of this method. For each iteration, randomly selected disjoint subsets were selected from the original data setsdataAanddataBto represent a model set (modelAandmodelB, sizeM) a test set (ΘAandΘB, sizeN). 2-D Gaussian mixture
models (AfitandBfit) with either one (uncut fragment) or two components (cut fragments)
were fit to each model set by expectation maximization, yielding fit parametersμ(component means),S(component covariance matrices), andw(mixture weights for each component). Posterior probabilities p(Afit|ΘA) (correct ID ofΘAas type A data), p(Bfit|ΘB) (correct ID of ΘBas type B data), p(Bfit|ΘA) (incorrect ID ofΘAas type B data), and p(Afit|ΘB) (incorrect ID
ofΘBas type A data were calculated using these fits according toEq 3, then averaged across all
iterations. All simulations assumed equal prior probabilities for A and B (0.5). Additional anal-ysis and numerical simulations are included inS1 File.
Supporting Information
loading dye. Lane 2: 100 bp NEB ladder. Lane 3:mazGgene amplified from H37Ra (942 bp). Lane 4:mazGgene amplified from H37Rv (942 bp). Lane 5:mazGfrom H37Ra after digestion with NaeI enzyme, not cut. Lane 6:mazGfrom H37Rv after digestion with NaeI, cut into two fragments of 321 and 621 bp. Lane 7:parCgene fragment amplified from HOU-MR strain (885 bp). Lane 8:parCgene fragment amplified from FPR3757 strain (885 bp). Lane 9:parC from HOU-MR after digestion reaction with BseRI, cut into two fragments of 245 and 640 bp. Lane 10:parCfrom FPR3757 after digestion reaction with BseRI, not cut. Digestion reactions were performed at 37°C for 1hr in NEB Cutsmart buffer. 10 units of enzyme were used for each digestion reaction.Fig B in S1 File. Gaussian Mixture Model Fits for DNA Translocation.
Gaussian mixture model fits to translocations of single-length DNA samples through a 4.8 nm diameter nanopore (1M KCl, +300 mV bias). (a) 100 bp NoLimits DNA. (b) 200 bp NoLimits DNA. (c) 900 bp NoLimits DNA. (d) 1000 bp NoLimits DNA. RawtDandΔIdata are shown
inFig 2(main text).Fig C in S1 File. Bayesian Posterior Estimates for Nanopore Sample Identification.Bayesian posterior estimatesp(100bp|Θ) and p(1000bp|Θ) for test data sets of Npoints given a model based onMpoints. Data is bootstrapped from translocations of (a) 100 bp NoLimits DNA and (b) 1000 bp NoLimits DNA (main text:Fig 2A and 2D) corresponding to the Gaussian Mixture Models shown in Figs Ba and Bd. Each point represents the average of 1000 simulated posterior estimates, each of which uses a randomly selected model setMand test setN.Fig D in S1 File. Mode I: Identification of 100 bp vs. 200 bp DNA.Bayesian poste-rior estimatesp(100bp|Θ) and p(200bp|Θ) for test data sets ofNpoints given a model based on Mpoints. Data is bootstrapped from translocations of (a) 100 bp NoLimits DNA and (b) 200 bp NoLimits DNA (main text:Fig 2A and 2B) corresponding to the Gaussian mixture models shown in Figs Ba and Bb. Each point represents the average of 1000 simulated posterior esti-mates, each of which uses randomly selected (disjoint) model setMand test setN.Fig E in S1 File. Mode I: Identification of 900 bp vs. 1000 bp DNA.Bayesian posterior estimatesp (900bp|Θ) and p(1000bp|Θ) for test data sets ofNpoints given a model based onMpoints. Data is bootstrapped from translocations of (a) 900 bp NoLimits DNA and (b) 1000 bp NoLi-mits DNA (main text:Fig 2C and 2D) corresponding to the Gaussian mixture models shown in Figs Bc and Bd. Each point represents the average of 1000 simulated posterior estimates, each of which uses randomly selected (disjoint) model setMand test setN.Fig F in S1 File. Mode II: Identification of 1000 bp vs 800+200 bp DNA.(a) 1000 bp at 1 nM. (b) 1:1 ratio of 800 bp + 200 bp, total concentration 2 nM. (c) Gaussian mixture model fit, 1000 bp. (d) Gauss-ian mixture model fit, 800 bp + 200 bp. (e) BayesGauss-ian posterior estimatep(1000bp|Θ) for test data sets ofNpoints given a model based onMpoints. (f) Bayesian posterior estimate p(800+-200bp|Θ) for test data sets ofNpoints given a model based onMpoints. Translocations for all samples were collected in a single nanopore (4.8 nm diameter, effective thickness ~7 nm) with a +300 mV bias relative totrans(open pore current: 13 nA). To facilitate visualization of popu-lation density, a random white noise offset below the acquisition rate of this data (-2μs<Δt<
+2μs, acquisition rate 250 kHz) has been added to eachtDin panels (a) and (b). Numerical
simulations for panels (e) and (f) were bootstrapped from the data in panels (a) and (b), respec-tively. Each point represents the average of 1000 simulated posterior estimates, each of which uses randomly selected (disjoint) model setMand test setN.Fig G in S1 File. Identification ofM.tuberculosisH37Ra vs. H37RvmazGSamples.Bayesian posterior estimatesp(H37Ra| Θ) and p(H37Rv|Θ) for test data sets ofNpoints given a model based onMpoints. Data is
sets ofNpoints given a model based onMpoints. Data is bootstrapped from translocations of (a) MRSA FPR3757 and (b) HOU-MRparCrestriction digested fragments as described in S1 File Sections 1 and 2. Each point represents the average of 1000 simulated posterior estimates, each of which uses randomly selected (disjoint) model setMand test setN.
(PDF)
Acknowledgments
We thank Tal Gilboa for useful comments on the manuscript and Sanford Squires for helpful discussions regarding the numerical simulations. We are grateful for financial support from the National Institutes of Health (NHGRI grant no. R01 HG-005871 and NIBIB grant no. R21 EB017377), and from the Israeli Centers of Research Excellence (I-CORE) program (Center #1902/12). We also thank the staff at the Harvard University Center for Nanoscale Sciences (CNS) and the Boston University Photonics Center Optoelectronic Processing Facility for their support.
Author Contributions
Conceived and designed the experiments: AM AHS EA. Performed the experiments: AHS EA. Analyzed the data: AHS. Contributed reagents/materials/analysis tools: AHS AM EA. Wrote the paper: AHS AM EA. Designed the software used in analysis: AM AHS.
References
1. Dunne WM Jr, Westblade LF, Ford B. Next-generation and whole-genome sequencing in the diagnostic clinical microbiology laboratory. Eur J Clin Microbiol Infect Dis. 2012; 31(8):1719–26. doi:10.1007/ s10096-012-1641-7PMID:22678348
2. Maiden MC, Bygraves JA, Feil E, Morelli G, Russell JE, Urwin R, et al. Multilocus sequence typing: a portable approach to the identification of clones within populations of pathogenic microorganisms. Proc Natl Acad Sci USA. 1998; 95(6):3140–5. Epub 1998/04/18. PMID:9501229; PubMed Central PMCID: PMC19708.
3. Gutacker MM, Mathema B, Soini H, Shashkina E, Kreiswirth BN, Graviss EA, et al. Single-nucleotide polymorphism-based population genetic analysis ofMycobacterium tuberculosis strains from 4 geo-graphic sites. J Infect Dis. 2006; 193(1):121–8. Epub 2005/12/03. doi:10.1086/498574PMID: 16323140.
4. Filliol I, Motiwala AS, Cavatore M, Qi W, Hazbon MH, Bobadilla del Valle M, et al. Global phylogeny of Mycobacterium tuberculosisbased on single nucleotide polymorphism (SNP) analysis: insights into tuberculosis evolution, phylogenetic accuracy of other DNA fingerprinting systems, and recommenda-tions for a minimal standard SNP set. J Bacteriol. 2006; 188(2):759–72. Epub 2005/12/31. doi:10. 1128/jb.188.2.759–772.2006PMID:16385065; PubMed Central PMCID: PMC1347298.
5. Wanunu M, Sutin J, McNally B, Chow A, Meller A. DNA Translocation Governed by Interactions with Solid-State Nanopores. Biophys J. 2008; 95(10):4716–25. doi:10.1529/biophysj.108.140475PMID: 18708467
6. Storm AJ, Storm C, Chen J, Zandbergen H, Joanny J-F, Dekker C. Fast DNA Translocation through a Solid-State Nanopore. Nano Lett. 2005; 5(7):1193–7. doi:10.1021/nl048030dPMID:16178209 7. Wanunu M, Sutin J, Meller A. DNA Profiling Using Solid-State Nanopores: Detection of DNA-Binding
Molecules. Nano Lett. 2009; 9(10):3498–502. doi:10.1021/nl901691vPMID:19585985
8. Wanunu M, Morrison W, Rabin Y, Grosberg AY, Meller A. Electrostatic focusing of unlabelled DNA into nanoscale pores using a salt gradient. Nature Nanotech. 2010; 5(2):160–5.
9. Carson S, Wilson J, Aksimentiev A, Wanunu M. Smooth DNA transport through a narrowed pore geom-etry. Biophys J. 2014; 107(10):2381–93. Epub 2014/11/25. doi:10.1016/j.bpj.2014.10.017PMID: 25418307; PubMed Central PMCID: PMC4241440.
11. Nir I, Huttner D, Meller A. Direct Sensing and Discrimination among Ubiquitin and Ubiquitin Chains Using Solid-State Nanopores. Biophys J. 2015; 108(9):2340–9. Epub 2015/05/09. doi:10.1016/j.bpj. 2015.03.025PMID:25954891; PubMed Central PMCID: PMC4423055.
12. Yusko EC, Prangkio P, Sept D, Rollings RC, Li J, Mayer M. Single-Particle Characterization of Aβ Olig-omers in Solution. ACS Nano. 2012; 6(7):5909–19. doi:10.1021/nn300542qPMID:22686709 13. Plesa C, Kowalczyk SW, Zinsmeester R, Grosberg AY, Rabin Y, Dekker C. Fast Translocation of
Pro-teins through Solid State Nanopores. Nano Lett. 2013; 13(2):658–63. doi:10.1021/nl3042678PMID: 23343345
14. Singer A, Rapireddy S, Ly DH, Meller A. Electronic Barcoding of a Viral Gene at the Single-Molecule Level. Nano Lett. 2012; 12(3):1722–8. doi:10.1021/nl300372aPMID:22352964
15. Sambrook J, Russell D. Molecular Cloning: A Laboratory Manual: Cold Spring Harbor Laboratory Press; 2001.
16. Larkin J, Henley R, Bell DC, Cohen-Karni T, Rosenstein JK, Wanunu M. Slow DNA Transport through Nanopores in Hafnium Oxide Membranes. ACS Nano. 2013; 7(11):10121–8. doi:10.1021/nn404326f PMID:24083444
17. Zheng H, Lu L, Wang B, Pu S, Zhang X, Zhu G, et al. Genetic basis of virulence attenuation revealed by comparative genomic analysis ofMycobacterium tuberculosisstrain H37Ra versus H37Rv. PLoS One. 2008; 3(6):e2375. Epub 2008/06/28. doi:10.1371/journal.pone.0002375PMID:18584054; PubMed Central PMCID: PMC2440308.
18. Highlander SK, Hulten KG, Qin X, Jiang H, Yerrapragada S, Mason EO Jr., et al. Subtle genetic changes enhance virulence of methicillin resistant and sensitiveStaphylococcus aureus. BMC Micro-biol. 2007; 7:99. Epub 2007/11/08. doi:10.1186/1471-2180-7-99PMID:17986343; PubMed Central PMCID: PMC2222628.
19. Duda RO, Hart PE, Stork DG. Pattern Classification ( 2nd Edition): Wiley-Interscience; 2000. 20. Li M, Du X, Villaruz AE, Diep BA, Wang D, Song Y, et al. MRSA epidemic linked to a quickly spreading
colonization and virulence determinant. Nature Med. 2012; 18(5):816–9. Epub 2012/04/24. doi:10. 1038/nm.2692PMID:22522561; PubMed Central PMCID: PMC3378817.
21. Lindsay JA. Hospital-associated MRSA and antibiotic resistance-what have we learned from geno-mics? Int J Med Microbiol. 2013; 303(6–7):318–23. Epub 2013/03/19. doi:10.1016/j.ijmm.2013.02.005 PMID:23499479.
22. Fleischmann RD, Alland D, Eisen JA, Carpenter L, White O, Peterson J, et al. Whole-Genome Compar-ison ofMycobacterium tuberculosisClinical and Laboratory Strains. J Bacteriol. 2002; 184(19):5479– 90. doi:10.1128/jb.184.19.5479–5490.2002PMID:PMC135346.
23. Diep BA, Gill SR, Chang RF, Phan TH, Chen JH, Davidson MG, et al. Complete genome sequence of USA300, an epidemic clone of community-acquired methicillin-resistantStaphylococcus aureus. Lan-cet. 2006; 367(9512):731–9. Epub 2006/03/07. doi:10.1016/s0140-6736(06)68231-7PMID: 16517273.
24. Cole ST, Brosch R, Parkhill J, Garnier T, Churcher C, Harris D, et al. Deciphering the biology of Myco-bacterium tuberculosisfrom the complete genome sequence. Nature. 1998; 393(6685):537–44. Epub 1998/06/20. doi:10.1038/31159PMID:9634230.
25. Lu L-d, Sun Q, Fan X-y, Zhong Y, Yao Y-f, Zhao G-P. Mycobacterial MazG Is a Novel NTP Pyropho-sphohydrolase Involved in Oxidative Stress Response. J Biol Chem. 2010; 285(36):28076–85. doi:10. 1074/jbc.M109.088872PMID:20529853
26. Ferrero L, Cameron B, Crouzet J. Analysis of gyrA and grlA mutations in stepwise-selected ciprofloxa-cin-resistant mutants ofStaphylococcus aureus. Antimicrob Agents Ch. 1995; 39(7):1554–8. Epub 1995/07/01. PMID:7492103; PubMed Central PMCID: PMC162780.
27. Wu J, Kandavelou K, Chandrasegaran S. Custom-designed zinc finger nucleases: what is next? Cell Mol Life Sci. 2007; 64(22):2933–44. Epub 2007/09/04. doi:10.1007/s00018-007-7206-8PMID: 17763826; PubMed Central PMCID: PMC2921987.
28. Joung JK, Sander JD. TALENs: a widely applicable technology for targeted genome editing. Nature Rev Mol Cell Biol. 2013; 14(1):49–55.
29. Anderson BN, Assad ON, Gilboa T, Squires AH, Bar D, Meller A. Probing Solid-State Nanopores with Light for the Detection of Unlabeled Analytes. ACS Nano. 2014; 8(11):11836–45. doi:10.1021/ nn505545hPMID:25363680