doi: 10.1590/S1984-46702010000500002
The study of animal movements gained much of the at-tention in the last decade with the perception of its importance in understanding the spatial dynamics of populations (STAPP & VAN HORNE 1997, TURCHIN 1998). Movement patterns have been particularly useful to infer search strategies (KREBS & DAVIES 1987), effects of scale (NAMS 2005), habitat selection at different scales (MOURAet al. 2005), and seasonal changes in these patterns (LORETTO & VIEIRA 2005). The diversity of approaches to under-stand and predict movement patterns has reached a critical point were a Movement Ecology paradigm is being formulated, trying to produce an integrated theoretical framework (HOLYOAKet al.
2008, NATHAN 2008, NATHANet al. 2008, REYNOLDS & RHODES 2009). A fundamental step in this theory is the description of move-ment paths, which have been modelled as correlated random walks or Lévy-walks, which have characteristic frequency distri-bution of step lengths (reviewed in GETZ & SALTZ 2008).
In this theory, a major challenge is the identification of proximate and ultimate drivers of a movement path, and the break up of the path into different movement phases or modes
(NATHANet al. 2008). Most analyses of movement paths trying to determine the best statistical models to describe it, assume that it was produced by search behaviour, but actually movement paths are a composite result of a combination of behaviours (NATHANet al. 2008). Most frequently the only information avail-able to infer the behaviours involved is the movement path it-self, and quantitative descriptors of movement paths – such as movement indices – may help in this inference of the behaviours involved.
The most common characteristic used to describe and analyze movement paths is its tortuosity, or how much tortu-ous and twisted a path is in a given space or time (CODLINGet al.
2008). Tortuosity has been inferred by a variety of movement measures that frequently express different information or con-cepts about movement behaviour. Sinuosity is frequently used as a synonym, but has been defined as a specific type of tortuos-ity (BOVET & BENHAMOU 1988, BASTARDIEet al. 2002, BENHAMOU 2004). BOVET & BENHAMOU (1988) defined sinuosity as the tortuosity that would be obtained from a random search, resulting in a
corre-Indices of movement behaviour: conceptual background,
effects of scale and location errors
Paulo J. A. L. Almeida
1, 3; Marcus V. Vieira
1; Maja Kajin
1;
German Forero-Medina
2& Rui Cerqueira
11 Laboratório de Vertebrados, Departamento de Ecologia, Instituto de Biologia, Universidade Federal do Rio de Janeiro.
Caixa Postal 68020, 21941-590 Rio de Janeiro, RJ, Brazil.
2 Graduate Program in Ecology, Nicholas School of the Environment, Duke University. 3 Corresponding author. E-mail: pauloall@biologia.ufrj.br
ABSTRACT.A fundamental step in the emerging Movement Theory is the description of movement paths, and the identification of its proximate and ultimate drivers. The most common characteristic used to describe and analyze movement paths is its tortuosity, and a variety of tortuosity indices have been proposed in different theoretical or empirical contexts. Here we review conceptual differences between five movement indices and their bias due to loca-tions errors, sample sizes and scale-dependency: Intensity of Habitat use (IU), Fractal D, MSD (Mean Squared Distance), Straightness (ST), and Sinuosity (SI). Intensity of Habitat use and ST are straightforward to compute, but ST is actually an unbiased estimator of oriented search and ballistic movements. Fractal D is less straightforward to compute and repre-sents an index of propensity to cover the plane, whereas IU is the only completely empirical of the three. These three indices could be used to identify different phases of path, and their path tortuosity is a dimensionless feature of the path, depending mostly on path shape, not on the unit of measurement. This concept of tortuosity differs from a concept implied in the sinuosity of BENHAMOU (2004), where a specific random walk movement model is assumed, and diffusion distance is a function of path length and turning angles, requiring their inclusion in a measure of sinuosity. MSD should be used as a diagnostic tool of random walk paths rather than an index of tortuosity. Bias due to location errors, sample size and scale, differs between the indices, as well as the concept of tortuosity implied. These differences must be considered when choosing the most appropriate index.
lated random walk with constant step lengths (CODLINGet al. 2008). In this context, tortuosity and sinuosity indices were de-signed to measure different concepts, adding more complexity in the choice of an appropriate index. For example, in a study of the ornate turtle, Terrapene ornata (Agassiz, 1857), CLAUSSEN (1997) compared four movement indices, but only one pair of indices was correlated with each other. Actually, these indices have been proposed in different theoretical or empirical contexts, and there-fore could not be applied to the same situations. Redundancy between movement indices, their advantages and disadvantages are not always clear.
The choice of the appropriate index also has to consider how it is affected by location errors, inherent to any estimate of a movement path (KAUHALA & TIILIKAINEN 2002), dependency on sample size and scale (NAMS 2005). These factors affect the accuracy of movement parameters, particularly in GPS data (BRADSHAWet al. 2007).
MATERIAL AND METHODS
Here we review the conceptual differences and distin-guish the appropriate application of five indices used in the previous studies to quantify animal movement: Intensity of Habitat Use (HAILEY & COULSON 1996, LORETTO & VIEIRA 2005), Fractal D (NAMS 1996), Mean Squared Displacement or distance (SCHOENER 1981, SWIHART & SLADE 1985), Straightness (BATSCHELET 1981), and Sinuosity (BOVET & BENHAMOU 1988). We also make a first analysis of empirical differences in these indices regarding location errors, spatial scale and sample size, simulating their effects on real movement paths of a Neotropical marsupial, the black-eared opossum Didelphis aurita (Wied-Neuwied, 1826).
Conceptual differences between movement indices
Of the five indices considered, only Intensity of Use, IU, is purely empirical and does not have a theoretical background, hence is not linked to a particular mechanism. Defined as the ratio between total movement and the square root of the area of movement (LORETTO & VIEIRA 2005), it is proportional to the active time spent per unit area, which should increase with tortuosity of the path. Several versions were proposed in the literature, such as the square root of the area of habitat use divided by the length of the movement (HAILEY & COULSON 1996), the inverse of IU as in LORETTO & VIEIRA (2005), and the comple-ment of the Straightness index (BATSCHELET 1981), but their re-lationship with active time spent per unit area is not as clear or direct as in IU. However, there are various ways to increase space use intensity, such as reducing speed, increasing sinuos-ity of a diffusive movement, and performing search loops, us-ing the borders of a profitable area as reflective boundaries. Besides, IU depends on sample size to some extent because es-timates of area of habitat use, such as daily home ranges, de-pend on sample size (GAUTESTAD & MYSTERUD 1995) or path length (LORETTO & VIEIRA 2005).
The fractal dimension of a path, D, is another measure of tortuosity that has been used (DICKE & BURROUGH 1988, NAMS 1996, NAMS & BOURGEOIS 2004, NAMS 2005, 2006, TREMBLAYet al.
2007), based on the theoretical framework of fractal geometry (MANDELBROT 1983). The Fractal D of a set of two points (as a curve) can be seen as a measure of its propensity to cover the plane, being a value of one for no plane coverage (a straight line, for example) and two for full coverage of some area in the plane. Generally, Fractal D must be correlated with path tortu-osity, but it is not a measure of tortuosity per se, and should be more appropriately considered an area-filling index, hence particularly suitable for the analysis of search behaviour (TREMBLAYet al. 2007). If tortuosity is the question of interest, and movements can be assumed to follow a correlated random walk, sinuosity indexes should be used instead (BENHAMOU 2004). A high Fractal D value will only result when a track’s convolu-tions lead to reasonably efficient coverage of an area in the plane. One advantage of Fractal D over other indices is the possibility of relating movement metrics to other objects, such as pattern of tree branching, Koch curves, and the distribution of elements of the landscape (DICKE & BURROUGH 1988, NAMS 1996). Another advantage is the use of change in Fractal D with scale to detect changes in movement behaviour with scale (WITH 1994, NAMS 1996, NAMS & BOURGEOIS 2004, NAMS 2005, TREMBLAYet al. 2007). The use of fractals in Ecology has been questioned, especially regarding the assumption of auto-simi-larity among scales, considered as a required condition for char-acterizing a fractal (TURCHIN 1996, HALLEYet al. 2004). However, MANDELBROT (1983) proposed the application of the fractal theory to natural phenomena even if these were not perfectly fractal (NAMS & BOURGEOIS 2004). If it is assumed that an image does not reflect an ideal fractal, fractal dimension may still be use-ful as a parameter that indicates complexity or the scale de-pendence of a pattern (JELINEKet al. 1998), or may be used in a statistical sense, as long as the feature measured at high resolu-tion is proporresolu-tional to the same feature measured over the whole system at a coarser resolution (BASSINGTHWAIGHTEet al.
1994, SOLÉ & BASCOMPTE 2006).
The Mean Square Displacement, MSD, is an important parameter from the random walk theory (reviewed in CODLING
Table I. Indices compared and their formulation
Index Equation Parameters Reference
Straightness (ST)
dE = Euclidean distance between the beginning and end of the path
L = Total path length
BATSCHELET (1981)
Mean Squared Displacement (MSD)
X and Y = cartesian coordinates of each point of trajectory change along the path
SCHOENER (1981), SWIHART
&SLADE (1985)
Intensity Use (IU) L = total path lenght
A = area of the movement
HAILEY &COULSON (1996)
LORETTO &VIEIRA (2005)
Sinuosity (SI)
p = mean step length, c = mean cosine of turning angles, s = mean sine of turning angles, b = coefficient of variation of step length
BOVET &BENHAMOU (1988),
BENHAMOU (2004)
Fractal D Mean D estimator, using Fractal D
program http://nsac.ca/envsci/staff/vnams/Fractal.htm NAMS (1996, 2005)
parametric variance of distances is distributed as a Chi-square variable, hence the statistical significance of differences between values can be tested (SWIHART & SLADE 1985). For these reasons MSD should be used more as diagnostic parameter in non-ori-ented movement paths rather than a simple descriptive index. The Straightness or linearity index, ST, (BATSCHELET 1981), is simply the net displacement distance (the Euclidian distance between the start and the final point), divided by the total length of the movement. The total length of movement could be measured by a spool-and-line device (BREDER 1927, MILES 1976, BOONSTRA & CRAINE 1986), by a radiotracking device (MILLSPAUGH & MARZLUFF 2001), or by the square root of an area measure-ment such as the Minimum Convex Polygon (LORETTO & VIEIRA 2005) or the Mean Square Displacement, MSD (HAYNE 1949). The Straightness index measures how straight the animal path was relative to the final point, it varies from 0 to 1, and quan-tifies search efficiency: the closer to 1, the higher the search efficiency (hence inversely related to path tortuosity). Defined as such, it seems as empirical as IU, but actually it is only ap-propriate to quantify ballistic movements, oriented towards a distant goal (BENHAMOU 2004). For diffusive movements, mod-elled as random walks, ST tends to decrease when the denomi-nator – total movement – increases, tending to zero for an in-finitely long path. An unbiased estimator of ST for diffusive movements can be obtained by using the square root of total movement in the denominator, but then ST becomes a dimen-sional index, depending on the units of the mean step length. Nevertheless, it cannot be considered a reliable estimator be-cause of its intrinsic high variability (BENHAMOU 2004).
BOVET & BENHAMOU (1988) and BENHAMOU (2004) devised specific estimates of tortuosity of random search paths, named Sinuosity estimates, which differ from previous indices such as IU, Fractal D and ST in its formulation, and even in the concept of tortuosity implied by these indices. Sinuosity assumes that paths are correlated random walks, hence were produced by
animals randomly searching a homogenous environment, which is not an assumption of any of the other indices. Based on ran-dom walk theory, BENHAMOU (2004) determined relationships between diffusion distance of a random search, the correlation of turning angles, and step length. In random search, diffusion distance is determined by both step length and turning angles, hence tortuosity of a random search path has a dimension re-lated to mean step length. In oriented searches, tortuosity is determined mostly by the mean vector length of step orienta-tions, not step length, hence a dimensionless index such as ST is appropriate. In random searches, however, an estimate of tortu-osity based on diffusion distance has to include path length and turning angles, which was formulated as a Sinuosity measure (BENHAMOU 2004, 2006). In its general formulation, see table I (equation 10 of BENHAMOU 2004), where p = mean step length, c = mean cosine of turning angles, s = mean sine of turning angles, b = coefficient of variation of step length. This equation is the more appropriate for paths with varying step lengths, and assumes that turning angle and subsequent step are uncorrelated. Sinuosity estimates the tortuosity if the path were measured with steps of the same length, hence it should not matter if paths were tracked with different resolution – the sinuosity measure scales them to the same sampling scale, to same step length.
Sinuosity has a dimension, mean step length, and move-ment paths measured in centimetres, while if measured in meters, they will have different values of sinuosity, even if iden-tical in shape. This is a major difference from dimensionless indices of tortuosity such as IU, Fractal D, and ST, for which units of measurement do not matter, and paths identical in shape have the same tortuosity, regardless of path length units. Thus, sinuosity can only be compared between random search paths of similar length.
The five movement indices considered differ conceptu-ally regarding their theoretical background (empirical, fractal, or random walk) (see also table I for calculation comparison),
ST
dE
L
=
MSD VarX VarY
−
+
IU
L
A
=
(
)
SI
p
c
s
c
s
b
=
−
−
−
+
+
⎛
⎝
⎜⎜
⎞
⎠
⎟⎟
⎡
⎣
⎢
⎢
⎤
⎦
⎥
⎥
−2
1
1
2 2 2 2
in their potential dependence on sampling scale and sample size, and in their dimensionality (dimension vs. dimension-less). For dimensionless indices, tortuosity of a path is a result of its shape, how much zig-zag it does and the relative distance between zig-zags, whereas a dimensional SI, paths of same shape but with different sizes will differ.
Empirical differences between indices: effects of
scale, sample size and location errors
We used real animal movements of a long term database to simulate the effects of scale, sample size, and location er-rors. Real movement paths represent natural and unexplained variation likely to occur in any application of movement indi-ces. Totally simulated paths would be valuable to test expected patterns based on pre-established hypotheses and assumptions, but limited for an empirical test.
A vertebrate species was used as a model, the black-eared opossum Didelphis aurita Wied-Neuwied, 1826. Species of Di-delphis Linnaeus, 1758are also known as common opossums because they are frequently abundant locally, widespread in distribution, and considered generalist in food habits and habi-tat use compared to other didelphid marsupials (NOWAK 1999). Individuals of D. aurita were sampled in bimonthly trapping sessions from 1997 to 2006 as part of a capture-recapture pro-gram of the Laboratório de Vertebrados, UFRJ (LORETTO & VIEIRA 2005). The field site is located in the mountain range of Serra dos Órgãos, in the Parque Nacional da Serra dos Órgãos (PARNA/ SO), municipality of Guapimirim, state of Rio de Janeiro, Bra-zil, locally known as Garrafão (22°28’28”S, 42°59’86”W). Indi-viduals were released with a spool-and-line device (CUNHA & VIEIRA 2002). Thread released by each animal was tracked, and paths were mapped taking polar coordinates (azimuth and dis-tance) between points of trajectory change, defined by any change of more than 5º on the animal’s path. We used all move-ments with more than 30 m of thread tracked. During the study period 114 animals were captured, resulting in 149 tracked pathways. Distance between consecutive points of trajectory change corresponds to step length (mean = 4.5, SD = 4.11), path length was the sum of step lengths (mean = 161.5, SD = 119.51), and the path area was the area of the polygon formed by joining the points, each point corresponding to a polygon vertex, used to calculated IU.
The effect of sample size on real paths was simulated by comparing index values calculated using only half the total number of points of a path with values calculated using all points. This reduction to n/2 was accomplished by calculating each index for odd and even numbered points of the path separetely, and using the mean of the two (odd and even) for comparison with the value using all points. Therefore, the length of movement paths did not change compared to the original path, only sample size (number of location points).
The effect of scale was simulated by splitting each path in two with the same number of points each, such that the
number of points was n/2 in each half as in the simulation of sample size effect, but now path length also was reduced to approximately half the original length. Movement indices were calculated for the two parts, and the mean value was used to determine the effect of reducing path length. This effect was determined by comparison with the index value obtained for the sample size effect, using alternating points. The original path cannot be used for comparison because it differs not only in scale, but also in sample size.
Effects of localization errors where simulated by adding a random value to x and y coordinates of each original point. Values were randomly chosen from a uniform distribution vary-ing between ± 5, 15, 30, 45, or 80% of the overall mean step length. In this way, a new point was generated for each origi-nal movement coordinate, a point with localization error.
Fractal D was calculated for each original and simulated path with the Fractal software (NAMS 2005), whereas the re-maining indices and all simulations with a routine written in MATLAB.
RESULTS
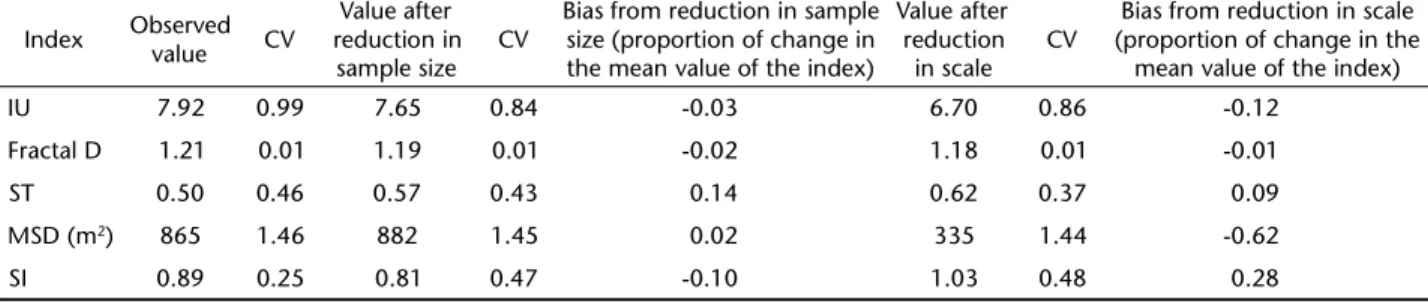
Bias due to sample size was relatively small, varying from 0.05 (Fractal D) to 0.14 (ST) of the original value for a 0.50 reduction in sample size (Tab. II). For scale effects, MSD was clearly the most affected compared to other four indices, which varied from 0.01 (Fractal D) to 0.28 (SI) for a 0.50 reduction in scale (Tab. II). A scale effect on MSD is to be expected because, as described previously, MSD allows the distinction between different types of diffusion according to is scaling exponent with path length or time. Thus, it is expected that MSD should depend on scale (path length). Fractal D was practically unaf-fected by the reduction in sample size and scale (Tab. II).
Intensity of Use and ST were the most sensitive to loca-tion errors, but bias became large, more than 0.10 of the origi-nal value, only for relatively large location errors, greater than 45% of the mean path length (Fig. 1). Bias for SI, Fractal D and MSD also appeared only with location errors greater than 45%, but bias was only ca. ± 0.03 of the original index value.
Straightness was positively biased by location errors, whereas IU was negatively biased. Therefore, increasing loca-tion errors had the effect of reducing overall tortuosity of move-ment paths, reducing IU, and increasing ST.
DISCUSSION
If search behaviour can be assumed to be mostly oriented, either by the perceptual abilities or spatial memory of indi-viduals, then ST would be appropriate to measure search effi-ciency. Sample size, scale and low to medium levels of location errors did not introduce much bias in ST. Bias was greater than 0.10 of the original value only for really high level of location errors, above 45% of mean step length, which would make movement paths hardly of any use (Fig. 1). Therefore, ST is generally an unbiased estimate of straightness of oriented move-ment paths.
If random search behaviour for unknown patches of food or a specific resource can be assumed to be the major driver of the path, the SI would be an appropriate index to describe it, particularly if diffusivity of path is also of interest (BENHAMOU 2006). Bias from reduced sample size and location errors may not be important for most uses, but bias from differences in path length between individuals (differences in scale) may be an issue. The dependency of SI on scale was expected from the definition of sinuosity, which depends on path length (BENHAMOU 2004): if two movement paths have the same turn-ing angles, the one with longer step lengths will have lower SI. In the calculation of SI, step lengths are discretized again to the same length, hence the one with longer step length will have some steps broken into two or more pieces, all with 0º turning angles, resulting in a lower SI. Therefore, SI may be the more appropriate index to compare sinuosity among move-ment paths as long as path lengths are of similar scale.
Paths produced mostly by non-oriented search may best be described by SI, but how to test a specific process behind the non-oriented search of individuals? For instance, how to test if an individual is moving according to a random walk or to Lévy-walk process? A diagnostic index such as MSD could be used in such case, but still assuming a non-oriented search mechanism. The high dependency of MSD on scale (Tab. II) reduces its value as a descriptive measure or index of path tor-tuosity, but actually is the property that makes it an excellent diagnostic tool. As MSD should scale linearly with time or path length for purely diffusive paths, super-diffusive movements have MSD increasing with a power exponent between 1 and 2 (CODLINGet al. 2008). Super-diffusion would imply a Lévy walk frequency distribution of step lengths, characterized by long step lengths more frequent than expected by a Gaussian fre-quent distribution (GETZ & SALTZ 2008). Although it was not an objective here to estimate the specific type of diffusion or bal-listic movement involved in the paths of D. aurita, the rela-tionship between MSD and scale (path length) suggests a diffu-Table II. Bias produced by reduction in sample size and scale on movement indices. Index values are the means and their coefficient of variation (CV) of index values based on 149 individual paths of the marsupial D. aurita. (IU) Intensity of Use, (ST) Straightness index, (MSD) Mean Square Displacement, (SI) Sinuosity index. Reduced sample size effect was determined comparing the original path with a path of the same length but considering only alternate points along the path (same path length, but different number of points). Reduced scale effect was determined by dividing the original path in two halves, computing the index on each half, and comparing the average with the index computed on the whole path but considering only alternate points (same number of points, but different path length).
Index Observed
value CV
Value after reduction in sample size
CV
Bias from reduction in sample size (proportion of change in the mean value of the index)
Value after reduction in scale
CV
Bias from reduction in scale (proportion of change in the
mean value of the index)
IU 7.92 0.99 7.65 0.84 -0.03 6.70 0.86 -0.12
Fractal D 1.21 0.01 1.19 0.01 -0.02 1.18 0.01 -0.01
ST 0.50 0.46 0.57 0.43 0.14 0.62 0.37 0.09
MSD (m2) 865 1.46 882 1.45 0.02 335 1.44 -0.62
SI 0.89 0.25 0.81 0.47 -0.10 1.03 0.48 0.28
-0.3 -0.2 -0.1 0 0.1 0.2 0.3
0%
Bias
introduced
in
the
index
mean
value
(proportion
of
change
in
the
mean)
Location error (percent of mean path length)
5% 15%
Fractal D
30% 45% 80%
IU SI MSD ST
sive or super-diffusive movement. MSD reduced an average 0.63 of its original value for a 0.50 reduction in path length, which implies an exponent between 1 and 2. Values of ST also do not suggest a strong orientation or search efficiency, but common opossums are capable of oriented paths in open fields such as a pasture (FORERO-MEDINA & VIEIRA 2009). The paths could be a composite of directed and random search phases.
If oriented and non-oriented movements are similarly fre-quent, then the objective may be to identify these different phases along the path. Area restricted search can also be considered a non-oriented search, where movements are concentrated in a certain area more than would be expected based on random movement (TREMBLAYet al. 2007). Indices with more intuitive in-terpretation would be appropriate for identification of oriented and non-oriented phases, such as IU and ST, and they would have to be calculated at different portions of the path. Although less intuitive, Fractal D also could be used, particularly because it was the least affected among these three indices by sample size, scale, and location errors (Tab. II, Fig. 1). How should the path be divided in order to calculate these indices along the path? NAMS (1996, 2005) devised an ingenious method: a segment of a given length is moved along the track, and Fractal D is calcu-lated for each segment. As Fractal D generally increases with track convolutions, the segment lengths corresponding to highest average D, and/or highest variance in D, are used as a cut-off to identify the changes in Fractal D with scale. This method is based on changes in Fractal D with space coverage, but area restricted search may also involve changes in time and space used along the path. A method also using Fractal D, but including time and space to detect area restricted search was also developed (TREMBLAY
et al. 2007). A similar approach could be used with ST and IU. If intensive vs. extensive phases of the path cannot be at-tributed only to search behaviours, then more empirical and straightforward indices, such as IU and ST, may be more appro-priate as they make no assumption about causing mechanisms. Fractal D also could be used as an empirical description of com-plexity and scale dependence of a pattern, without necessarily implying that it was generated by a truly fractal process (JELINEKet al. 1998). Again, the advantage of using Fractal D is that it could be used to determine changes in movement behaviour – and prob-ably tortuosity – along the path. Both ST and IU are not severely biased by small to medium levels of location errors (Fig. 1), ST slightly more affected by sample size and IU by scale (Tab. II). Each phase could then be treated by one of the following indi-ces, appropriately chosen according to its theoretical background. The first question that has to be made when choosing a movement index is if a specific mechanism or behaviour mecha-nism is the main cause of the path. If this question cannot be answered, movement indices are likely to continue to be used empirically, as a first or general description of movement paths, without assumptions about the mechanisms or behaviours that produced it. Actually, movement indices must be viewed as more than descriptors of movement paths as they can be used to
iden-tify different phases of tortuosity along the path, and different behaviours generating the path. Used empirically or as diagnos-tic tools, indices differ in bias due to location errors, sample size and scale, which then should be considered in the choice of an index. The concept of tortuosity implied may also differ between indices, and one must be conscious of this difference when choos-ing the most appropriate index of movement paths.
ACKNOWLEDGEMENTS
Anonymous referees made invaluable comments on early versions of this manuscript, and Angela Marcondes and Nélio P. Barros invaluable logistical support. Financial support was pro-vided by grants from Conselho Nacional de Desenvolvimento Científico e Tecnológico (CNPq) to Marcus V. Vieira and Rui Cerqueira, and from Fundação de Amparo à Pesquisa do Estado do Rio de Janeiro (FAPERJ) to Rui Cerqueira. The Coordenação de Aperfeiçoamento de Pessoal de Nível Superior (CAPES) also provided post-graduate fellowships to Paulo J.A.L. Almeida, Ger-man Forero-Medina, and currently a post-doctoral fellowship to Maja Kajin (PNPD – Programa Nacional de Pós-doutorado).
LITERATURE CITED
BASSINGTHWAIGHTE, J. B.; L.S. LIEBOVITCH & B. J. WEST. 1994. Fractal
Physiology. New York, Oxford University Press.
BASTARDIE, F.; M. CANNAVACIUOLO; Y. CAPOWIEZ; J.R. DE DREUZY; A. BELLIDO & D. CLUZEAU. 2002. A new simulation for modelling the topology of earthworm burrow systems and their effects on macropore flow in experimental soils. Biology and Fertility of Soils36: 161-169.
BATSCHELET, E. 1981. Circular Statistics in Biology. London, Academic Press.
BENHAMOU, S. 2004. How to reliably estimate the tortuosity of an animal’s path: strightness, sinuosity, or fractal dimension?
Journal of Theoretical Biology229: 209-220.
BENHAMOU, S. 2006. Detecting an orientation component in animal paths when the preferred direction is individual-dependent. Ecology 87: 518-528.
BOONSTRA, R. & I.T.M. CRAINE. 1986. Natal nest location and small mammals tracking with a spool and line technique.
Canadian Journal of Zoology64: 1034-1036.
BOVET, P. & S. BENHAMOU. 1988. Spatial analysis of animals’ movements using a correlated random walk model. Journal of Theoretical Biology131: 419-433.
BRADSHAW, C.J.A.; D.W. SIMS & G.C. HAYS. 2007. Measurement error causes scale-dependent threshold erosion of biological signals in animal movement data. Ecological Applications 17: 628-638.
CODLING, E.A.; M.J. PLANK & S. BENHAMOU. 2008. Random walk models in biology. Journal of the Royal Society Interface 5: 813-834.
CUNHA, A.A. & M.V. VIEIRA. 2002. Support diameter, incline, and vertical movements of four didelphid marsupials in the Atlantic Forest of Brazil. Journal of Zoology (London) 258: 419-426. DICKE, M. & P. BURROUGH. 1988. Using fractal dimensions for characterizing tortuosity of animal trails. Physiological Entomology13: 393-398.
FORERO-MEDINA, G. & M.V. VIEIRA. 2009. Perception of a fragmented landscape by neotropical marsupials: effects of body mass and environmental variables. Journal of Tropi-cal Ecology 25: 53-62.
GAUTESTAD, A.O. & I. MYSTERUD. 1995. The home range ghost.
Oikos 74: 195-204.
GETZ, W.M. & D. SALTZ. 2008. A framework for generating and analyzing movement paths on ecological landscapes.
Proceedings of the National Academy of Sciences of the United States of America105: 19066-19071.
HAILEY, A. & I.M. COULSON. 1996. Differential scaling of home-range area to daily movement distance in two African tortoises. Canadian Journal of Zoology74: 97-102. HALLEY, J.M.; S. HARTLEY; A.S. KALLIMANIS; W.E. KUNIN; J.J. LENNON &
S.P. SGARDELIS. 2004. Uses and abuses of fractal methodology in ecology. Ecology Letters7: 254-271.
HAYNE, D.W. 1949. Calculation of size of home range. Journal
of Mammalogy30: 1-18.
HOLYOAK, M; R. CASAGRANDI; R. NATHAN; E. REVILLA & O. SPIEGEL. 2008. Trends and missing parts in the study of movement ecology. Proceedings of the National Academy of Sciences of the United States of America105: 19060-19065. JELINEK, H.F; C.L. JONES & M.D. WARFEL. 1998. Is there meaning
in fractal analyses? Complexity Internationa6: 241. KAUHALA, K. & T. TIILIKAINEN. 2002. Radio location error and the
estimates of home-range size, movements, and habitat use: A simple field test. Annales Zoologici Fennici 39: 317-324. KREBS, J.R. & N.B. DAVIES. 1987. An Introduction to Behavioural
Ecology. Oxford, Blackwell Scientific.
LORETTO, D. & M.V. VIEIRA. 2005. The effects of reproductive and climatic seasons on movements in the black-eared opossum (Didelphis aurita Wied-Neuwied, 1826). Journal of Mamma-logy 86: 287-293.
MANDELBROT, B.B. 1983. The Fractal Geometry of Nature/ Revised and Enlarged Edition. New York, W.H. Freeman. MILES, M.A. 1976. A simple method of tracking mammals and locating triatomine vectors of trypanosoma cruzi in amazonian forest. The American Journal of Tropical Medicine and Hygiene25: 671-675.
MILLSPAUGH, J. & J. MARZLUFF. 2001. Radio Tracking and
Ani-mal Populations. San Diego, Elsevier Science.
MOURA, M.C.; A.C. CAPARELLI; S.R. FREITAS & M.V. VIEIRA. 2005. Scale-dependent habitat selection in three didelphid marsupials using the spool-and-line technique in the
Atlantic forest of Brazil. Journal of Tropical Ecology21: 337-342.
NAMS, V.O. 1996. The VFractal: a new estimator for fractal dimension of animal movement paths. Landscape Ecology 11: 289-297.
NAMS, V.O. 2005. Using animal movement paths to measure response to spatial scale. Oecologia 143: 179-188. NAMS, V.O. 2006. Animal movement rates as behavioural bouts.
Journal of Animal Ecology75: 298-302.
NAMS, V.O. & M. BOURGEOIS. 2004. Fractal analysis measures habitat use at different spatial scales: an example with American marten. Canadian Journal of Zoology82: 1738-1747. NATHAN, R. 2008. An emerging movement ecology paradigm.
Proceedings of the National Academy of Sciences of the United States of America105: 19050-19051.
NATHAN, R.; W.M. GETZ; E. REVILLA; M. HOLYOAK; R. KADMON; D. SALTZ & P.E. SMOUSE. 2008. A movement ecology paradigm for unifying organismal movement research. Proceedings of the National Academy of Sciences of the United States of America105: 19052-19059.
NOWAK, R.M. 1999. Walker’s Mammals of the World. Baltimore, John Hopkins University Press, 6th ed.
REYNOLDS, A.M. & C.J. RHODES. 2009. The Lévy flight paradigm: random search patterns and mechanisms. Ecology90: 877-887.
SCHOENER, T.W. 1981. An empirically based estimate of home range. Theoretical Population Biology20: 281-325. SLADE, N.A. & R.K. SWIHART. 1983. Home range indices for the
hispid cotton rat (Sigmodon hispidus) in Northeastern Kansas.
Journal of Mammalogy64: 580-590.
SOLÉ, R.V. & J. BASCOMPTE. 2006. Self-Organization in Complex
Ecosystems. Princeton, Princeton University Press. STAPP, P. & B. VAN HORNE. 1997. Response of deer mice (Peromyscus
maniculatus) to shrubs in shortgrass prairie: linking small-scale movements and the spatial distribution of individuals.
Functional Ecology11: 644-651.
SWIHART, R. K. & N.A. SLADE. 1985. Testing for independence of observations in animal movements. Ecology 66: 1176-1184. TREMBLAY, Y.; A.J. ROBERTS. & D.P. COSTA. 2007. Fractal landscape method: An alternative approach to measuring area-restricted searching behavior. Journal of Experimental Biology 210: 935-945.
TURCHIN, P. 1996. Fractal analysis of animal movement: a criti-que. Ecology77: 2086-2090.
TURCHIN, P. 1998. Quantitative Analysis of Movement. Sunderland, Sinauer Associates Publishers.
WITH, K.A. 1994. Using fractal analysis to assess how species perceive landscape structure. Landscape Ecology9: 25-36.