Wireless Sensor Network for Medical
Applications
Hanady S.Ahmed Abduladhem Abdulkareem Ali
Dept. of Electrical Engineering Dept. of Computer Engineering
University of Basrah University of Basrah Basrah, Iraq Basrah, Iraq
[email protected] [email protected]
Abstract:
This work presents a healthcare monitoring system that can be used in an intensive care room. Biological information represented by ECG signals is achieved by ECG acquisition part . AD620 Instrumentation Amplifier selected due to its low current noise. The ECG signals of patients in the intensive care room are measured through wireless nodes. A base node is connected to the nursing room computer via a USB port , and is programmed with a specific firmware. The ECG signals are transferred wirelessly to the base node using nRF24L01+ wireless module. So, the nurse staff has a real time information for each patient available in the intensive care room. A star Wireless Sensor Network is designed for collecting ECG signals . ATmega328 MCU in the Arduino Uno board used for this purpose. Internet for things used For transferring ECG signals to the remote doctor, a Virtual Privet Network is established to connect the nursing room computer and the doctor computer . So, the patients information kept secure. Although the constructed network is tested for ECG monitoring, but it can be used to monitor any other signals.
INTRODUCTION
For elderly people, or the patient suffering from the cardiac disease it is very vital to perform accurate and quick diagnosis. Putting such person under continuous monitoring is very necessary. (ECG) is one of the critical health indicators that directly bene t from long-term monitoring. ECG signal is a time-varying signal representing the electrical activity of the heart. It is an effective, non- invasive diagnostic tool for cardiac monitoring[1]. In this medical field, a big improvement has been achieved in last few years. In the past, several remote monitoring systems using wired communications were accessible while nowadays the evolution of wireless communication means enables these systems to operate everywhere in the world by expanding internet benefits, applications, and services [2].
Wireless Sensor Networks (WSNs), as the name suggests consist of a network of wireless nodes that have the capability to sense a parameter of interest like temperature, humidity, vibration etc[3,4].
The health care application of wireless sensory network attracts many researches nowadays[ 5-7] . Among these applications ECG monitoring using
smart phones[6,8], wearable Body sensors[9], remote patient mentoring[10],...etc.
This paper presents wireless ECG monitoring system for people who are lying at intensive care room. At this room ECG signals for every patient are measured using wireless nodes then these signals are transmitted to the nursing room for remote monitoring. The nursing room computer is then connected to the doctors computer who is available at any location over the word by Virtual Privet Network (VPN) in such that the patients information is kept secure and inaccessible from unauthorized persons.
II.MOTE HARDWARE ARCHITECTURE The proposed mote as shown in Fig.1 consists of two main sections : the digital section which is represented by the Arduino UNO Board and the wireless module and the analog section. The analog section consists of Instrumentation Amplifier AD620 , Bandpass filter and an operational amplifier for gain stage, in addition to Right Leg Drive Circuit. The required power is supplied by an internal 3800MAH Lithium-ion (Li-ion) battery which has 3.7V output voltage.
Index Terms— wireless sensor network, ECG aquistion, ECG amplifier, Internet of things, VPN, Atmega128
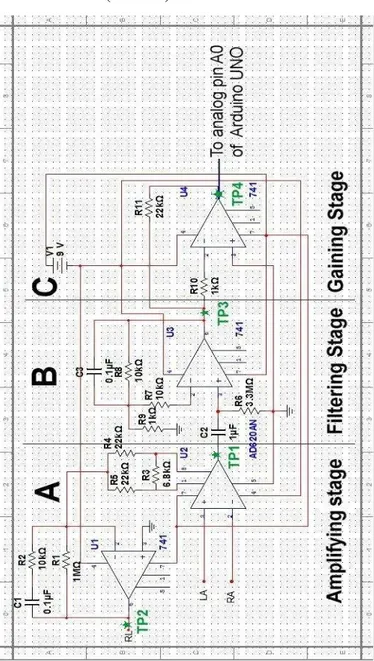
III.ECGACQUISITION SYSTEM
The proposed ECG acquisition system includes three parts. These parts are amplifying (A), filtering (B) and gain stage (C) respectively. as shown in Fig. 2. In part A, the instrumentation amplifier AD620 had been selected due to its features. It is a low cost, high accuracy instrumentation amplifier. The low current noise of the AD620 allows its use in ECG Monitoring. The gain in this part is 8. The sensed ECG is typically noisy, and must be filtered to extract the essential signal. Extracting the QRS complex requires a pass band of 0.05- 150 Hz, which is achieved by cascading low pass and high pass filters with cutoff frequencies 0.05 Hz and 159 Hz respectively. Gain of part B is 10. To increase total gain to 1760, part C increases the gain of the signal with 22. The output of this system is applied to ARDUINO analog pins. The Arduino’s implementation is based on the ATmega328P microcontroller chip. It has 6-channel 10-bit ADC, so one channel is used for one ECG lead. Four extra channels can be used for the other leads of five lead ECG system. The remaining channel could be used for other
applications such as temperature monitoring . The six analog inputs are routed to the analog-to-digital converter through a multiplexer. The conversion resolution is 0.0049 volts (4.9 mV).
IV
IV.WSNDESIGN AND IMPLEMENTATION nRF24L01+ wireless transceiver module is selected for the current system. It has 2Mbps maximum bit rate, 1mW transmit power and operates in the 2.4 GHz unlicensed band using GFSK modulation. It consumes only 11.3mA in TX mode at 1mW transmit power and 13.5mA in RX mode at 2Mbps rate. It can operate in Shockburst and Enhanced Shockburst modes which incorporate automatic packet assembly, timing, auto acknowledgment and auto retransmission upon transmission failure. Figure 1 : Block Diagram of the Proposed
Wireless Mote
nRF24L01+ wireless module board is shown in fig. 3. nRF24L01+ is connected to Arduino UNO through SPI interface pins CSN, SCK, MOSI, MISO and IRQ as in Table 1.
TABLE 1:INTERFACE OF NRF24L01+ TO
ARDUINO UNO nRF24L01+pin number and
function
Arduino pin
1 GND GND
2 VCC 3.3V
3 CE 8
4 CSN 7
5 SCK 13
6 MOSI 11
7 MISO 12
8 IRQ N/C
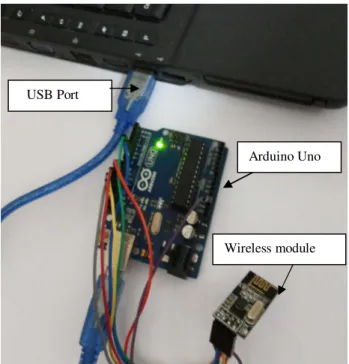
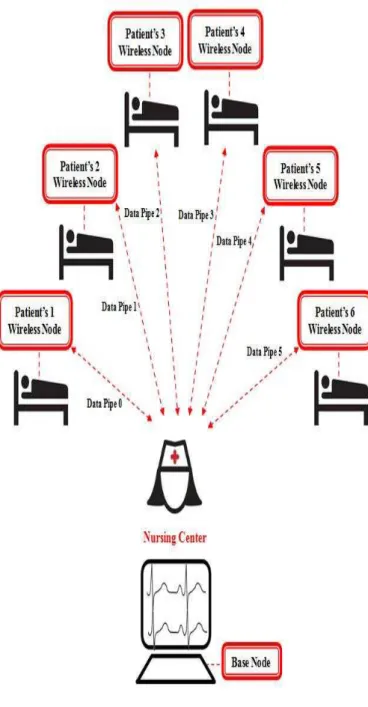
A star network is implemented with three nodes. Two wireless nodes designed for ECG data acquisition from two patients. These two nodes located in the recovery room. The third node (Base node ) is connected to the host computer at nursing center through USB port. Fig.4 shows the elements of Base node which are Arduino board and nRF24L01+ wireless module. Elements of wireless node is illustrated in fig. 5. This network is performed using Multiceiver feature, which is used in RX mode that contains a set of 6 parallel data pipes ,a pipe for each patient. Each patient pipe
has its own unique address. A logical channel in the physical RF channel is called a data pipe.
Each data pipe holds its physical address decoding in the nRF24L01. An nRF24L01 configured as primary RX or base node will be able to receive data trough 6 different patients data pipes, in Fig.6 patients data pipe will have a unique addresses but the
USB Port
Wireless module
Arduino Uno
Figure 4: Base node elements
same frequency channel is shared. This incomes that up to 6 different nRF24L01 configured for 6 patients can communicate with one nRF24L01 configured as the base node. The base node will be able to differentiate between them. Data pipe 0 of patient 6 has its own unique 40 bit configurable address. Each of data pipe for patients 1- 5 has an 8 bit unique address with the shared 32 most significant address bits. All patients data pipes can carry
out full Enhanced ShockBurst™ functionality. nRF24L01 will employ the data pipe address when acknowledging a received packet. This funds that nRF24L01 will transmit ACK with the same address as it receives payload at. In the patient device data pipe 0 is used to receive the acknowledgement, and so the received address for data pipe 0 has to be equal to the transmit
address to be able to receive the acknowledgement.
V.ECGNETWORK COMMUNICATION
When a wireless node has an ECG data to transmit, the address for the receiving node or base node (TX_ADDR) and payload data (TX_PLD) will be clocked into nRF24L01 through the SPI. The size of the base node- payload is counted from number of bytes written into the TX FIFO from the ATmega328 MCU. TX_PLD is written incessantly while holding CSN low. When the base node receives acknowledge, data pipe 0 is configured to receive the ACK packet. The address of wireless node1 which have data pipe 0 (RX_ADDR_P0) must be equal to the base node address (TX_ADDR) .
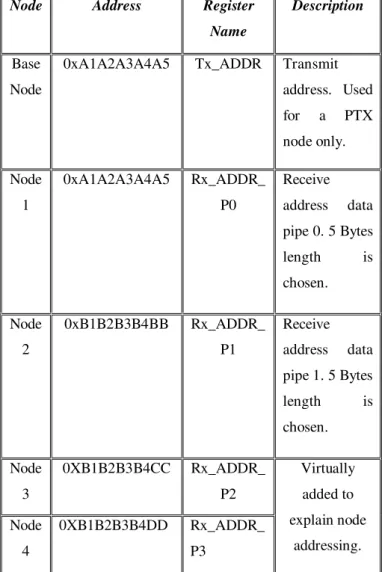
Table 2 describes the address setting of the network nodes. Next, the transition begins when CE get high pulse. nRF24L01 radio is powered up and 16MHz internal clock is started. If a valid packet is received in the valid acknowledgement time, the transmission is considered a success. This leads to removing payload from TX FIFO. If a valid ACK packet is not received in the specified time, the payload is retransmitted. Then payload in TX FIFO is NOT removed. If CE becomes low, nRF24L01 goes into standby-I . If TX FIFO is clear and CE is still high, nRF24L01 enters standby-II mode. If the Base node received a valid packet, the payload is stored in the RX-FIFO.
Then theATmega328 will then read the RX FIFO. When all the data bytes in the TX FIFOs are transmitted successfully; as a result, the MCU can push more data packets into the FIFOs.
VI.INTERFACING THE WSN WITH THE HOST
PCUSING C++
The Base node of our network is connected to the host (nursing room ) PC to collect and represent real time data . Arduino Serial Oscilloscope software used to visualize real time data. It is an open source software, written in C++ language. This application plots all 6 analogue inputs values of Arduino in ASCII as comma-separated variables within any incoming serial steam as channels on a real-time oscilloscope. It receives bytes and prints them to the terminal and transmits typed characters. The application library could plot up to 9 channels on 3 different oscilloscope with view and trigger menus.
TABLE 2:NETWORK NODES ADDRESSES
Node Address Register
Name
Description
Base
Node
0xA1A2A3A4A5 Tx_ADDR Transmit
address. Used
for a PTX
node only. Node 1 0xA1A2A3A4A5 Rx_ADDR_ P0 Receive
address data
pipe 0. 5 Bytes
length is
chosen. Node 2 0xB1B2B3B4BB Rx_ADDR_ P1 Receive
address data
pipe 1. 5 Bytes
length is
The software has been modified to be suitable for our project requirements. First, analog pins A0 and A1 are given high values for digital write. Then baud rate was employed to initialize serial communication. Number of active channels is sets to two channels (for two wireless ECG signals). Print ADC results for these channels using analogRead( ) command. Serial.write(',') command reads the two signals from serial port .
Final step is the ASCII conversion of data that read by active channels. Fig. 7 shows ECG signals for two patients plotted in Serial Oscilloscope software .
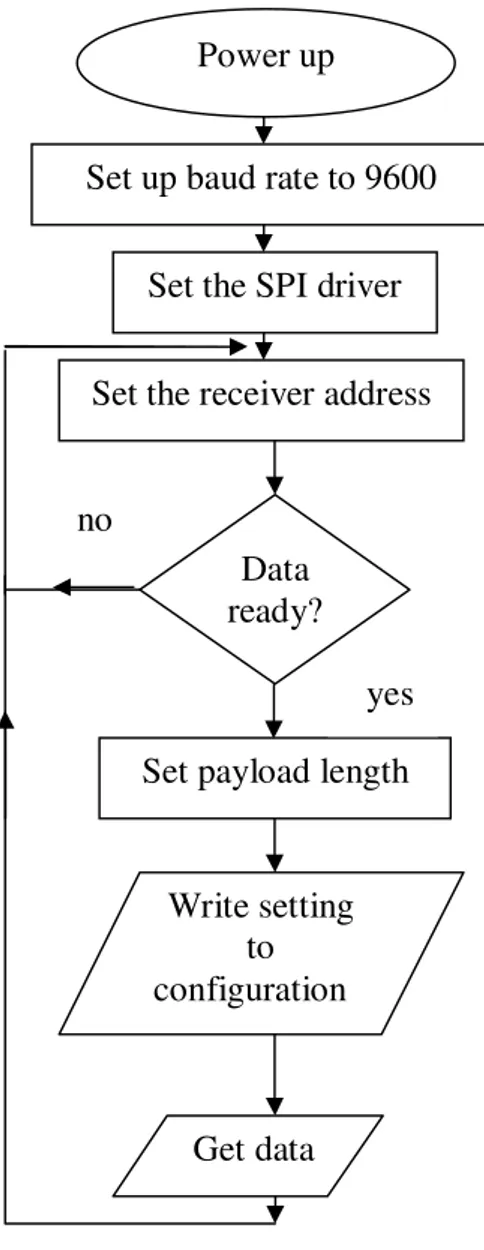
VII.THE SYSTEM SOFTWARE DESIGN Arduino boards come with a simple integrated development environment (IDE) that runs on regular personal computers and allows users to write programs for Arduino using C or C++. The system protocol could be described as shown in figures 8 and 9 as following. After importing SPI and RF module libraries and setting up the baud rate frequency of serial port to 9600.
The loop begins when the base node asks the other nodes if data ready or not. The base node set the receiver address to 5 byte long. Next the payload length is send to compute the sending packet of data. After initialization of wireless nodes ,the receiver address will be set. The loop begins when each node asks other nodes if data is ready for sending or not. Then the payload length will be set. ECG data will be read from ARDUINO analog pins . Then set the transmitter address to be recognize by the receiver . Finally , several ECG data read by analog pins are sent to the base node to digitalize them.
Figure 6 : WSN Architectural Figure 7: Wireless Network for Two Patients Plotted in Serial Oscilloscope
Power up
Set up baud rate to 9600
Set the SPI driver
Set the receiver address
Write setting to configuration
Data ready?
Set payload length
Get data yes no
Power up
Set up baud rate to 9600
Set the SPI driver
Set the receiver address
Write setting to configuration
Data ready?
Set payload length yes no
Set the transmitter address
Send analog data to TADDR
Input data from analog pin
Figure 8 : Base node flowchart
Figure 9 : Wireless node flowchart
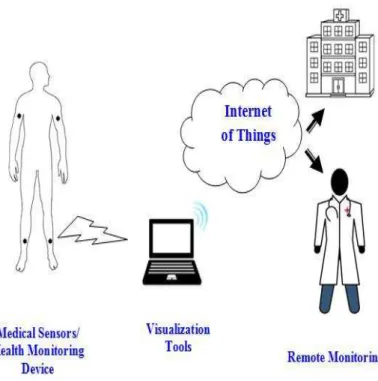
VIII.INTERNET OF THINGS FOR HEALTHCARE MONITORING
The network over the VPN Server has a public IP address with 1 Virtual Hub. This connection is accomplished only if these two computers are connected to the virtual hub at the same time.
Then specifying the host name of the computer on which the destination VPN server is running , or the IP Address , port number and virtual hub name. The proxy type of VPN server is direct TCP/IP connection (no proxy) with full duplex connection mode. A user administration including user name and password is set up for both users in the VPN. As apparent in fig. 11 , the structure of the proposed monitoring system begins with patients laying at recovering room . ECG for each patient measured through his/her wireless node attached . The wireless nodes transmit each ECG signal to the base node existing in the nursing room in the same building .
Nursing staff can monitor these signals instantly via the computer attached to the base node. Remote doctor can monitor his patients ECG signals through VPN connection. Nurse's computer considered as Client1 and Doctor's computer as Client 2. These two Clients were Connected to the VPN Server(Virtual Hub) . This is the sequence of the implemented remote monitoring system. After clients computers are successfully connected to the
Virtual Hub, their Virtual LAN cards are automatically give an IP address of 192.168.30.10, as shown in fig.12 . Fig. 13 confirms data transfer between VPN two Clients using Ping command. Transfer of ECG data from Client 1(nursing room ) to Client 2 (doctor) has been done by logging this data into Microsoft Excel file (as numbers) , then drawing it in the same application. This file is shared with Client 2 computer through this VPN.
IX.RESULTS
For testing ECG , the room should be quiet and patient should be relax . The patient required to lying comfortably on a padded surface and far from metal materials. His/her legs placed flatly , not touching one another. The head of the pad prefer to be raised no more than 45 degrees. The patient skin and electrodes should be clean and dry.
Figure 10 : IoT For Health Monitoring Figure 11: Allover System Structure
A.
Amplifier Results
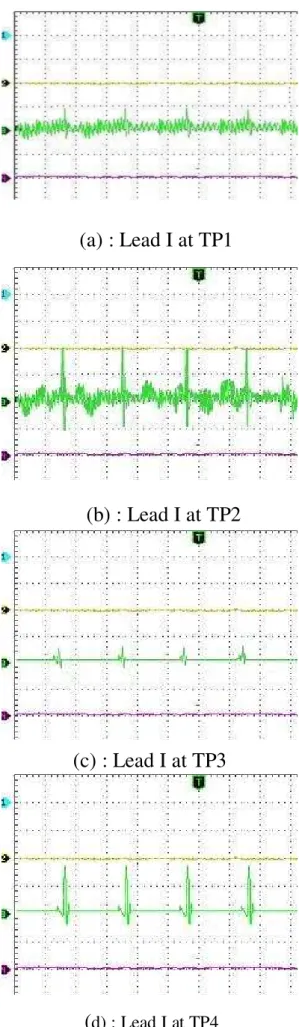
ECG Amplifier Circuit Diagram shown in fig. 2 can be divided into three stages : (A) Amplifying stage , (B) Filtering stage and (C) Gaining stage respectively. Four points in these three stages were chosen for signal test, TP1,TP2 in stage (A), TP3
in stage (B) and TP4 in stage (C). This circuit used to measure Lead I .
Lead I = LA – RA
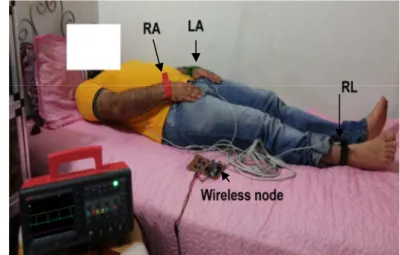
For the purpose of validation , a person is connected to the soldered board of ECG amplifier ( after adding a conductive gel to electrodes places). The red electrode is attached to his Right Arm for positive input insertion of AD 620 ( pin 3) . The negative input (pin 2) is inserted by attaching the green electrode to his Left Arm. Because interference noising the biological signals, right leg drive circuit is connected for canceling it. The black electrode connected to the right leg of the patient
.
Fig. 14 shows this connection. AtTest
Point 1
: Signal from AD620 output pin (pin 6 ) is measured using oscilloscope as fig. 15(a) shows. AtTest Point 2
:
Output signal from Right Leg Drive Circuit is shown in fig. 15(b). AtTest Point 3
:
The oscilloscope measured the output signal from Bandpass filter, as in fig. 15(c).At
Test Point 4
: The output from overall analog circuit is illustrated in fig.15(d).B. Results with C++
To display ECG real time data in the nursing room, Arduino Serial Oscilloscope software had been programmed in C++ language to open serial port and set two channels . Fig. 16
shows a screenshot of this software displaying ECG of two patients, each was plotted in a split channel and window.
C. Results with VPN
A VPN connection was established between Client 1 (nursing room ) and Client 2 ( doctor) in order to give the doctor the ability of his patients
remote monitoring. To validate the connection, two ECG signals were measured for two persons, the first person is 31 years old (male) and the second is 5 years old (female). Let's call them Patient 1 and patient 2 respectively.
Patient 1 was connected to wireless node 1 . Right Arm of Patient 1 is attached to the positive input of AD620 through red electrode. Patient's 1 Left Arm is attached to the negative input (pin 2) through green electrode. Black electrode linked his right leg to the output of Right Leg Drive Circuit . Connection of Patient 2 is the same as Patient 1 but inserted to wireless node 2, as in fig. 17. Fig . 18 shows the Microsoft Excel file transferred through the implemented VPN.
X. CONCLUSION
In this paper the design of a wireless ECG monitoring network to monitor the ECG or may be any other patient body signal. Each patient node is connected to the nurse room computer via the base node. The nurse room computer is used to monitor each patient response. Finally the nurse room computer is linked via internet to the doctors any ware through VPN network. though this work is applied for ECG monitoring only is idea can be easily extended to other patient activities.
Figure 13 : VPN Data Transfer Checking
(a) : Lead I at TP1
(b) : Lead I at TP2
(c) : Lead I at TP3
(
d) : Lead I at TP4Figure 15: Signals at The ECG Amplifier Test Points
Figure 16 : ECG Data for Two Patients Plotted with Serial Oscilloscope
Figure 17 : ECG Measurement for Two Patients
REFERENCES
[1] Nabar, Sidharth, Ayan Banerjee, Sandeep KS Gupta, and Radha Poovendran. "GeM-REM: Generative model-driven resource efficient ecg monitoring in body sensor networks." In Body Sensor Networks (BSN), 2011 International Conference on, pp. 1-6. IEEE, 2011.
[2] Paolotti, Daniela, Annasara Carnahan, Vittoria Colizza, Ken Eames, John Edmunds, Gabriela Gomes, Carl Koppeschaar et al. "Web based participatory surveillance of infectious diseases: the Influenzanet participatory surveillance experience." Clinical Microbiology and Infection 20, no. 1 (2014): 17-21.
[3] Khan, Pritam, Arnab Ghosh, Gargi Konar, and Niladri Chakraborty.
"Temperature and humidity monitoring through wireless sensor network using shortest path algorithm." In Control, Instrumentation, Energy and Communication (CIEC), 2014 International Conference on, pp. 199-203. IEEE, 2014. [4] Alsalaet, Jaafar Khalaf, Saleh Ismael
Najem, and Abduladhem Abdulkareem Ali. "Programmable low-power wireless sensors network for vibration monitoring and analysis." International Journal of Medical Engineering and Informatics 5, no. 2 (2013): 163-176.
[5] Vo, Minh-Thanh, TT Thanh Nghi, Van-Su Tran, Linh Mai, and Chi-Thong Le.
"Wireless Sensor Network for Real Time Healthcare Monitoring: Network Design and Performance Evaluation Simulation." In 5th International Conference on Biomedical Engineering in Vietnam, pp. 87-91. Springer International Publishing, 2015.
[6] Maguluri, Lakshmana Phaneendra, G. N. B. Markandeya, and G. V. S. N. R. V. Prasad. "An Efficient Android-Based Body Area Network System for Monitoring and Evaluation of Patients in Medical Care." In Computational Vision and Robotics, pp. 213-217. Springer India, 2015.
[7] Tung, Hoi Ching, Kim Fung Tsang, Ka Lun Lam, Hoi Yan Tung, Benjamin Yee Shing Li, Lam Fat Yeung, King Tim Ko, Wing Hong Lau, and Veselin Rakocevic. "A Mobility Enabled Inpatient Monitoring System Using a ZigBee Medical Sensor Network." Sensors 14, no. 2 (2014): 2397-2416.
[8] Baquero, Giselle A., Javier E. Banchs, Shameer Ahmed, Gerald V. Naccarelli, and Jerry C. Luck. "Surface 12 lead electrocardiogram recordings using smart phone technology." Journal of electrocardiology (2014).
Patients." Sensors 14, no. 3 (2014): 4618-4633.
[10] Tsai, Wen-Hsien, and Hsiao-Chiao Kuo. "The internet and healthcare in Taiwan:
value-added applications on the medical network in the National Health Insurance smart card system." International journal of electronic healthcare 3, no. 4 (2007): 417-432.