THIS REPORT WAS PREPARED BY CLÁUDIA ANDRADE, A MASTERS IN FINANCE STUDENT OF THE NOVA SCHOOL OF BUSINESS AND
ECONOMICS, EXCLUSIVELY FOR ACADEMIC PURPOSES.THIS REPORT WAS SUPERVISED BY ROSÁRIO ANDRÉ WHO REVIEWED THE VALUATION METHODOLOGY AND THE FINANCIAL MODEL. (SEE DISCLOSURES AND DISCLAIMERS AT END OF DOCUMENT)
See more information at WWW.NOVASBE.PT Page 1/37
M
ASTERS IN
F
INANCE
E
QUITY
R
ESEARCH
0 20 40 60 80 100 120 140
EDPR PSI20
EDP Renováveis
Headquartered in Madrid, EDP Renováveis is a worldwide player in the renewable energy sector, which has around 7GW of wind installed capacity spread between Europe, North America and Brazil.
EDP
R
ENOVÁVEIS
C
OMPANY
R
EPORT
U
TILITIES 7JANUARY 2013S
TUDENT:
C
LÁUDIAA
NDRADE[email protected]
There is still room for growth
But regulatory environment remains crucial
Recommendation: BUY
Vs Previous Recommendation BUY
Price Target FY13: € 5,04
Vs Previous Price Target € 4,56
Price (as of 4-Jan-13) € 4,07
Reuters: EDPR.LS, Bloomberg: EDPR.PL
52-week range (€) 2,25-4,93
Market Cap (€m) 3.554,66
Outstanding Shares (m) 872
Source: Reuters
Source: Bloomberg
(Values in € millions) 2011 2012E 2013F Revenues 1.069 1.180 1.229
EBITDA 801 847 889
Net Profit 91 105 85
EPS 0,10 0,11 0,06
EBITDA margin 75% 72% 72%
Total Assets 13.045 13.217 13.572 Net Debt (including TEI) 4.617 4.480 4.608 Interest Coverage Ratio 1,6 1,7 1,56 EV/EBITDA 11,01 10,41 9,92
EV/EBIT 25,4 25,6 27,2
Source: Company Data, NOVA Equity Research During this year of 2012, EDP Renováveis has been able to
show it is in the right path to achieve the strategic goals expressed in the Business Plan 2012-2015, having installed 457MW (at 3Q12) of the 500MW projected for the year.
The company also announced its first Asset Rotation transaction, which consisted in the sale of a minority stake in a portfolio of wind farms in the US to Borealis Infrastructure for an implicit EV/MW multiple of $1,91m, representing a premium of $0,77m/MW, according to our analysis.
Investments in new technologies are in EDPR’s future
plans. The company announced the start of construction of its first Solar PV project of 39MW in Romania, which had a positive impact
of €0,02/share in our valuation.
However, a relevant threat for the company is regulatory risk, which has increased, mainly in Spain, where a tax of 6% on revenues generated from electricity might entry into force, applying also to clean energy resources. This tax affects both new and old wind farms – resulting in a negative impact of 0,16€/share. The introduction of retroactive feed-in-tariffs cuts, which would be the worst scenario for Spanish assets, would have a negative impact of
€1,25/share.
To reach our target price of €5,04/share, we analyzed thecurrent environment in the sector, attributing 70% to our Base-case scenario and 30% to a Stressing Scenario.
EDPRENOVÁVEIS COMPANY REPORT
PAGE 2/37
Table of Contents
I. Executive Summary ... 3
II. Company Overview ... 4
Operating Performance ... 5
Financial Performance ... 7
Shareholder Structure and Dividend Policy ... 9
III. Valuation ... 10
Forecasting Operating Activities ... 11
Forecasting Investing Activities ... 12
Weighted Average Cost of Capital ... 13
Scenario Analysis ... 16
Multiples Valuation ... 16
IV. Challenges, Risks and Opportunities ... 18
Global Sector Outlook ... 18
Spain ... 20
Portugal ... 22
Poland and Romania ... 23
Brazil ... 24
US... 25
New Opportunities: Solar PV ... 27
V. Final Recommendation ... 29
EDPRENOVÁVEIS COMPANY REPORT
PAGE 3/37
Executive summary
The present reports aims at providing a valuation of EDP Renováveis’ shares. In
order to find our target price, we performed a Sum-of-the-Parts approach, valuing each country separately.
The company installed 806MW of new capacity in 2011. Installed capacity grew by 63% from 2008 until the end of 2011. It has achieved load factors within the average of the peer companies analyzed (25% in 2011) and has been able to keep competitive Operating and Maintenance Costs, which allowed EDPR to present an EBITDA margin of 75% in the last two years. It has also been able to keep a strong balance sheet (Debt-to-equity ratio of 73%, lower than the average of the industry) but this financial position might be changing as measures such
as interest coverage ratio (went from 3 in 2008 to 1,6 in 2011) and Altman’s Z -score (from 4,54 in 2008 to 4,01 in 2011) indicate. To keep the solid position as well as the ability to invest in future growth, EDPR is starting to sell assets. Until now, the strategy has been profitable – we estimate a premium of $0,77m/MW in the transaction with Borealis Infrastructures and a premium of €0,41m/MW in the announced sale of Portuguese Assets to China Three Gorges1.
The main business risk that EDPR faces is the high exposure to mature markets as US, Spain and Portugal, which together represented 86% of EDPR’s EBITDA
in 2011. Although concerns regarding renewables incentives were, for now, dissipated in the US and Portugal2, there is still low visibility in Spain, due to the
high tariff deficit, which amounted to €24.582m in 2010 and the increasing debt.
In an attempt to rebalance the electrical system and national accounts, an extra tax of 6% on revenues from energy generation will be applied, which as an effect of - € 0,16/share.
Through an analysis of the current situation of the sector, we considered that there is still room for new opportunities: equipments costs continue declining3 and recent BNEF studies indicate that onshore wind might reach parity with coal, natural gas and nuclear power by 2016. At the same time Solar PV competitiveness increases4. EDPR already started its first Solar PV project in Romania of 39MW, which added € 0,02/share to our valuation. Overall, we attributed a 70% probability for our base-case scenario and 30% probability for our Stressing Scenario5, achieving a target price of € 5,04/share.
1 The transaction is subject to regulatory approvals.
2 In the US, the extension of the Production Tax Credits, a main incentive to the sector, was announced on the 1st January 2013, while in
Portugal the Government reached an agreement with the wind industry that allowed feed-in-tariffs to be extended.
3 Wind turbine prices are around 25% cheaper compared with 2009. 4 LCOE declined around 20% from 2011 to the 3Q2012.
5 The description of each scenario is made further on the Valuation section.
EDPR is trying to reduce its exposure to core markets risks: approximately 72% of planned installed capacity for the period 2013-2015 is
located in new growth
platforms, as Romania,
Poland and Brazil.
We performed 8 DCF’s and an EV/MW multiple valuation for Italy’s business. We built two scenarios: a base-case - based on the assumption that no retroactive changes to regulations will take place
and following EDPR
Business Plan – and a
Stressing-Scenario – feed-in-tariffs are retroactively cut and no more additions are made in the next years.
“The most important ingredient for the long-term success of wind industry is stable, long-term policy.”
EDPRENOVÁVEIS COMPANY REPORT
PAGE 4/37
Iberdrola NextEra EDPR Longyuan Acciona
27,9 24,6 16,8 13,4 12,7
0,0 20,0 40,0 60,0 80,0 100,0 120,0
Company Overview
EDP Renováveis is a leading company in the clean energy sector, being especially focused on wind power generation. It is a subsidiary of Energias de Portugal (EDP), the Portuguese largest utilities’ company. EDPR is majority owned by its parent company (77,5% stake) and it went public in 2008, when it became a member of PSI-20. This process followed the example of Iberdrola Renovables and EDF Energies Nouvelles, that went public in an attempt to achieve higher visibility in the markets. Nevertheless, both IBR and EDR Energies Nouvelles were remerged with the respective parent companies in 20116.
The business of EDPR is mainly focused on onshore wind energy, presenting a portfolio of wind farm operations spread globally, being possible to highlight three main divisions: North America, Europe and Brazil. In the near future, the management has already revealed that the company will probably dive in new green technologies, such as offshore wind and solar PV – in fact, the first project in this technology is already being constructed in Romania and should be operational in 1H13.
Chart 3: EDPR’s Worldwide Installed Capacity and Pipeline
Source: EDPR Investor Presentation, March 2012
6 In fact, the slowdown in regulatory frameworks of renewable energy in Europe and the financial crisis led to significant changes in the
sector, what potentiated the remerger of these companies with their parents. Iberdrola considered that the needed visibility was achieved (5GW of capacity were installed by IBR since IPO), but share prices were considered below the potential for the business (in fact, IBR share prices decreased around 66% since the IPO), making it a tempting target. Moreover, synergies in this operation are estimated to be around €20 million per year, coming especially from greater operational and financial resources for future growth.
Chart 1: Top Wind Players 2011 (GWh)
Source: NOVA Equity Research
EDPRENOVÁVEIS COMPANY REPORT
PAGE 5/37 0
20 40 60 80 100 120 140
NEX S&P500
0 20 40 60 80 100 120 140
EDPR NEX
Along with its peers, the company has been able to take advantage of the markets where incentives to clean energy were more developed, in order to subsidize the high costs of generation – such as Spain, Portugal and US.
However, the confidence in the clean energy business and in the sustainability of current incentives has decreased especially due to the impact of world financial crisis. Chart 4 suggests the lack of confidence in the sector during 2011/2012, evidenced by the underperformance of NEX Index7 in comparison to S&P500. It takes time for clean energy to achieve competitiveness relative to other sources of power and cuts in incentives are one of the main challenges deeply analyzed in Section IV.
Operating Performance
It is relevant to analyse the position of EDPR in the sector and how it compares with the main players in different perspectives. Annex A provides a brief description of the companies used in this analysis.
In what operational performance is concerned, a main value driver in this business is the load factor achieved. In our analysis, we considered the annual average load factor as the percentage of time that wind turbines are effectively generating energy. As such, the load factors computed already include technical availability rates and are the implicit values for the installed capacity and energy generation reported in each year. Chart 6 provides a comparison between EDPR performance and some of its peers.
Chart 6: Average Annual Implicit Load Factors (%)
Source: NOVA Equity Research
7 Wilderhill New Energy Global Innovation Index – composed by companies focused on generation and use of clean energy worldwide.
23% 25%
22%
28%
23% 24%
27%
25%
19% 18%
2010 2011
EDPR ENEL Green Power Iberdrola Acciona Longyuan
Average: 23% Average: 24%
Chart 4 - Comparison between NEX and S&P500 performance Source: Bloomberg
EDPRENOVÁVEIS COMPANY REPORT
PAGE 6/37
75%
62%
70%
62% 75%
63% 70% 67%
EDPR Iberdrola Acciona Fersa Renewables
2010 2011
1,07 1,17
1,23
Iberdrola EDPR Acciona
12,70%
9%
8,70% 8% 7,80% 7,70%
Vestas
Sinovel Goldwind
Gamesa
Enercom GE Energy 75% 75% 75% 75%
72% 72% 73%
EDPR presented implicit load factors of 23% and 25% in 2010 and 2011 respectively, which were not the highest values in our benchmark comparison. In 2010, Acciona was able to achieve a load factor of 27% and, in 2011, ENEL Green Power was able to achieve a load factor of 28%. This performance indicator is mainly dependent on natural factors – wind availability – but also on site selection criteria and technical expertise, which can explain the small differences between companies.
In what concerns the profitability of EDPR’s business, the company has been
able to achieve high EBITDA margins (75% in 2011), which are expected to remain relatively stable in the next years, as suggested by Chart 7. Since many of the current players in the renewable energy market do not produce only wind power, the profitability of their businesses is not directly comparable to EDPR. As such, only for the companies which we were able to find segmented values for the wind power generation activity, a comparison between EBITDA margin was also performed – Chart 8. EDPR presents the highest EBITDA margin, which was of 75% both in 2010 and 2011.
This competitive advantage might be related with Operating Expenditures, which are mainly constituted by Operations and Maintenance activities (representing around 75% of total operating costs) and Personnel Costs. EDPR’s priority has been to manage as close as possible warranty contracts with wind turbine suppliers, which should result in a full-scope agreement or in a Modular Maintenance Model – in-house activities -, dependently on what seems to be more profitable. Currently, EDPR has a Master Supply Agreement with Vestas, a global wind turbine manufacturer – 8% global market share in 2011-, with flexibility to choose different wind turbine models and to extend the 2 years of Operating and Maintenance Agreement – to 5 or 10 years – depending on the project. Through these cost management actions, EDPR has been able to keep competitive Operating Expenditures, reflected in high margins.
In what concerns Capital Expenditures per MW installed, according to our analysis, EDPR is being able to keep competitive values of investment (€1,17m
/MW in 2011), although, in our comparison group, Iberdrola was able to achieve an even more competitive value of € 1,07m/MW.
Given this analysis, one might conclude that EDPR is performing on the average of the sector in what concerns technical performance and investment costs. The capacity for managing operating and maintenance costs seems to represent a competitive advantage for the company, allowing it to achieve higher EBITDA margins than the players considered.
Chart 7: EDPR’s EBITDA margins
evolution
Source: NOVA Equity Research
Chart 10: Average Cost per MW installed (MW) - €m
Source: NOVA Equity Research Chart 8: EBITDA Margin comparison (%)
Source: NOVA Equity Research, Companies Reports
Chart 9: Main players in the wind turbine manufacturing 2011 (% market share)
EDPRENOVÁVEIS COMPANY REPORT
PAGE 7/37 Spain;
29%
Portugal; 13% ROE; 11% US; 46%
Brazil; 1%
Breakdown Capacity 2011
Spain; 23%
Portugal; 11% ROE; 22%
US; 42% Brazil; 3%
Breakdown Capacity 2015E
Analyzing now the breakdown of EDPR’s installed capacity according to the
remuneration scheme, the proportion of installed capacity under no legal protection or remuneration scheme was around 27% in 2011 and, according to our estimates and to the information made available by the company, it has tendency to decrease in the following years. Most common protections are
PPA’s, Feed-in-tariffs and Green Certificates.
This structure gives EDPR long-term visibility, by reducing its exposure to volatility in energy pool prices.
Chart 11: Breakdown of Installed Capacity By Remuneration Scheme
Source: Company data, NOVA Equity Research
In addition, due to some uncertainty regarding the remuneration schemes of new projects in the more mature markets - the US, Spain and Portugal -, a relevant business risk, further analyzed, EDPR has already adjusted its business plan for 2013-2015, in order to concentrate its future growth in emerging markets. New growth platforms will be focused on Eastern Europe and Latin America. In fact, around 72% of the projected growth for the next three years is located in Poland, Romania or Brazil. Chart 12 shows the expected evolution of the breakdown of installed capacity by market. EDPR is also studying the possibility of entering in new markets, for example, Morocco or Mexico.
Financial Performance
In 2011, around 92% of EDPR’s financial debt (not including Tax Partnerships) was contracted at a fixed interest rate and around 80% of it only matures after 20188. Overall, and including Tax Equity Investors, which should be considered remunerated debt, EDPR achieved, in 2011, a Net Debt/EBITDA ratio of 5,8x, which has been constant since 2009 – see Table 1.
8 Source: EDPR
0% 10% 20% 30% 40% 50% 60% 70% 80% 90% 100%
2008 2009 2010 2011 2012E 2013E
Pool PPA
Green Certificates FiT
Remuneration Schemes: Feed-in-tariffs: Long-term contracts (typically 15-25 years) that provide energy producers with a cost-based tariff for the energy produced from renewable sources.
Power Purchase
Agreements: defines all the commercial terms for the sale of electricity between two parties during a long-term period, typically lasting around 20 years.
Green Certificate: it is a commodity that can be traded and a guarantee of origin of the electricity provided. Typically one Certificate represents one MW of clean energy produced, but it can depend on the technology. National governments establish quotas that distributors must fulfill of green certificates, in order to promote investments.
Chart 12: Breakdown of installed capacity by market (%)
EDPRENOVÁVEIS COMPANY REPORT
PAGE 8/37
107,22% 95,88% 84,83% 73%
Spain Western Europe World EDPR
Boundary Values Z''-score Z<5,85 Safe Zone 4,35<Z<5,85 Grey Zone Z<4,35 Distress Zone
2008 2009 2010 2011 Net Debt/EBITDA 4,9 5,8 5,8 5,8 Debt/Total Assets 25% 32% 35% 37% Interest Coverage Ratio 3,0 3,2 1,6 1,6
Altm an's Z-score 2008 2009 2010 2011
Total Assets 9.397 11.294 12.835 13.045
Working Capital -48 -140 -32 -193
X1 -0,005 -0,012 -0,002 -0,015
Retained Earnings 194 306 354 414
X2 0,02 0,03 0,03 0,03
EBIT 232 231 290 347
X3 0,02 0,02 0,02 0,03
Market Cap 4.364 5.783 3.783 4.124
BV Total Liabilities 4.206 5.966 7.442 7.591
X4 1,04 0,97 0,51 0,54
Z-Score 4,54 4,41 4,01 4,01
The Debt/Equity Ratio is lower than the average of the sector of utilities, considering Spanish, Western Europe and World companies – see Chart 13. However, the interest coverage ratio has decreased from 2008 to 2011, from 3 to 1,6, which reveals some loose of capability of the company to pay interest expenses on its debt and the changes in capital structure towards more debt –
as suggested by Chart 14. It is worthwhile noticing that the average interest coverage ratio of the industry is 2,51 using Spanish Utilities as benchmark and 2,87 worldwide9.
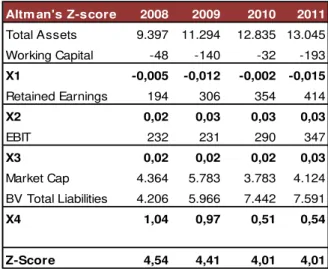
We also computed Altman’s Z’’-score for EDPR10:
Table 3: Altman’s Modified Z’’-score for EDPR
Source: NOVA Equity Research
Although there are varied limitations of this measure, it allows us to verify that
EDPR’s score has decreased in the last years, which should reflect an increase in the probability of financial distress.
Another relevant aspect of EDPR’s financing sources is the aforementioned Tax Equity Investors, which represented 13% of total liabilities in 2011. Tax benefits are one of the main instruments used by U.S. federal governments in order to promote the adoption of clean energy technologies – mainly Production Tax Credits or Investments Tax Credits. However, these incentives have a higher impact the higher the profitability of the clean energy producer. As such, many players choose to find investment partners that generate enough income to benefit from these credits. Tax equity investors, which are generally financial institutions, allow for companies with low tax exposure to benefit from government incentives to renewable energy.
9 Source: Bloomberg
10Altman’s Z-score is a credit-strength test based on business ratios computed from financial statements. X1 corresponds to Working
Capital/Assets, X2 is Retained Earnings/Assets, X3 is EBIT/Assets, X4 is Market Value of Equity/Book Value of Debt. Here we used a modified version of the original model (Altman 2000).
Table 1: EDPR Financial Indicators Source: NOVA Equity Research
Chart 13: Debt to Equity Ratio EDPR vs. Utilities
Source: Bloomberg
EDPRENOVÁVEIS COMPANY REPORT
PAGE 9/37 45% 53% 58% 58%
55% 47% 42% 42%
2008 2009 2010 2011
Debt Equity
77,5% 22,5%
EDP Free Float
Holder %
MFS Investment Management 2,85% BlackRock Investment Management 1,32% Norges Bank Investment Management 1,32% Impax Asset Management 0,58% BES VIDA Companhia de Seguros S.A. 0,27% Allianz Global Investors (Taiw an) Ltd 0,24%
Nevertheless, the financial crisis in 2008 had an impact in the most common tax equity investors. As these partners became scarce, the asked yields jumped from around 6% to values around 9%11.
In this context, and facing increasing values of debt, EDPR is now pursuing an Asset Rotation strategy in order to finance future projects and keep a strong balance sheet relative to the sector. The main idea of this strategy is to sell assets, although keeping operating control of them, using those funds to reinvest in new projects.
The company already executed its first transaction of this type through an agreement with Borealis Infrastructures, which manages investments on behalf
of one of Canada’s largest pension funds12. A 49% equity shareholding in a portfolio of wind farms in the US with 599MW of installed capacity was sold for $230m. According to EDPR, the implied total value of the portfolio is $1.446m. Through our analysis, this transaction represents an implied EV/MW multiple of $1,91m – a premium of $0,77m per MW over the EV/MW 2011 we estimated through our valuation of US assets.
More developments are expected regarding Asset Rotation, especially concerning the agreement with China Three Gorges, which is expected to occur in 2013, and to involve Portuguese assets (615MW of installed capacity, which represented 9% of total EDPR’s portfolio in 2011). The conditions of the transaction were already announced13 - although they are still under approval -, and the deal should comprise the sale of 49% of equity shareholding, as well as 25% of outstanding shareholders loans of EDPR PT. The value announced for
the total consideration was €359 million. The implied EV/MW multiple of the
transaction is €1,57m, which represents a €0,41m premium per MW. Shareholder Structure and Dividend Policy
EDPR is a subsidiary of the Portuguese Group EDP, which represents 77,5% of the shareholder base – Chart 15. In what concerns the remaining 22,5%, they are Free Float and are mainly constituted by Institutional Investors, rather than Private Investors (these last ones represent only 20% of the Free Float). A list of the more relevant Institutional shareholders is provided in Table 5.
In what dividend policy is concerned, the company intends to start paying dividends from 2013 onwards14. However, it should be noticed that EDPR previous intentions to distribute dividends did not happen.
11 Source: Bloomberg New Energy Finance
12 Ontario Municipal Employees Retirement System (“OMERS”) 13 According to 20-12-2012 EDPR’s press release.
14 25% to 35% payout
Chart 14: EDPR Capital Structure Source: EDPR
Table 5: Institutional Investors Source: FactSet Research Systems
Chart 15: EDPR’s Shareholder
EDPRENOVÁVEIS COMPANY REPORT
PAGE 10/37 37%
14% 12% 35%
2%
Spain Portugal RoE US Brazil
52% 48%
48% 52%
EDPR Comparables
Debt Equity
Method Currency
Spain DCF Euro
Portugal DCF Euro
France DCF Euro
Belgium DCF Euro
Poland DCF Zloty
Romania DCF Euro
Italy EV/MW Multiple Euro
US DCF Dollar
Brazil DCF Real
One might argue that EDPR strategy in this matter has been to retain gains in order to reinvest in growth and lead to capital gains for shareholders. Indeed, EDPR has pursued the development of new projects in emerging economies and technologies, making sense not to distribute dividends during that expansion period. However, since the management has been delaying this first distribution for some time, we expect it to really happen in 2013, since it would also be an important indicator to investors of management confidence in future growth and in the profitability of new projects, at the same time balancing all the stakeholders’ interests.
Valuation
EDP Renováveis operates in a market that, until now, has been very regulated and protected. This means that, for forecasting and valuation purposes, it makes sense to value the company separately by each business unit, in order to take into account the different remuneration schemes, legal frameworks and prices in each geographic unit. As such, we assumed that the most appropriate methodology to be used was a Discounted Cash-Flow model for each country business, performing a Sum-of-the-Parts Valuation, in order to find the total Enterprise Value of EDPR. We considered the Discounted Cash-Flow model to be appropriated, although the main assumption of this method is that the capital structure remains stable over time. In the case of EDPR, this might not decrease the feasibility of the model, since the current capital structure is already in line with the main comparables capital structure15, and major changes in the future are not expected (see Chart 17).
Therefore, we performed 8 different DCFs, each one estimated and discounted in the adequate currency, and following assumptions in the main operational indicators. The final values of each business unit were, at the end, converted to Euros using the Spot-rate method16. The business in Italy, due to the fact that it is a starting project and no operational data is available so far17, was valued using the EV/MW multiple computed for France, since we verified that the market risk is comparable and the remuneration scheme is similar.
In the next Sections we briefly describe the general assumptions for the main variables considered in the valuation model.
15 The comparables used for this purpose are the same used for beta estimation – Table 11.
16 The projected foreign cash flows are discounted at the foreign cost of capital. The present value of the cash flows is converted to
domestic currency using the spot exchange rate.
17 There are 40MW under construction, which were assumed to be operating in 2013.
Chart 16: EBITDA Breakdown (2011)
Source: EDPR
Chart 17: Capital Structure at market values
Source: Bloomberg
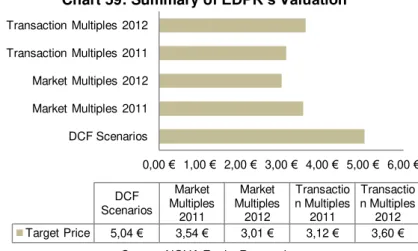
Table 6: Valuation
Methodologies
EDPRENOVÁVEIS COMPANY REPORT
PAGE 11/37 7.737
10500
0 5.000 10.000 15.000 3Q 2012
2009
Forecasted EBITDA margin (%) 2011 2012E 2013E
Spain 77% 77% 76%
Portugal 80% 83% 82%
France 72% 75% 70%
Belgium 78% 81% 67%
Poland 78% 78% 73%
Romania 73% 84% 80%
US 65% 68% 73%
Brazil 67% 69% 63%
Forecasting Operating Activities
Installed capacitywas estimated based on present capacity and future additions projections announced in the Business Plan 2012-201518.
The forecasted installed capacity is used to estimate energy produced, taking into account load factors (which we assumed to incorporate technical availability too). Load factors measure the fraction of time that turbines are, effectively, producing energy. For valuation purposes, we used the implicit load factor we computed for the previous years and we assumed load factors to remain stable over the upcoming years, in each country, since most of it is explained by natural factors and technical expertise19.
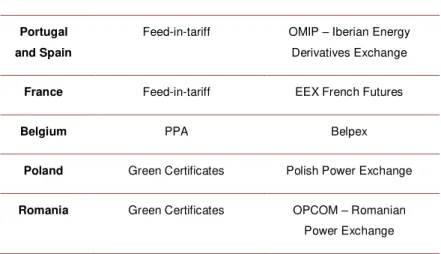
From 2013 onwards, we also took into account the current different incentive schemes and regulatory frameworks. In our base-case scenario, we used the current legislation to explicit forecasted years. For the Continuing Value, we assumed that incentives to clean energy will come to an end and market prices were used in each market, according to different adequate proxys –Table 8.
Table 8: Main Assumptions for Market Prices
Current Remuneration Market Prices
Portugal and Spain
Feed-in-tariff OMIP – Iberian Energy Derivatives Exchange
France Feed-in-tariff EEX French Futures
Belgium PPA Belpex
Poland Green Certificates Polish Power Exchange
Romania Green Certificates OPCOM – Romanian Power Exchange
Source: NOVA Equity Research
Installed capacity and prices are the key inputs to estimate revenues for the future. In what concerns Operating Expenses, these are mainly constituted by Operations & Maintenance related to wind turbines (historically, these costs have represented around 75% of total Operating Expenditures) and Personnel Costs. The service of O&M is generally provided by wind turbines manufacturers and these companies have been competing toughly in what concerns these services
18 Chart 18 shows us that 2009 EDPR projections for installed capacity in 2012 were quite optimistic and this target was not met.
However, in 2010 EDPR revised these estimates and Table 8 shows us that the company followed in 2011 and 2012 the guidelines of the Business Plan announced in 2010. As such, we considered the estimated installed capacity in the new Business Plan as a good proxy for future projects.
19And here we assume EDPR will be able to keep its know-how in the business.
Chart 18: Target for 2012 EDPR’s
installed capacity (as announced in 2009) vs. current installed capacity
Source: EDPR
Table 7: Comparison between
Business Plan 2010-2012
goals and verified additions (values for 2012 refer to 3Q) Source: EDPR
Table 9: Breakdown of Forecasted EBITDA margin Source: NOVA Equity Research
Business Plan 2010-2012
(M W) Target Verified
EDPRENOVÁVEIS COMPANY REPORT
PAGE 12/37 551 838 938
1.369 1.801
2.232
0 500 1.000 1.500 2.000 2.500
2010 2011 2012 2013 2014 2015
6% 8%
8%
22% 18% 10%
28%
Portugal France Belgium Poland
Romania Brazil US
Forecasted Installed Capacity 2011 2012E 2013E Spain 2.201 2.311 2.311
Portugal 939 971 1.014
RoE 838 938 1.369
US 3.422 3.637 3.853
Brazil 84 84 153
contracts, as they become more important in their revenue mix. The increasing competition has pushed prices down and, according to a recently published report, O&M costs fell 38%, comparing data from 2008 to 201220. The values estimated were linked to installed capacity, since O&M costs are mainly dependent on the number of wind turbines installed. By doing so, we ended up achieving values quite in line with the reference ones presented by EDPR’s
management in the Business Plan 2012-2015, achieving the target for operating expenses of 0,02€m per GWh generated. Personnel Costs are linked to the number of employees and to the average cost per employee, which grows according to inflation.
Forecasting Investing Activities
Another relevant step in the valuation process is to estimate investing activities,
which, in EDPR’s case, are mainly related to Capital Expenditures.
CapEx is mainly constituted of wind turbines and related electrical equipment, hence, we did not consider any relevant differences in CapEx/MW from country to country, since manufacturers are global and do not vary significantly in each market. The value per MW follows the indications in the Business Plan, and is considered to rise with inflation throughout the years.
Another relevant investing activity that should be estimated is related to Repowering21. There are two main options at the end of the useful life of a wind farm: either the company liquidate the remaining assets, for example, land property, or it invests in the repowering of the wind farms, in order to continue operating.
In the case of EDPR, we considered that wind farms will continue operating in our base-case scenario, which, according to the Annual Report 2011 of the company, seems to be its main goal22. This involves an investment in Repowering at the end of the useful life of the asset23, which we assumed to be 75% of initial investment in those assets24. This investment is explicitly estimated until 2022. From that year on, we estimated Continuing Value using an average CapEx per year related to Repowering, according to the installed capacity in each country.
Other investing activities were Net Working Capital, which we estimate through Days/Sales or Days/Opex ratios, and assumed to be stable in the future.
20“Wind farm Operations and Maintenance Costs Plummet” – Bloomberg New Energy Finance, 1 November 2012
21 This Repowering process is translated in the replacement of aging wind turbines by latest turbine technology, so that the com pany is
able to continue using the available wind resource at the most.
22“Our portfolio of wind farms is planned to be in operation for many years. Even at the end of the wind farms useful life, they may be
repowered and their useful life extended”. EDPR’s Annual Report 2011.
23 Wind farms have a useful life of 25 years.
24 Typically, wind turbine costs represent around 75% of CapEx per MW installed.
Chart 19: Total Installed Capacity Forecasted for Rest of Europe (France, Belgium, Poland and Romania)
Source: NOVA Equity Research
Chart 20: Breakdown of Total CapEx for the period 2013-2015 Source: NOVA Equity Research
Table 10: Breakdown of Forecasted Installed Capacity
EDPRENOVÁVEIS COMPANY REPORT
PAGE 13/37 y = 0,4994x - 0,0095
R² = 0,1097
Com pany Country Raw Beta Tax Rate Market Cap EV E/(D+E) D/D(+E) D/E Unlevered
Fortum Oyj Finland 0,74 16% 12.748 21.076 60% 40% 65% 0,54
ENEL Green Pow er Italy 0,84 35% 7.000 12.915 54% 46% 84% 0,70
Acciona Spain 1,00 24% 3.333 11.319 29% 71% 240% 0,39
Iberdrola Spain 1,18 16% 24.298 51.905 47% 53% 114% 0,66
Average 0,57
Median 0,57
EDPR Spain 1,23 24% 3576 7449 48% 52% 108% 0,77
Levered Beta EDPR 0,91
Weighted Average Cost of Capital
The appropriate discount rate that allows us to discount the free cash flows in our model is the Weighted Average Cost of Capital. This rate must be seen as a weighted average return expected by each investor of the company, which, in this case, corresponds to equityholders, debtholders and, also, Institutional Partners (which are investment partners that many players in the sector find in order to take benefit from the tax credits incentives in the US, as pointed out in the previous sections). So, in order to find the WACC for each EDPR business unit, we need to find an appropriate cost of equity, cost of debt and cost of Tax Equity Partner.
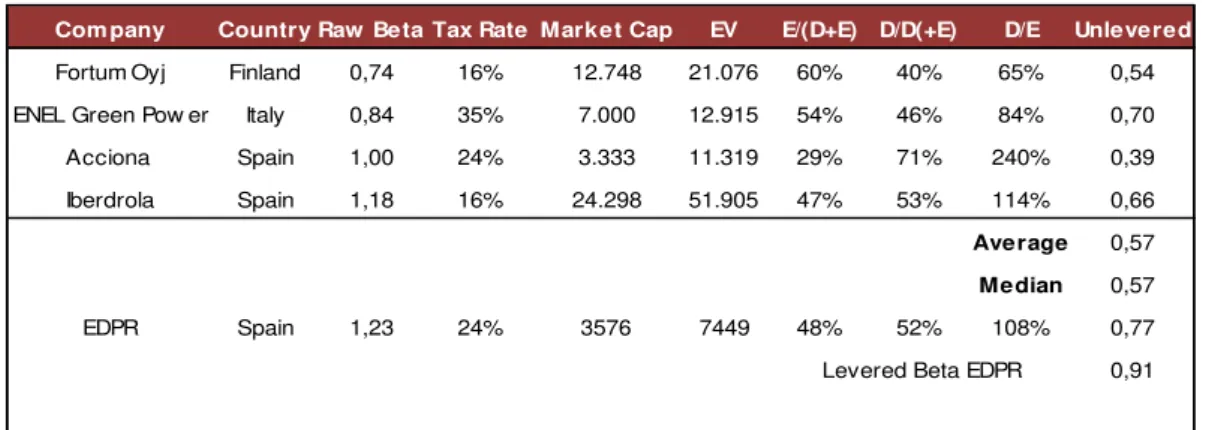
In order to find the appropriate cost of equity, we used the Capital Asset Pricing Model, as it has already proof to work quite well in valuation models. In an attempt to find the adequate beta for EDP Renováveis, we run the regression of
EDPR’s stock returns on different global indexes, such as S&P500 or Eurostoxx, and then adjusted this raw beta, according to Bloomberg’s beta smoothing technique25, since it provides a long-term approach for this parameter, assuming that it should converge to the return of the market. However, since we obtained standard errors of 8% in these regressions and low R2, we considered that it should be more relevant and reliable to perform an analysis of the industry beta,
since we might be underestimating EDPR’s one. In order to do that, we took
comparables’ betas, which we unlevered and levered again at the comparable’s
average capital structure26.
Table 11: Estimating EDPR Beta using Comparables
Source: NOVA Equity Research, Bloomberg
25 Adjusted beta= 0,33x1 + 0,66xRaw Beta
26 Since EDPR does not have corporate bonds, we estimated the market value of debt through the price of a bond with maturity of 6,6
years –which is the average maturity of EDPR’s debt – and coupons equal to the value of interest expenses for 2011, discounted at the cost of debt.
Chart 21: EDPR’s Beta
EDPRENOVÁVEIS COMPANY REPORT
PAGE 14/37
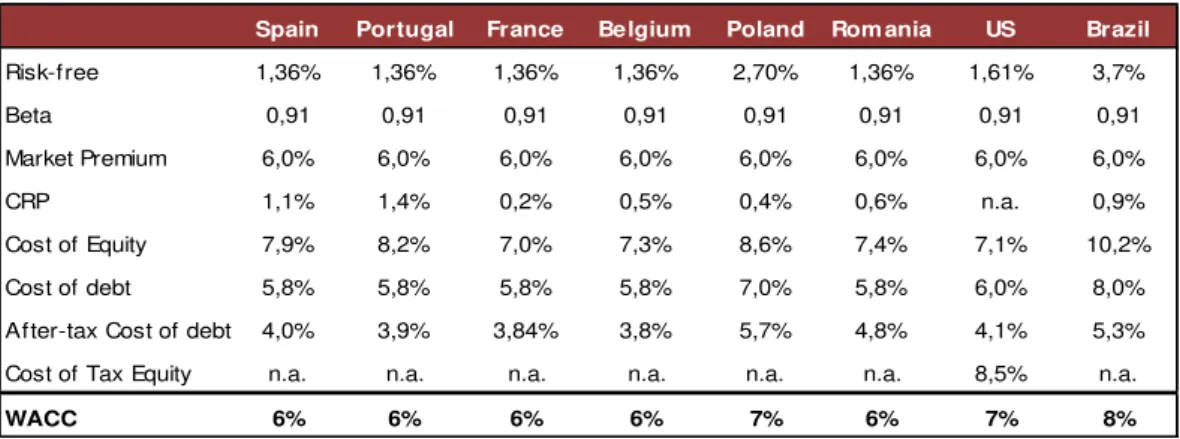
The market premium was considered at 6%, which goes fairly in line with most common finance literature in this issue and we assume the same market risk premium for every country. The rationale behind this assumption is that capital markets are global and market premium is not expected to differ significantly from one country to another – otherwise, there would be capital flows to adjust for that arbitrage opportunity.
In what concerns the risk-free rate, we find it useful to take into consideration the different locations of the business, taking different rates as reference. We used US 10-year Government Bond as a risk-free rate for Brazil and 10-year German Bund for European countries. Since we are valuing businesses in different currencies, we should adjust these risk-free rates to each foreign currency – in accordance with the currency in which Free Cash Flows are denominated. The mechanism used was based on the Covered Interest Parity27 theory that relates spot and forward exchange rates with interest rates, thus accounting for inflation adjustments.
The Country risk-premium, which is commonly added to the CAPM equation, is mainly related to the specific sovereign risk of a country. However, one should not disregard the fact that one of CAPM main assumptions is that only risks that cannot be diversified away by investors should be considered in the discount rate
– what we usually call systematic risk. As a result, adding a markup relative to country risk in the CAPM equation using proxys such as credit default spreads is equivalent to assume that all that risk inherent to a country is non-diversifiable, which can be a too strong assumption. Given that, we based our Country Risk Premium estimates on a methodology developed in a way that it intends to modulate the total risk by its systematic component – Systematic Country Risk Modulator28. Differently from what is generally used, we added the markup to the CAPM equation but modulated by a factor, 29, which tries to capture the systemic component of country risk. The new CAPM equation that allow us to estimate the cost of equity will then be:
- (1)
The proxy for total CRP was estimated through default spreads for each country30, based on Moody’s sovereign ratings.
27 Interest Rate Parity is a no-arbitrage condition, which gives an equilibrium point where investors should be indifferent between interest
rates in two different countries.
28 We based our estimation for CRP on the research “A Practical Approach for Quantifying Country Risk”, Jaime Sabal, Professor of
Finance at ESADE.
29 will be equal to the square of the beta computed for the local stock index versus a global index, multiplied by the square of the
division of standard deviation of the global market returns by the standard deviation of the local index returns.
30 Based on Damodaran
EDPRENOVÁVEIS COMPANY REPORT
PAGE 15/37 Local Index Country Beta vs S&P500 s Local s S&P
PSI20 Portugal 0,80 0,03 0,02 0,43
IBEX35 Spain 1,21 0,04 0,02 0,54
CAC40 France 1,17 0,03 0,02 0,76
BEL20 Belgium 0,94 0,03 0,02 0,66
WIG20 Poland 0,71 0,03 0,02 0,44
BET Romania 0,68 0,03 0,02 0,28
IBOV Brazil 0,88 0,03 0,02 0,54
Spain Portugal France Belgium Poland Rom ania US Brazil
Risk-free 1,36% 1,36% 1,36% 1,36% 2,70% 1,36% 1,61% 3,7%
Beta 0,91 0,91 0,91 0,91 0,91 0,91 0,91 0,91
Market Premium 6,0% 6,0% 6,0% 6,0% 6,0% 6,0% 6,0% 6,0%
CRP 1,1% 1,4% 0,2% 0,5% 0,4% 0,6% n.a. 0,9%
Cost of Equity 7,9% 8,2% 7,0% 7,3% 8,6% 7,4% 7,1% 10,2%
Cost of debt 5,8% 5,8% 5,8% 5,8% 7,0% 5,8% 6,0% 8,0%
After-tax Cost of debt 4,0% 3,9% 3,84% 3,8% 5,7% 4,8% 4,1% 5,3%
Cost of Tax Equity n.a. n.a. n.a. n.a. n.a. n.a. 8,5% n.a.
WACC 6% 6% 6% 6% 7% 6% 7% 8%
Table 12: Estimating for each country
Source: NOVA Equity Research
In what concerns the cost of debt, EDPR does not issue corporate bonds, which means that we do not have an observable cost of debt to be considered. As such, we based our estimate in a synthetic rating approach, as suggested by Professor Damodaran. We considered that the cost of debt could be estimated by summing to the risk-free rate an appropriate credit risk spread. We estimated a proxy for that spread by creating a synthetic rating – which, in this case, is based on the interest coverage ratio.
We also took into consideration that EDPR is not default-risk free, so, in order to achieve a final expected cost of debt, we also considered a probability of default, as well as a recovery rate. For the first input, we looked at 10-year probabilities of default for non-financial entities which, according to Standard&Poor’s,
averaged 11,21% in the period 1981-201131.
Lastly, we adjusted cost of debt to appropriate tax rates in each country. In the US, WACC was also adjusted for the Tax Equity Investors. The required return for Tax Equity Investors was considered at 8,5%32, in line with recent research on that issue.
Table 13 summarizes the main assumptions regarding WACC: Table 13: Weighted Average Cost of Capital
Source: NOVA Equity Research
31Source: “2011 Annual Global Corporate Default Study and Rating Transitions”, March 2012, Standard & Poor’s 32
EDPRENOVÁVEIS COMPANY REPORT
PAGE 16/37
Com pany Market Cap
(€m) 2011 2012
NextEra Energy 22.365 9,8 10,7
ENEL Green Pow er 6.560 8,6 7,7
Acciona 2.854 8,5 7,8
China Longyuan 3.793 12,2 8,9
Iberdrola 23.451 7,9 6,5
Average 9,4 8,3
EV/EBITDA Valuation 2011 2012E
EDPR EBITDA 801 847
EV 7.512 7.051
(-)
Net Debt 4.294 4.294
Minorities 131 131
Equity Value 3.087 2.626
Price 3,54 € 3,01 €
Scenario Analysis
By using a Discounted Cash Flow model to find a proper value for EDPR, several assumptions are being made – which can often diverge from reality. As such, changes in critical inputs such as energy prices or new installed capacity, for example, might change our conclusions and reveal the sensitivity of the model. Relying on this, a scenario analysis and a weighted valuation of the company through the probability of each scenario can be a more correct way to get a sense of the effect of most of the risky factors in the valuation33. We built our Base-Case Scenario using assumptions that we considered as being in line with the current business of the company and the current macroeconomic environment. On the other hand, we built an alternative scenario, where we assumed that wind parks will not be repowered and that cuts on incentives to clean energy will come sooner and with retroactive effects in countries as Portugal and Spain, to which we called Stressing Scenario.
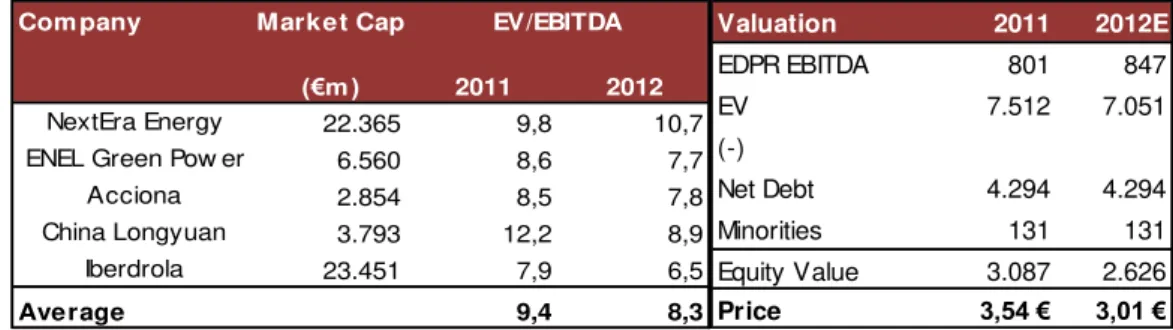
Multiples Valuation
Another useful tool that can be used to value a company is based on Multiples, which are publicly observable. As such, and in an attempt to have a broader perspective of the possible value of the company, we performed two different valuations based on Market Multiples and Transaction Multiples, respectively.
Market Multiples
In order to value EDPR using market multiples, we analyzed a set of possible comparables, and used Enterprise Value to EBITDA multiples34 as it is described in the following table35:
Table 14: Valuation using Market Multiples
Source: NOVA Equity Research, Bloomberg
33 Probabilities are attributed to each Scenario according to the analysis of the current environment in the industry performed in Section
IV.
34 EV/EBITDA for 2012 was taken from Bloomberg using Best EBITDA forecasts. 35 Net Debt includes also Institutional Partnerships Liabilities.
Base-Case Scenario:
In our base-case scenario, we assumed the current remuneration
(feed-in-tariffs or PPA’s) for wind
parks already registered/contracted. At the end of the period under regulation or PPA, we assumed market prices.
We already took into consideration the additional tax of 6% on energy revenues in Spain. New installed capacity follows the Business Plan 2012-2015.
We assumed the Repowering of wind farms at the end of their useful life.
Stressing Scenario:
In this scenario, we are assuming that financial crisis deepens in the more mature markets, which will lead to retroactive cuts in incentives in Spain and Portugal, so wind parks currently under feed-in-tariffs would be the most affected and would start being remunerated at market prices from 2014 onwards. We also assumed the end of Green Certificates in Poland and Romania at the same year. We kept the already contracted
PPA’s in Brazil, US and
EDPRENOVÁVEIS COMPANY REPORT
PAGE 17/37 0,1
0,4 1,7 2,3 5,2
16,7 42
Marine Geothermal Biomass Small Hydro Biofuels Solar Wind
Date Target Acquirer
Deal Value
(€m) % Acquired
Paym ent
Type EV/EBITDA EV/EBIT
August-2012 Shear Wind Inc. Sprott Pow er Corp 113,4 100% Cash 12,1 23,9
April-2012 Fersa Energias Renovables SA Greentech Energy System 291,4 100% Cash 9,5 27,9
December-2011 China Pow er New Energy China Three Gorges 204,4 29% Cash 6,3 12,9
April-2011 EDF Energies Nouvelle EDF 5.491,2 50% Stock 5,1 21,5
March-2011 Iberdrola Renovables Iberdrola 1.602,3 20% Stock 8,0 21,0
Average 8,9 18,9
Valuation
2011 2012E
EBITDA 801 847
EV 7.151 7.564
(-)
Net Debt 4.294 4.294
Minorities 131 131
Equity Value 2.726 3.139
Price 3,12 € 3,60 €
53,28
17,05 16,55 16,12 15,17
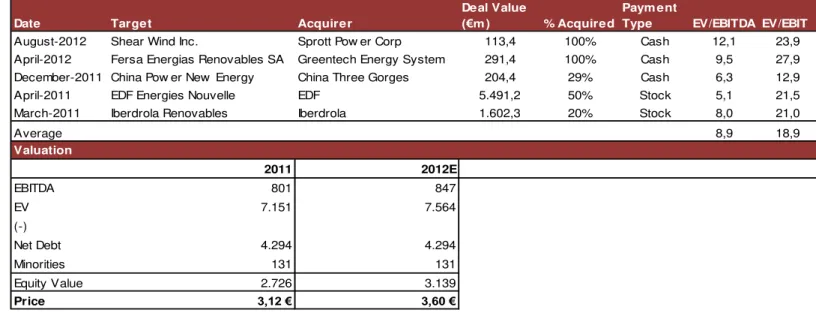
Transaction Multiples
The activity of Mergers and Acquisitions has been growing in the renewable energy sector, achieving a total spending of $68 billion in 201136. This behaviour was potentiated, in great part, by wind industry, which M&A activity totalized $42 billion. One of the main corporate acquisition occurred during the last year was conducted by the French utility EDF, which bought the 50% of EDF Energies Nouvelles that were free float. Allied to the sharp fall in share prices of the French renewable energy company, the Fukushima event might have also influenced the decision of EDF, which business comes at a great part from nuclear power. This move was followed by Iberdrola that also acquired 20% of its clean energy subsidiary.
For valuation purposes, we selected a group of comparable M&A transactions, and used an average of the multiples applied in each of them, to find a proxy for the Enterprise Value of EDPR. Table 15 summarizes the valuation of EDPR using this methodology.
Table 15: Valuation using Transaction Multiples (€m)
Source: NOVA Equity Research, Bloomberg
36 Source: BNEF
Chart 22: M&A activity in renewable energy sector ($bn) Source: BNEF/UNEP
Chart 23: Total Deal Values by Country of Target Company ($bn)
EDPRENOVÁVEIS COMPANY REPORT
PAGE 18/37
50,8 7,5 7 101 5,5 52,2 12,3 21,1
US Brazil America (excl. BR and US) Europe Middle East and Africa China India RoW
39 61
97 133
167 161 220
257
3,50% 3,50% 3,60% 3,80% 4% 4,50% 5,10% 6% 2,60%
4,60% 5% 5,40%
6,10% 6,90%
7,90% 9,20%
2004 2005 2006 2007 2008 2009 2010 2011
Renewable Power (% Global power generation)
Renewable Power(% Global installed capacity) 12% 5% 13% 12% 9% 9% 25% 22% 3% 20% 13% 20% 23% 17% 15% 31% 24% 15%
0% 10% 20% 30% 40% EU27 Belgium Spain France Italy Poland Portugal Romania UK
2020 target 2009
Challenges, Risks and Opportunities
This section aims at providing an outlook of the current environment in the renewable energy sector at a global level and in the countries where EDPR is currently operating, in order to attribute probabilities for each Scenario built in Section III.
First, looking at global values, the weight of clean sources of energy on global power generation has increased at an average annual rate of 8% since 2004.In 2011, electricity generated from renewable sources accounted for 6% of total energy globally produced – as suggested in Chart 24. The weight of clean energy in global power capacity has grown more rapidly, presenting a CAGR of 20%. The differences in these two relevant weights are associated with a parallel increase in fossil-fuel capacity – in terms of investments, in 2011 $302 billion were invested in fossil-fuels versus $237 billion in clean energy37 - and to the fact that, in general, load factors of clean energies do not surpass 30%, explaining the slower growth in terms of power generation.
However, in what concerns new installed capacity, renewable power – excluding large hydro – already represented around 45% of total new generation capacity in 2011, which reflects an increase of 93% relative to 200738. Since 2004, the investments in clean energy have increased at a Compounded Annual Growth rate of 31% - Chart 25. In the last year, Europe kept its leadership position considering the amount of investments in the sector, which totalled $101 billion, as suggested by Chart 27. China and Brazil leader the ranking in terms of growth, presenting a CAGR of investments of 57% and 51% respectively since 2004.
Chart 27: New Investments in Renewable Energy 2011 ($bn)
Source: Bloomberg New Energy Finance
37 Source: UNEP 38 Source: UNEP
Chart 26: Share of renewable energy (% gross final energy consumption)
Source:Eurostat
CAGR 31%
Chart 25: Global New
Investment in Renewable
Energy ($bn)
Source: Bloomberg New Energy Finance
Chart 24: Renewable power (% in global generation and capacity)
EDPRENOVÁVEIS COMPANY REPORT
PAGE 19/37 2004 2005 2006 2007 2008 2009 2010 2011
Wind Solar Biofuels
Biomass Small Hydro Geothermal
Marine
- 2000,0 4000,0 6000,0 8000,0
2006 2007 2008 2009 2010 2011
US EU 38%
24% 17%
12% 4% 5%
Oil Natural gas
Coal Nuclear energy
Hydro electricity Renewables
Much of this growth is related with national targets for clean energy. In the European Union, the RES Directive continues playing an important role by setting that, by 2020, 20% of energy consumption should come from renewable sources and each member state has its own target and national roadmap in other to achieve its goals. Chart 26 shows that most of the countries are still behind the 2020 targets. Overall, the share of renewable energy has increased in the EU27 at an annual growth rate of 7% since 2006, achieving a value of 12% in 2010. If the pace of growth remains the same in the following years, which depends a lot on the sustainability of current incentives, we estimate that EU27 will reach its target in 2018.
In the United States, according to the recent EIA report, by 2035, energy from renewable sources should represent around 19 to 20% of total energy generated
– assuming the extension on tax credits in the upcoming years. In the scenario where no extension is considered, the share of renewables should decrease to around 15%.
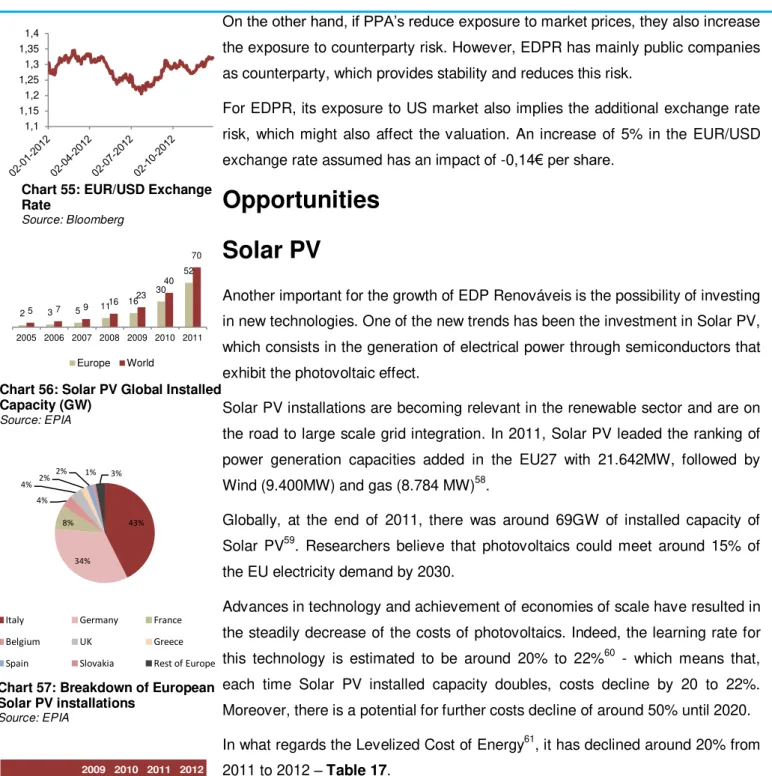
Considering now the breakdown of the recent investments in the sector by technology, it should be highlighted the growing importance of Solar PV and the fact that Wind and Solar continue representing the great part of new investments in clean power – see Chart 28.
The relevance of these two technologies is mainly explained by their growing competitiveness relative to other non-renewable sources, which brings hope for the sustainable development of clean power. According to Bloomberg New Energy Finance, the Levelized Cost of Energy39 of onshore wind, in the 4Q 2012, was less than Natural Gas in the base-case estimates ($86,66/MWh versus $90,42/MWh) – Chart 60 in Appendix. From 2009 up to now the decrease in wind turbine prices is around 25% (Chart 62 in Appendix), which is mostly explained by improving technology and excess capacity in the manufacturing industry40. The prices of Solar PV equipments have presented an even more substantial decrease. In fact, at the beginning of the current year, prices were 50% lower than a year ago and around 76% below 2008 levels41.
Even so, there are also some threats to the sustainability of the sector, which might jeopardize future investments plans and the achievement of established targets. One of the main problems is that there has been a worldwide focus on developing these cleaner and low-carbon sources of energy mostly through
39 BNEF model for the computation of LCOE includes as main inputs capital costs per MW, OPEX, cost of debt, depreciations, among
others.
40 According to a study from Bloomberg New Energy Finance, onshore wind might reach parity with coal, gas and nuclear generators by
2016.
41 Source: Bloomberg New Energy Finance
Chart 28: Breakdown of New Investments by Technology Source: Bloomberg New Energy Finance
Chart 29: Consumption by fuel in the European Union (2011) Source: BP
EDPRENOVÁVEIS COMPANY REPORT
PAGE 20/37 12 15
17 19 20
22 24 50% 57%
79% 84% 87% 88% 88% 89%
2010 2011 2012 2013 2014 2015 2016 2017 488,8 561,3 654,1 132,3 170,2
206,7
2009 2010 2011
OECD Non-OECD
government incentives and regulated tariffs, in order to subsidize the high costs of generation, allowing and prioritizing this clean energy to access the grid. In Germany, the total costs of subsidies provided to clean energy producers under the EEG Renewable Energy Act achieved a share of 14% of household electricity bills in this last year. The US spent, also in the last year, around $42 billion in incentives programs to renewable sector and China $44 billion42. Now, the world economic crisis, Sovereign debt crisis and the lack of sustainability of most of the incentives currently in place can put a barrier to future growth, as it becomes a political issue in many of the indebted developed countries. In the next sections a brief analysis of the sustainability of the sector and current incentives in the countries that matter the most for EDPR is performed.
Spain
The Spanish market is one of EDPR’s core markets. When it comes to wind
power generation, Spain has 21GW43 of installed capacity, ranking 4th worldwide, being one of the most important markets.
In what concerns regulatory framework, EDPR has currently installed capacity under two different regimes: the Transitory Regime and RD 661/2007. However, the first one is only applicable until the end of 2012, so the 1.153MW of installed capacity under this regime will be transferred to RD 661/2007 from 2013 onwards. This last regime provides two different options: fixed tariff updated annually according to CPI-x44 or variable tariff (indexed to pool prices plus a premium with cap and floor). EDPR’s new installed capacity for 2012 was already registered under RD 661/2007, as such, only additions from 2013 onwards will be affected by changes in the current regulatory framework45. The macroeconomic environment in Europe, especially in the most leveraged countries, is forcing deep austerity measures and governments are cutting costs and trying to increase public revenues, mainly through taxation. Spain is not an exception, and the increasing public debt led to the creation of a new 6% tax on electricity income, including renewable sources. Given so, even if the already EDPR installed capacity is not affected by changes in incentives, it is affected by this new tax that should entry into force soon. Obviously, this will have a negative impact in the profitability of the wind business in Spain, but the management
42 Source: UNEP
43 Source: International Energy Agency Annual Report 2011
44 This means that there is an indexation to Consumer Price Index but adjusted for an X-factor, which, in this case, was 0,25% until 2012
and 0,5% from 2013 onwards.
45 However, policies with retroactive effects can affect current installed capacity in Spain. We estimate a decrease of €1,25/share in our
base-case scenario, consequent of such retroactive policies. EDPR has a total of 2GW of
installed capacity in Spain, 9% market share, being the third largest player, behind Iberdrola (25%) and Acciona (19%).
Chart 32: Spain’s General
Government Net Debt (% GDP) Source: IMF
CAGR 12%
Chart 33: Spain’s Wind
Installed Capacity (GW) Source: Observatorio Eolico AEE Chart 31: Renewables Consumption - excluding Hydro (TWh)
EDPRENOVÁVEIS COMPANY REPORT
PAGE 21/37
5006 5456 5782
8281 9716 10180 10244
2005 2006 2007 2008 2009 2010 2011
5023 10244
0 5000 10000 15000 Tariff costs
Total GDP Contribution
4124 7349 8604 14422
19028 24582
2005 2006 2007 2008 2009 2010
Annual Tariff Deficit Cumulative Tariff Deficit
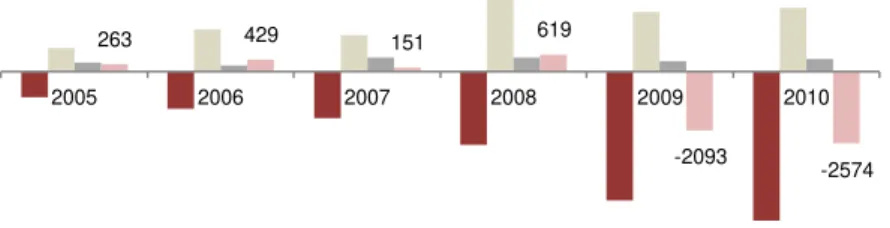
263 429 151 619
-2093
-2574
2005 2006 2007 2008 2009 2010
Incentives Avoided Imports Avoided CO2 Emissions Economic Impact Export Partners 2011
France 17,80%
Germany 10,60%
Portugal 8,30%
Italy 8,30%
UK 6,70%
affirmed that they “can live with it”. Through our model, we estimate that the introduction of this new tax has an impact of -0,16€ per share.
Other relevant problem in Spain is related to the tariff deficit – which is the difference between what consumers pay for the electricity and what it does, in fact, costs to generate. By applying artificially low regulated tariffs that do not cover the costs borne by producers, a deficit is generated that sooner or later will have to be paid. Indeed, revenues from electricity tariffs are not covering costs
since 2000 and the accumulated deficit amounted to €24.582m in 2010.
An important instrument created in 2011 to finance this deficit was FADE46. This fund securitizes tariff deficit receivables of the regulated settlements of the Spanish electricity sector, by issuing bonds in the capital markets with maturities up to 15 years. The current maximum outstanding bond balance is €22.000 million but may be extended to €25.000 million. Currently, the receivables
balance of the fund is €12.457 million47. The interest rate on the last issuance was 5,741%.
However, the success of this fund is very dependent on market conditions and heavily affected by the conditions of funding of Spain. As such, the sustainability of this financing source is also not guaranteed. Thus, the options remain the same: increase in electricity tariffs, increase in costs for utilities sector and increase in tariff deficits. Aware of these problems that might deepen in the future, EDPR does not plan to add any new capacity in the following years. It is important to bear in mind that electricity is of utmost importance for the competitiveness of an economy. That explains the motivation for not increasing tariffs to a point in which costs are fully covered – breaking even the tariff deficit.
Chart 37: Economic Impact of Renewable Energy in Spain (€m)
Source: APPA
Analyzing the main Spanish export partners and the average prices of electricity for each of them, we can see that the competitiveness of Spanish products might
46 Fondo de Amortización del deficit Eléctrico 47 Source: FADE (30-11-2012)
Chart 34: GDP Contribution
of Renewable Energy (€m)
Source: APPA
Chart 35: Comparison between
Renewable’s GDP contribution and tariff costs (€m)
Source: APPA
Chart 36: Spanish Tariff deficit
(€m)
Source: APPA
Table 16: Spain Export Partners (% of total Exports)
EDPRENOVÁVEIS COMPANY REPORT
PAGE 22/37
75 110
175 231
380 326
743 1049 946
2003 2004 2005 2006 2007 2008 2009 2010 2011
0,164 0,173 0,184 0,168 0,185
0,209
0,121 0,135 0,142
2009 2010 2011
EU27 Spain France
77,3 80 86,3 92,2 94,6
101,3 96,2 97 103,4
57,07 55,53 59,42 65,93 57,39 73,16
44,61 38,74 50,82
2003 2004 2005 2006 2007 2008 2009 2010 2011
Average Annual Cost SR €/MW Regulated Tariff
57,07 55,53 59,42 65,93 57,39 73,16
44,61 38,74 50,82 84,1 87,5 88,8 92 94,5 94,7 93,7 91,6 93,5
2003 2004 2005 2006 2007 2008 2009 2010 2011
Regulated Tariff
Average Annual Cost Wind €/MW
be threatened if tariffs increase considerably, since the country has already prices higher than the average of the EU27 –Chart 38.
Moreover, although all the costs with renewable energies, the truth is that the
sector contributed with €10.244m to Spain’s GDP last year48, surpassing
incentives costs, which amounted to €5.023m. The Net Exports of the sector
have also been positive, which contributes to the sustainability of the Spanish economy (see Chart 61 in Appendix).
Portugal
The Portuguese market represented, in 2011, around 13% of EDPR’s total
installed capacity. It is another core market for the company, where incentives were historically high, fuelling the development of different renewable energies49. However, also Portugal followed the scheme of regulated tariffs that was implemented in Spain. The Government informed that the tariff deficit should
surpass the €8.000 million in 2020 if no actions were taken, and sooner or later it has to be repaid by consumers. The gap between the market prices and the effective costs is increasing, and so it is the tariff deficit (in 2011, the average
annual cost of each MW under the Special Regime was 103,4€ and 93,5€ for
wind specifically but the regulated price was only 50,82€/MW). Taking into
account that around 18 TWh were produced under the Special Regime, we found a total tariff deficit of €957 million generated in 2011.
In order to reduce overall costs of the Portuguese electric system, the Government and the wind sector reached an agreement which maintains the current tariff scheme, through the extension of the initial 15 years established by DL 33A/2005 to a duration of 20-22 years, in exchange of an annual payment from 2013 to 2020.
Between the 16th and 22nd year, wind energy should be remunerated through a floor price (whenever market price is below the floor, which is €74/MWh), through
a cap price (whenever the market price is above the cap - €98/MWh) or through
market prices in the remaining situations. The annual payments should lie
between €5,8/MW and €6,5/MW.
This agreement showed the awareness of the government about the importance of the development of clean energies, so we do not anticipate retroactive changes to the current legislation that jeopardize the profitability of current installed capacity.
48 Source: APPA
49 The remuneration scheme in Portugal is a feed-in-tariff, which is designed taking into account factors such as avoided investments in
alternative production systems, O&M costs of alternative production methods, valuation of avoided CO2 emissions and CPI indexation. Chart 40: Average Annual Cost
of Technologies under Special Regime in Portugal
Source: ERSE
Chart 38: Comparison between Electricity Prices
Source: Eurostat
Chart 39: Portuguese Annual Tariff Deficit
Source: ERSE, NOVA Equity Research
Chart 41: Average Annual Cost Wind Energy vs Regulated Tariff in Portugal