Adv. Sci. Res., 2, 5–8, 2008 www.adv-sci-res.net/2/5/2008/
©Author(s) 2008. This work is distributed under the Creative Commons Attribution 3.0 License.
Advances in
Science and
Research
7th
EMS
Annual
Meeting
and
8th
Eur
opean
Confer
ence
on
Applications
of
Meteor
olo
gy
2007
Analysis of aerosol optical depth evaluation in polar
regions and associated uncertainties
P. Ortiz de Galisteo1,2, C. Toledano1, V. Cachorro1, E. Rodr´ıguez1, and A. de Frutos1
1GOA-UVA Atmospheric Optics Group of the University of Valladolid, Spain 2INM National Institute of Meteorology, Madrid, Spain
Received: 23 December 2007 – Revised: 8 March 2008 – Accepted: 17 March 2008 – Published: 7 April 2008
Abstract. Some available processing algorithms used to calculate the aerosol optical depth from radiometric measurements were tested. The aim was to evaluate the associated uncertainties in polar regions due to the data processing, in order to adjust the methodology of the calculation and illustrate the importance of these error sources. The measurements were obtained during a sun photometer campaign in Ny-Ålesund within the framework of the POLAR-AOD project.
1 Introduction
The radiative forcing of atmospheric aerosols constitutes one of the main uncertainties in climate change studies. Under-standing the role of aerosols in polar regions, where the cli-mate change has been seen to be more intense, is especially relevant. Thus, within the framework of the International Po-lar Year 2007/08, the project POLAR-AOD attempts to es-tablish a bipolar network to characterize the climate-forcing properties of aerosols in polar regions.
The first activity within POLAR-AOD was a sun-photometer campaign that took place in Ny-Ålesund (78◦55′N–11◦54′E, Svalbard) in spring 2006. One of the
aims of this campaign was to adjust the calculation proce-dure for the aerosol optical depth (AOD) in order to achieve homogeneous AOD evaluations.
Typical values of AOD (500nm) are between 0.02 and 0.08 in Antarctica, and between 0.03 and 0.10 in the Arctic (Tomasi et al., 2007). Due to these low values and to the crit-ical observation conditions the final uncertainty in the AOD can be very significant.
2 Methodology
The study of atmospheric components by radiometric mea-surements is based on the comparison between the solar
irra-Correspondence to: P. Ortiz de Galisteo
diance on the Earth’s surface (I) and the extraterrestrial solar spectrum I0(Shaw, 1983):
I=I0·e−τm (1)
The difference between I0 and I is due to the attenuation throughout the atmosphere produced by: Rayleigh molecu-lar scattering, aerosol scattering and absorption, and absorp-tions by gases. The air mass (m) accounts for the light path through the atmosphere with respect to the vertical path.
The AOD (τa) is calculated after subtracting from the total optical depth (τ) the contribution of the other atmospheric components: molecules (τR), ozone (τO3), water vapour (τwv), and other gases (τg). Thus, its accuracy is affected by errors in the other components.
All the atmospheric constituents are not equally dis-tributed, so the air mass, which depends on the vertical pro-file, is different for each of them.
τm=τRmR+τama+τO3mO3+τgmg+τwvmwv (2) From expressions (1) and (2),
τa=(Ln(I0/I)−τRmR−τO3mO3−τgmg−τwvmwv)/ma (3)
3 Results and discussion
The following results were achieved from the data obtained with a Cimel sun-photometer, which is the standard in-strument of AERONET (Aerosol Robotic Network, http:// aeronet.gsfc.nasa.gov/), during the sun photometer campaign in Ny-Ålesund.
6 P. Ortiz de Galisteo et al.: Analysis of aerosol optical depth evaluation in polar regions
Table 1. Differences in the AOD for each working wavelength due to the discrepancies in the SZA at the observation time computed from the formulas of Spencer and Michalsky.
Wavelength 1640 1020 870 675 500 440 380 340
bias 0.000 0.000 0.000 0.000 0.001 0.001 0.002 0.003 RMSE 0.000 0.000 0.000 0.000 0.001 0.001 0.002 0.004 maximum 0.001 0.001 0.001 0.001 0.003 0.004 0.006 0.010
Table 2.Dissimilarities in the AOD for each working wavelength considering or not the light refraction due to discrepancies in the SZA.
Wavelength 1640 1020 870 675 500 440 380 340
mean 0.000 0.000 0.000 0.001 0.002 0.002 0.004 0.006 maximum 0.001 0.001 0.001 0.002 0.004 0.005 0.008 0.012
Figure 1. Statistics values: maximum, minimum and mean
+/-standard deviation of the aerosol optical depth for the whole cam-paign for each working wavelengths.
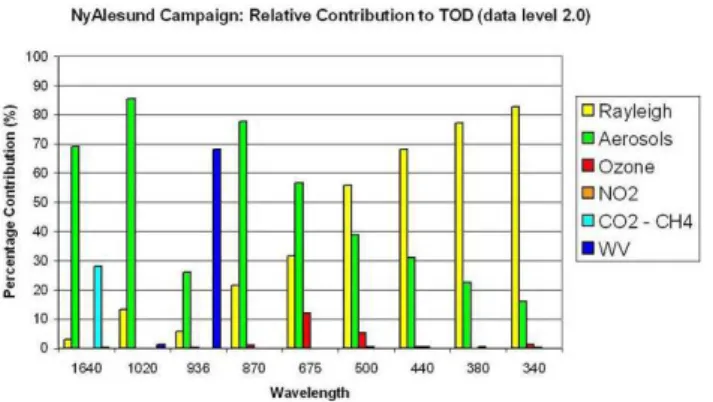
Figure 2. Relative contribution (%) of each atmospheric compo-nent to the total optical depth for each wavelength (nm). Graph obtained with the measurements taken during the Ny-Ålesund cam-paign (data level 2.0: after cloud screening).
In this paper we focus our interest on the uncertainties in the data processing. According to expression (3) and ignor-ing other error sources like calibration and instrument char-acteristics, the errors will be associated with the contribution of other atmospheric constituents and the air mass calcula-tion, which for its part is affected by astronomical coordi-nates and light refraction.
The AOD was computed with a software package de-veloped by us based on the algorithms used in the new AERONET processing version 2 (Smirnov, 2004). Figure 1 shows the mean AOD in each spectral channel, as well as the standard deviation, maximum and minimum. The mean AOD (500 nm) was 0.1, just on the limit between clear and haze conditions in the arctic (Tomasi et al., 2007). Fig-ure 2 represents a breakdown in the percentages of the rela-tive contribution of each atmospheric component to the total optical depth (TOD) for each wavelength. This analysis is useful in helping to understand the importance of each error source. Thus, in the ultraviolet range even a small error in the Rayleigh OD can result in large AOD error. Other algorithms were subsequently introduced in the data processing to study their contribution to the uncertainty in the AOD. These will be analyzed in the following sections.
3.1 Astronomical coordinates
The exact astronomical parameters at the observation time are difficult to determine due to the complexity of several movements that affect the Sun and the Earth. Therefore, in the literature approximation formulas have been proposed to calculate these parameters. In this study two of them were used: Michalsky (1988) and Spencer (1971). Some discrep-ancies (bias=2.8′; RMSE=3.6′; max=6.9′) were obtained in
the solar zenith angle (SZA), which were maximum at sun-rise, producing discrepancies in the values of the AOD (Ta-ble 1).
P. Ortiz de Galisteo et al.: Analysis of aerosol optical depth evaluation in polar regions 7
Table 3. Differences between the AOD for each working wavelength calculated considering the same air mass for all the atmospheric components and a different one for each of them.
Wavelength 1640 1020 870 675 500 440 380 340
bias 0.001 0.001 0.001 0.000 0.001 0.002 0.002 0.002 RMSE 0.001 0.001 0.001 0.001 0.001 0.002 0.002 0.002 maximum 0.002 0.002 0.002 0.002 0.003 0.004 0.005 0.005
Table 4.Rayleigh optical depth for each working wavelength (nm) calculated according to the formulas of different authors.
1640 1020 870 675 500 440 380 340
Bodhaine 0.001 0.008 0.015 0.042 0.145 0.242 0.443 0.719 Fr¨ohlich and Shaw 0.001 0.008 0.015 0.042 0.144 0.243 0.444 0.721 Gueymard 0.001 0.008 0.015 0.042 0.144 0.242 0.442 0.717 Bird and Riordan 0.001 0.008 0.016 0.042 0.146 0.246 0.449 0.729 Hansen and Travis 0.001 0.008 0.015 0.042 0.145 0.243 0.444 0.720
3.2 Light refraction
Light refraction makes the Sun appear in an apparent position with a SZA lower than the real one. The lower the tempera-ture and the higher the SZA, the larger the refraction. Both conditions are especially relevant in polar regions, so this ef-fect is important and must be taken into account.
Two expressions were adopted to determine the effect of light refraction: Meeus (1991) and US Standard Atmosphere (1976), resulting in a discrepancy between the SZA calcu-lated with bias=39′′ and max=1′. Only Meeus’ one takes
into account the temperature and pressure at observation time. Despite this, no significant dissimilarities were found in the AOD. Nevertheless if refraction had not been consid-ered, the error in the SZA (with a mean value of 5′and a
maximum of 12.5′) would have produced a significant error
in the AOD (Table 2).
3.3 Air mass
In this point we want to illustrate the importance of taking into account the non-equal distribution of the atmospheric constituents, especially for observations at high SZA as is the case in polar regions.
The AOD was calculated using the same air mass for all the atmospheric components (Kasten and Young, 1989), and a different one for each of them: molecular (Kasten and Young, 1989), ozone (Komhyr, 1989), water vapour and aerosols (Kasten, 1966). The highest discrepancy was 0.005 (Table 3). These differences decrease from sunrise, reach a minimum at noon, and increase until sunset, due to the fact that for small SZA the air mass of each component tends to the same value.
In any case the approximation formulas of air masses used were developed for mid-latitude atmospheres, and they prob-ably would need to be adapted to an arctic one.
3.4 Rayleigh scattering
Many expressions for Rayleigh scattering have been pro-posed in the literature. Five of them were tested: Fr¨ohlich and Shaw (1980), Bird and Riordan (1986), Gueymard (1995), Hansen and Travis (1974) and Bodhaine et al. (1999). Differences as high as 0.012 in 340 nm were obtained (Ta-ble 4).
To compute the Rayleigh scattering it is necessary to know the pressure at the observation site. Normally, if pressure data at the observation time is not available, climatolog-ical values are used. Both kinds of pressure data were tested resulting in discrepancies of 10 hPa, about 0.007 in the Rayleigh optical depth and therefore in the same magnitude in the AOD.
3.5 Ozone and nitrogen dioxide
The largest error in the ozone and NO2 optical depth comes from the uncertainty in their columnar content. In the same way as with the pressure (see above), observed and climato-logical data for columnar content were used. In the case of ozone, differences as high as 60DU were detected, causing a discrepancy of 0.003 in the absorption by ozone in 675 nm and consequently in the AOD. However, in the case of NO2 its contribution is much less important and the discrepancies are negligible.
8 P. Ortiz de Galisteo et al.: Analysis of aerosol optical depth evaluation in polar regions
4 Conclusions
The magnitude of the uncertainties of the data processing is small, but due to the low pollution levels in polar regions and to the extreme observation conditions they can involve a high percentage in the value of the AOD in these regions. So the data processing to evaluate the AOD must be accu-rately accomplished, otherwise the errors can be as large as the variable that we intend to determine.
The errors caused by the processing, especially those re-lated to the astronomical data, the refraction, the air mass and the Rayleigh scattering are reduced just by using state-of-the-art algorithms. Observed data of ozone and pressure are basic requirements to achieve the necessary accuracy in the AOD calculation in polar regions.
Acknowledgements. We are grateful to the following
insti-tutions for organizing and participating in the Ny-Alesund sun photometer intercomparison campaign: Institute of Atmospheric Sciences and Climate (CNR Bologna), Alfred Wegener Institute (Germany), University of Sherbrooke (Canada), Finnish Meteoro-logical Institute, Institute of Oceanology of the Polish Academy Science (Sopot), Norwegian Institute of Air Research, Andoya Rocket Range (Norway), National Institute of Polar Research (Japan), Institute for Tropospheric Research (Leipzig), National Oceanic & Atmospheric Administration (Boulder, US), University of Bremen (Germany).
Edited by: M. Piringer
Reviewed by: two anonymous referees
References
Bird, R. E. and Riordan, C.: Simple solar spectral model for di-rect and diffuse irradiance on horizontal and tilted planes at the Earth’s surface for cloudless atmospheres, J. Clim. Appl. Meteo-rol. 25, 87–97, 1986.
Bodhaine, B. A., Word, N. B., Dutton, E. G., and Slusser, J. R.: On Rayleigh Optical Depth Calculations, J. Atmos. Ocean. Tech, 16, 185–1861, 1999.
Fr¨ohlich, C. and Shaw, G. E.: New determination of Rayleigh scat-tering in the terrestrial atmosphere, Appl. Optics, 19, 1773–1775, 1980.
Gueymard C.: SMARTS2 A simple model of atmospheric radia-tive transfer of sunshine, Report FSEC-PF-270-95, Florida Solar Energy Center, 1995.
Hansen, J. E. and Travis, L. D.: Light Scattering in Planetary Atmo-spheres, Space Sci. Rev. 16, 527–610, doi:10.1007/BF00168069, 1974.
Kasten, F. and Young, A. T.: Revised optical air mass tables and approximation formula, Appl. Optics, 28, 4735–4738, 1989. Kasten, F.: A new table and approximation formula for relative air
mass, Arch. Meteor. Geophysics. Bioklimatol. Ser. B, 14, 206– 223, 1966.
Komhyr II, D., Grass, K. D., and Leonard, R. K.: Jonson Spec-trophotometer 83: a Standard for total ozone measurements, 1962–1987, J.Geophys. Res., 94, 9847–9861, 1989.
Meeus, J.: Astronomical Algorithms, Willmann-Bell, 102 pp., 1991.
Michalsky, J.: The astronomical almanac’s algorithm for approx-imate solar position (1950–2030), Solar Energy, 40, 227–235, 1998.
Shaw, G. E.: Sun photometry, B. Am. Meteorol. Soc., 64, 4–10, 1983
Smirnov, A., Holben, B. N., Lyapustin, A., Slutsker, I., and Eck, T. F.: AERONET processing algorithms refinement, AERONET Workshop, May 10–14, 2004, El Arenosillo, Spain.
Spencer, J. W.: Fourier series representation of the position of the sun, Search, 2, p. 172, 1971.
Tomasi, C., Vitale, V., Lupi, A., et al.: Aerosols in po-lar regions: A historical overview based on optical depth and in situ observations, J. Geophys. Res., 112, D16205, doi:10.1029/2007JD008432, 2007.