FUNDAÇÃO GETULIO VARGAS
ESCOLA DE ADMINISTRAÇÃO DE EMPRESAS DE SÃO PAULO
FERNANDO LUIZ NAPOLITANO DE GODOY MISTURA
THE PROMOTION OF OUTWARD FOREIGN DIRECT INVESTMENT: A COMPARATIVE POLICY ANALYSIS OF BRIC COUNTRIES
FERNANDO LUIZ NAPOLITANO DE GODOY MISTURA
THE PROMOTION OF OUTWARD FOREIGN DIRECT INVESTMENT:
A COMPARATIVE POLICY ANALYSIS OF BRIC COUNTRIES
Dissertação apresentada à Escola de
Administração de Empresas de São Paulo da Fundação Getúlio Vargas, como requisito para obtenção de título de Mestre em Gestão Internacional
Campo de conhecimento: Economia Política
Orientador: Prof. Dr. Antonio Carlos Manfredini da Cunha Oliveira
Mistura, Fernando Luiz Napolitano de Godoy.
The Promotion of Outward Foreign Direct Investment: a Comparative Policy Analysis of BRIC Countries / Fernando Luiz Napolitano de Godoy Mistura. - 2011.
174 f.
Orientador: Antonio Carlos Manfredini da Cunha Oliveira
Dissertação (MPGI) - Escola de Administração de Empresas de São Paulo.
1. Investimentos estrangeiros. 2. Empresas multinacionais. 3. Relações tributárias intergovernamentais. 4. Relações econômicas internacionais. I. Oliveira, Antonio Carlos Manfredini da Cunha. II. Dissertação (MPGI) - Escola de Administração de Empresas de São Paulo. III. Título.
ACKNOWLEDGEMENTS
The writing of this dissertation has been a delightful journey, although sometimes stressful.
Several people have made this journey easier and gave significant contributions for this
project to be accomplished. They helped me along the dilemmas that this project involved,
from the topic choice and problem solving to encouragement and support.
I am gratefully thankful to Prof. Antonio Carlos Manfredini da Cunha Oliveira for his
guidance and support throughout this journey. His detailed corrections and thoughtful advices
made this project significantly better. For all his support, I am immensely grateful.
I also thank Prof. Maria Antonieta Del Tedesco Lins and Prof. Fabio Mariotto for dedicating
their time to evaluate my dissertation, and especially for their recommendations for improving
my work during the final exam.
I thank Stephen Thomsen and Angel Palerm for their support during my internship at OECD,
and for helping me choose the topic for this dissertation.
I am also very thankful to Prof. Julia Von Maltzan Pacheco, Prof. Tales Andreassi, Maria
Cecilia Menezes from EAESP-FGV for their restless support in solving bureaucratic
problems and making the CEMS–MPGI program unique.
Finally, I want to thank my family and my girlfriend for their patience and their support
throughout this journey, especially in the tough moments of anxiety, fear, and physical and
psychological exhaustion. They kept pushing me back on track when intensity lowered. I
specially thank my mother, Ana Maria Napolitano de Godoy, for her unconditional love and
support.
From these two years of CEMS-MPGI Master degree in Europe and Brazil, I take not only the
!"
ABSTRACT
This dissertation has sought to identify the role of BRIC country governments in the internationalization of their firms. Drawing upon an exploratory comparative analysis of BRIC OFDI trends and policies, it contributes to further an initial understanding of this phenomenon by shedding light on how and why BRIC governments have been promoting their multinationals. For this, it analysed specific OFDI-related policies implemented by BRIC countries as a way of highlighting policy-gaps and the effects of institutional set-ups in the development of internationalized companies.
The rapid rise of MNCs from BRIC countries is quite a recent phenomenon. Although they had invested abroad before, only since the early 2000s OFDI by BRIC MNCs has become substantial. BRIC MNCs are becoming major players in many industries, taking-over competitors in both developed and developing countries, and reshaping competition in many industries.
In this process, BRIC governments have played an important role. While until the early 1990s, BRIC governments restricted OFDI because of a negative perspective on its effects on home economies (e.g., reduction in investments at home, exports of jobs, and constraints to the balance-of-payments), in the 2000s their perception of OFDI changed. They have become more aware of the importance of OFDI for the competitiveness of their firms and industrial upgrade. While China, and to a lesser extent India, are one step further, having already put in place a comprehensive set of specific OFDI promoting policies, Brazil and Russia have yet to take further steps in order to create an enabling environment for their companies to fully exploit the advantages of global expansion.
Key words: Foreign Direct Investment – BRIC – OFDI Policies – Bilateral Investment
!!"
RESUMO
Esta dissertação procurou identificar o papel dos governos na internacionalização produtiva de empresas dos países BRIC. Por meio de uma análise comparativa do comportamento dos investimentos diretos no exterior (IDE) destes países e dos mecanismos existentes de suporte à internacionalização das empresas, foi possível identificar as diferentes maneiras de envolvimento desses governos na internacionalização produtiva de suas empresas e apontar lacunas de políticas públicas nestes países. Destarte, esta dissertação contribui à compreensão inicial sobre como e por que os governos destes países têm promovido o desenvolvimento de multinacionais.
A rápida ascensão das multinacionais dos países BRIC é um fenômeno recente. Apesar de terem investido no exterior anteriormente, apenas a partir do início dos anos 2000 que o IDE de empresas destes países tornou-se significativo. Desde então, as multinacionais dos países BRIC estão se tornando importantes players em diversas indústrias, adquirindo competidores de países desenvolvidos e em desenvolvimento, e redesenhando a concorrência em muitas indústrias globais.
Neste processo, os governos dos países BRIC têm desempenhado um papel importante. Até o início dos anos 1990, o IDE era restringido porque era associado a efeitos negativos sobre as economias domésticas (como por exemplo, à redução de investimentos no país de origem, à exportação de empregos, e a problemas na balança de pagamentos). Desde o início dos anos 2000, entretanto, os governos dos países BRIC mudaram de percepção e passaram a adotar políticas favoráveis à internacionalização produtiva de empresas domésticas. Eles perceberam a importância da internacionalização para a manutenção ou expansão da competitividade das empresas domésticas em um mundo globalizado. A China, e em menor grau a Índia, estão um passo adiante, tendo já posto em prática um conjunto de instrumentos específicos que facilitam a internacionalização de suas empresas. O Brasil e a Rússia ainda têm de tomar novas medidas para criar um ambiente propício para que suas empresas possam mais facilmente explorar as vantagens da expansão global.
Palavras-chave: Investimento direto no exterior – BRIC – multinacionais de países
!!!"
LIST OF FIGURES
Figure 1 - The Uppsala model of internationalization ... 34
Figure 2 - The Investment Development Path (IDP) ... 39
Figure 3 - Relationship between Net Outward Investment Position (NOIP) and GDP per capita, selected countries (2004) ... 45
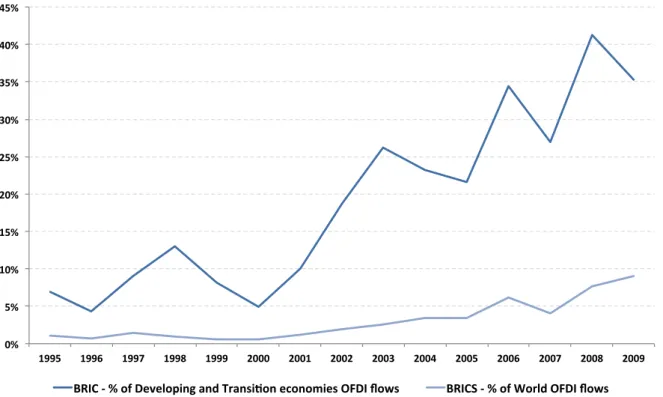
Figure 4 - OFDI flows from BRIC as a share of world and developing and transition economies OFDI flows, 1995 - 2009 ... 73
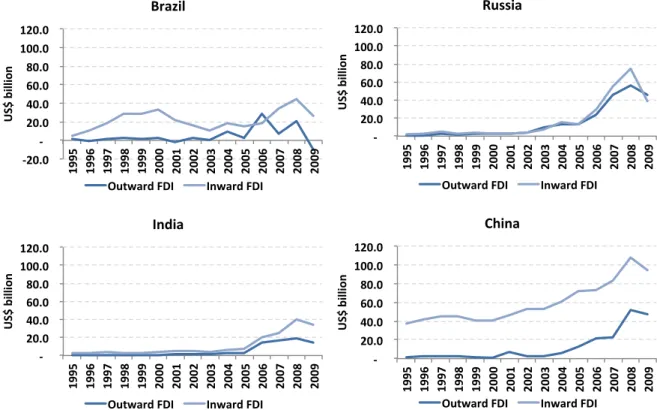
Figure 5 - FDI ouflows vs. inflows from BRIC, 1995 - 2009 (US$ billionª) ... 74
Figure 6 - Net FDI (inflow minus outflow) from BRIC, 1995 - 2009 (US$ billionª) ... 75
Figure 7 - Capital invested abroad from BRIC and developing and transition economies, 1995 - 2009 (US$ millionª) ... 76
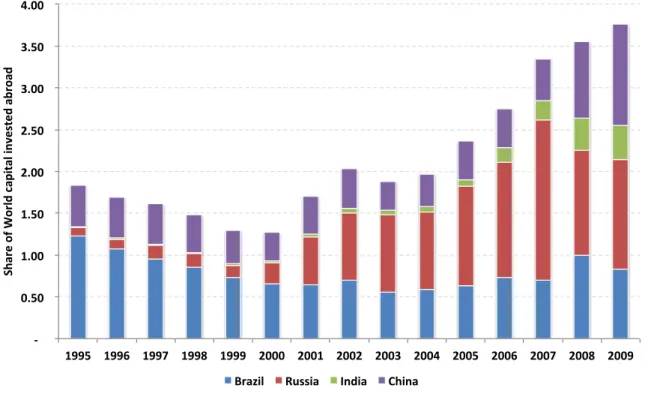
Figure 8 - Capital invested abroad from BRIC, 1995 - 2009 (Share of World total) ... 77
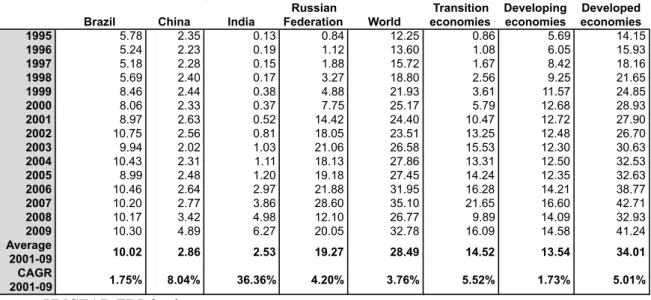
Figure 9 - Capital invested abroad from BRIC, developed and developing economies, 1995 - 2009 (Share of GDP) ... 78
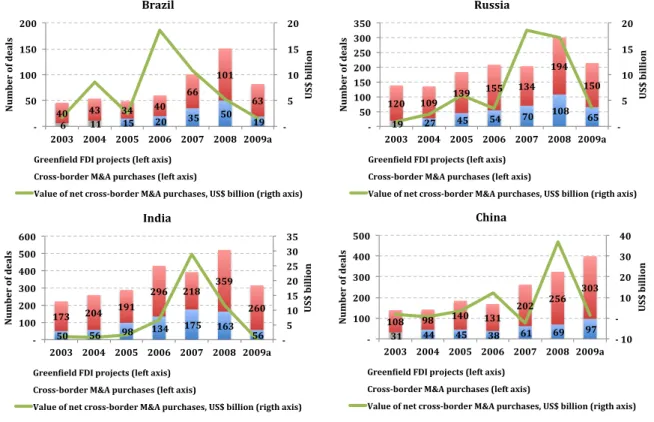
Figure 10 - Cross-border M&A purchases and Greenfield projects by BRIC, 2003 - 2009 .... 79
Figure 11 - Geographical distribution of Brazilian capital invested abroad, 2003 and 2009 (%)89 Figure 12 - Geographical distribution of foreign assets of top 25 Russian MNCs, 2007 ... 90
Figure 13 - Geographical distribution of Indian OFDI flows (1990/99 - 2000/09)ª ... 91
Figure 14 - Geographical distribution of Chinese capital invested abroad, 2003 and 2009 .... 92
Figure 15 - The 2011 BCG Global Challengers from BRIC by industry ... 94
Figure 16 - China's OFDI policy framework ... 130
Figure 17 - Number of BITs signed by BRIC: 1984 - 2011 (as of June 2011) ... 136
Figure 18 - Number of BITs by BRIC, total per region (as of June 2011) ... 138
Figure 19 - Top political risks selected by BRIC investors, 2009 ... 139
Figure 20 - Number of DTTs signed by BRIC: 1956 - 2011 (as of June 2011) ... 142
Figure 21 - Number of DTTs signed by BRIC, total per region (as of June 2011) ... 143
LIST OF TABLES Table 1 - OFDI waves from developing economies ... 11
Table 2 - OFDI supporting instruments for analysis ... 14
Table 3 - Summary of relevant FDI models ... 43
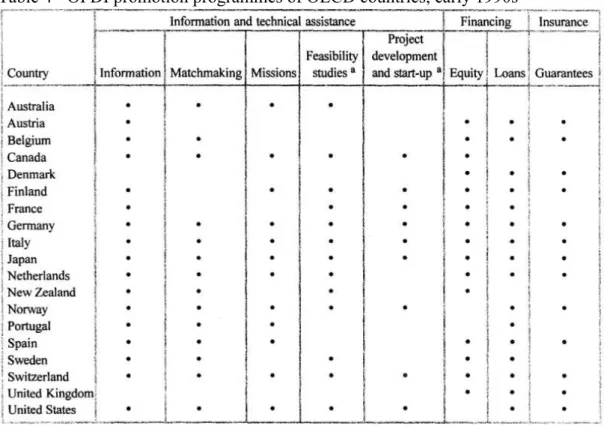
Table 4 - OFDI promotion programmes of OECD countries, early 1990s ... 56
Table 5 - OFDI flows from BRIC, 1995 - 2009 (US$ billionª) ... 73
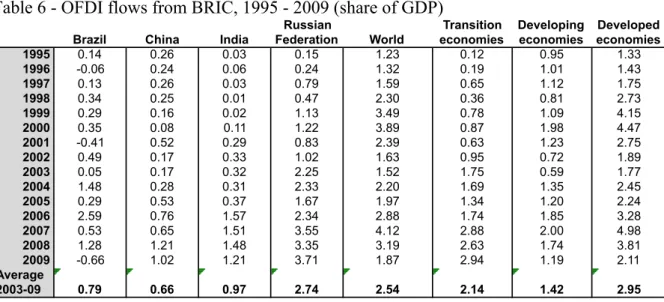
Table 6 - OFDI flows from BRIC, 1995 - 2009 (share of GDP) ... 75
Table 7 - Capital invested abroad from BRIC, developing, transition, and developed countries, and World total, 1995 - 2009 (Share of GDP) ... 78
Table 8 - Top 30 Cross-border M&A deals by Brazilian MNCs, 2003 - Jul/2011 (US$ thousand) ... 80
Table 9 - Top 10 Greenfield projects by Brazilian MNCs, 2007 - 2009 (US$ million) ... 81
Table 10 - Top 30 Cross-border M&A deals by Russian MNCs, 2003 - Jul/2011 (US$ thousand) ... 82
Table 11 - Top 15 Greenfield projects by Russian MNCs, 2006 - 2007 (US$ million) ... 83
Table 12 - Top 30 Cross-border M&A deals by Indian MNCs, 2003 - Jul/2011 (US$ thousand) ... 84
Table 13 - Top 25 Greenfield projects by Indian MNCs, 2007 - 2009 (US$ million) ... 85
Table 14 - Top 30 Cross-border M&A deals by Chinese MNCs, 2003 - Jul/2011 (US$ thousand) ... 86
!#"
Table 16 - Number of BRIC MNCs in the Fortune Global 500 ranking (2005 - 2010) ... 93
Table 17 - The 2011 BCG Global Challengers from BRIC ... 94
Table 18 - BRIC MNCs among the top 100 non-financial TNCs from developing and transition economies, as ranked by foreign assets (2008ª) ... 95
Table 19 - VCC ranking of Brazilian non-financial MNCs, ranked by foreign assets (2009) . 96 Table 20 - Sectoral distribution of Brazilian OFDI stocks, 2007 - 2009 (US$ million) ... 97
Table 21 - Top 25 Russian MNCs as ranked by foreign assets, 2007 (US$ million) ... 99
Table 22 - Indian OFDI by broad sectors, 1999/2001 - 2001/2009 (%) ... 100
Table 23 - VCC ranking of non-financial Indian MNCs, ranked by foreign assets, 2006 (US$ million) ... 101
Table 24 - Top 18 Chinese MNCs, as ranked by foreign assets, 2008 (US$ million) ... 102
Table 25 - Sectoral distribution of Chinese capital invested abroad, 2004, 2007 and 2009 (US$ million) ... 103
Table 26 - Summary of BRIC OFDI characteristics ... 112
Table 27 - Key OFDI liberalizations in Brazil ... 118
Table 28 - Major Indian OFDI liberalization measures since 2002 ... 124
#"
LIST OF ABBREVIATIONS
(I) Internalization-specific advantages (L) Location-specific advantages (O) Ownership advantages
(Oa) Asset-specific ownership advantages (Oi) Institutional assets ownership advantages
(Ot) Transaction costs-minimizing ownership advantages ALADI Latin American Integration Association
APEX Brazilian Trade and Investment Promotion Agency ASEAN Association of Southeast Asian Nations
BCG Boston Consulting Group BIT Bilateral Investment Treaty
BNDES Brazilian National Development Bank BOP Balance of Payments
BRIC Brazil, Russia, India and China CAGR Compound Annual Growth Rate CAMEX Chamber of Foreign Commerce CCP China’s Communist Party CDB Chinese Development Bank CIC China Investment Corporation CIS Commonwealth Independent States CMN National Monetary Council
CNOOC China National Offshore Oil Corporation CNPC China National Petroleum Corporation CSA Country-Specific Assets
DPR Department for Trade and Investment Promotion DTT Double Taxation Treaty
ECGC Export Credit Guarantee Corporation
EMNC Emerging (Developing) Country Multinational
EU European Union
FDI Foreign Direct Investment FSA Firm-Specific Assets
FX Foreign Exchange
GATS General Agreement on Trade in Services GDP Gross Domestic Product
HOS Hecksher-Ohlin-Samuelson
ICBC Industrial and Commercial Bank of China ICT Information and Communication Technology IDP Investment Development Path
IFDI Inward Foreign Direct Investment
IMEMO Institute of World Economy and International Relations IOC Indian Oil Corporation
IPA Investment Promotion Agency IPO Initial Public Offering
IWG International Working Group on Sovereign Wealth Funds M&A Merger & Acquisition
MCTF Floating Exchange Rate Market MCTL Free Exchange Rate Market
#!"
MIGA Multilateral Investment Guarantee Agency MIT Massachusetts Institute of Technology MNC Multinational Corporations
MOF Ministry of Finance MOFCOM Ministry of Commerce
MOFERT Ministry of Foreign Economic Relations and Trade NOIP Net Outward Investment Position
NPC Chinese National Planning Commission
OECD Organization for Economic Co-operation and Development OFDI Outward Foreign Direct Investment
OLI Ownership, Location and Internalization ONGC Oil and Natural Gas Corporation
PDC Productive Development Programme PRI Political Risk Insurance
R&D Research & Development RBI Reserve Bank of India
RMCCI International Capital and Foreign Exchange Market Regulation SAFE State Administration of Foreign Exchange
SAIC Shanghai Automotive Industry Corporation
SASAC State Assets Supervision and Administration Commission SDRC State Development and Reform Commission
SEC Securities Exchange Commission SME Small and Medium Enterprise SOE State-Owned Enterprises SWF Sovereign Wealth Fund TNC Transnational Corporation TNI Transnationality Index
TRIP Trade-Related Aspects of Intellectual Property Rights UNCTAD United Nations Conference on Trade and Development VCC Vale Columbia Centre
#!!"
TABLE OF CONTENTS
I" INTRODUCTION!"""""""""""""""""""""""""""""""""""""""""""""""""""""""""""""""""""""""""""""""""""""""""""""""""""""""""""""""""""""""""""""""""""""!#"
1.1" CONSIDERATIONS ON THE METHODOLOGY"$$$$$$$$$$$$$$$$$$$$$$$$$$$$$$$$$$$$$$$$$$$$$$$$$$$$$$$$$$$$$$$$$$$$$$$$$$$$$$$$$$$$$$$$$$$$$$$"%&"
1.2" ORGANIZATION OF THE STUDY"$$$$$$$$$$$$$$$$$$$$$$$$$$$$$$$$$$$$$$$$$$$$$$$$$$$$$$$$$$$$$$$$$$$$$$$$$$$$$$$$$$$$$$$$$$$$$$$$$$$$$$$$$$$$$$$$$$$$$"%'"
II" LITERATURE REVIEW!"""""""""""""""""""""""""""""""""""""""""""""""""""""""""""""""""""""""""""""""""""""""""""""""""""""""""""""""""""""!$%"
2.1" MODELS OF FOREIGN DIRECT INVESTMENT"$$$$$$$$$$$$$$$$$$$$$$$$$$$$$$$$$$$$$$$$$$$$$$$$$$$$$$$$$$$$$$$$$$$$$$$$$$$$$$$$$$$$$$$$$$$$$"%("
2.1.1" Hymer’s model of oligopolistic market power!"""""""""""""""""""""""""""""""""""""""""""""""""""""""""""""""""""""""""""""""""""!#$"
2.1.2" Vernon’s model of the product lifecycle!"""""""""""""""""""""""""""""""""""""""""""""""""""""""""""""""""""""""""""""""""""""""""""""""!%&"
2.1.3" The internalization model of the MNC!"""""""""""""""""""""""""""""""""""""""""""""""""""""""""""""""""""""""""""""""""""""""""""""""""!%#"
2.1.4" The Eclectic Paradigm or OLI Framework!""""""""""""""""""""""""""""""""""""""""""""""""""""""""""""""""""""""""""""""""""""""""!%'"
2.1.5" The behavioural approach: the Uppsala model!"""""""""""""""""""""""""""""""""""""""""""""""""""""""""""""""""""""""""""""""!(%"
2.1.6" A Macro approach towards FDI: Kojima’s extended Flying Geese model!"""""""""""""""""""""""""""!()"
2.1.7" Risk diversification explanation of FDI!"""""""""""""""""""""""""""""""""""""""""""""""""""""""""""""""""""""""""""""""""""""""""""""""!(*"
2.1.8" The Investment Development Path (IDP)!""""""""""""""""""""""""""""""""""""""""""""""""""""""""""""""""""""""""""""""""""""""""""""!($"
2.2" REVIEW OF EXPLANATIONS IN LIGHT OF THE EMERGENCE OF DEVELOPING MARKET
MULTINATIONALS"$$$$$$$$$$$$$$$$$$$$$$$$$$$$$$$$$$$$$$$$$$$$$$$$$$$$$$$$$$$$$$$$$$$$$$$$$$$$$$$$$$$$$$$$$$$$$$$$$$$$$$$$$$$$$$$$$$$$$$$$$$$$$$$$$$$$$$$$$$$$$$$$$$$$$$$$$$"''"
2.3" DEBATE ON BENEFITS TO HOME COUNTRY AND GOVERNMENT SUPPORT TO OFDI"$$$$$$$$$$$$$$$$$$$$"')"
2.3.1" Empirical evidence of OFDI effects to the home economy!"""""""""""""""""""""""""""""""""""""""""""""""""""""""""""!)&"
2.3.2" Debate on the role of governments and instruments to support OFDI!""""""""""""""""""""""""""""""""""""!))"
2.3.3" Sovereign Wealth Funds!"""""""""""""""""""""""""""""""""""""""""""""""""""""""""""""""""""""""""""""""""""""""""""""""""""""""""""""""""""""""""""""!+,"
2.4" LEARNING FROM THE LITERATURE REVIEW"$$$$$$$$$$$$$$$$$$$$$$$$$$$$$$$$$$$$$$$$$$$$$$$$$$$$$$$$$$$$$$$$$$$$$$$$$$$$$$$$$$$$$$$$$$$$$$"*+"
III"OUTWARD FOREIGN DIRECT INVESTMENT FROM BRIC ECONOMIES!"""""""""""""""""""!&'"
3.1" OFDI FROM BRIC ECONOMIES: TRENDS AND PATTERNS"$$$$$$$$$$$$$$$$$$$$$$$$$$$$$$$$$$$$$$$$$$$$$$$$$$$$$$$$$$$$$$$$$$$$$"*&"
3.2" GEOGRAPHICAL DISTRIBUTION"$$$$$$$$$$$$$$$$$$$$$$$$$$$$$$$$$$$$$$$$$$$$$$$$$$$$$$$$$$$$$$$$$$$$$$$$$$$$$$$$$$$$$$$$$$$$$$$$$$$$$$$$$$$$$$$$$$$$$",,"
3.3" BRICMULTINATIONALS AND SECTORIAL DISTRIBUTION"$$$$$$$$$$$$$$$$$$$$$$$$$$$$$$$$$$$$$$$$$$$$$$$$$$$$$$$$$$$$$$$$$$$")-"
3.4" STRATEGIC DRIVERS OF OFDI BY BRICMNCS"$$$$$$$$$$$$$$$$$$$$$$$$$$$$$$$$$$$$$$$$$$$$$$$$$$$$$$$$$$$$$$$$$$$$$$$$$$$$$$$$$$"%+'"
3.4.1" Market-seeking!""""""""""""""""""""""""""""""""""""""""""""""""""""""""""""""""""""""""""""""""""""""""""""""""""""""""""""""""""""""""""""""""""""""""""""!#&'"
3.4.2" Resources-seeking!""""""""""""""""""""""""""""""""""""""""""""""""""""""""""""""""""""""""""""""""""""""""""""""""""""""""""""""""""""""""""""""""""""""!#&*"
3.4.3" Asset-and-efficiency-seeking!"""""""""""""""""""""""""""""""""""""""""""""""""""""""""""""""""""""""""""""""""""""""""""""""""""""""""""""""""!#&,"
3.5" CONCLUSION"$$$$$$$$$$$$$$$$$$$$$$$$$$$$$$$$$$$$$$$$$$$$$$$$$$$$$$$$$$$$$$$$$$$$$$$$$$$$$$$$$$$$$$$$$$$$$$$$$$$$$$$$$$$$$$$$$$$$$$$$$$$$$$$$$$$$$$$$$$$$$$$$$$$$"%%%"
IV"THE ROLE OF BRIC GOVERNMENTS IN OUTWARD FOREIGN DIRECT
INVESTMENTS!""""""""""""""""""""""""""""""""""""""""""""""""""""""""""""""""""""""""""""""""""""""""""""""""""""""""""""""""""""""""""""""""""""""""""!$$("
4.1" EVOLVING BRIC’S OFDI POLICIES"$$$$$$$$$$$$$$$$$$$$$$$$$$$$$$$$$$$$$$$$$$$$$$$$$$$$$$$$$$$$$$$$$$$$$$$$$$$$$$$$$$$$$$$$$$$$$$$$$$$$$$$$$$"%%'"
4.1.1" Brazilian OFDI policy evolution!"""""""""""""""""""""""""""""""""""""""""""""""""""""""""""""""""""""""""""""""""""""""""""""""""""""""""!##'"
4.1.2" Russian OFDI policy evolution!""""""""""""""""""""""""""""""""""""""""""""""""""""""""""""""""""""""""""""""""""""""""""""""""""""""""""""!##,"
4.1.3" Indian OFDI policy evolution!"""""""""""""""""""""""""""""""""""""""""""""""""""""""""""""""""""""""""""""""""""""""""""""""""""""""""""""""!#%#"
4.1.4" Chinese OFDI policy evolution!""""""""""""""""""""""""""""""""""""""""""""""""""""""""""""""""""""""""""""""""""""""""""""""""""""""""""""!#%'"
4.2" CURRENT BRICOFDI POLICIES"$$$$$$$$$$$$$$$$$$$$$$$$$$$$$$$$$$$$$$$$$$$$$$$$$$$$$$$$$$$$$$$$$$$$$$$$$$$$$$$$$$$$$$$$$$$$$$$$$$$$$$$$$$$$$$$$"%-&"
4.2.1" Informational and technical assistance!"""""""""""""""""""""""""""""""""""""""""""""""""""""""""""""""""""""""""""""""""""""""""""""!#(("
4.2.2" Investment protection instruments!"""""""""""""""""""""""""""""""""""""""""""""""""""""""""""""""""""""""""""""""""""""""""""""""""""""""!#()"
4.2.3" Financial and fiscal incentives!"""""""""""""""""""""""""""""""""""""""""""""""""""""""""""""""""""""""""""""""""""""""""""""""""""""""""""""!#'#"
4.2.4" Sovereign Wealth Funds!""""""""""""""""""""""""""""""""""""""""""""""""""""""""""""""""""""""""""""""""""""""""""""""""""""""""""""""""""""""""""!#'*"
4.3" DISCUSSION OF POLICY DEVELOPMENT"$$$$$$$$$$$$$$$$$$$$$$$$$$$$$$$$$$$$$$$$$$$$$$$$$$$$$$$$$$$$$$$$$$$$$$$$$$$$$$$$$$$$$$$$$$$$$$$$$$"%')"
V" CONCLUSIONS AND LIMITATIONS OF THE STUDY!"""""""""""""""""""""""""""""""""""""""""""""""""""""""""!$)'"
VI"REFERENCES!""""""""""""""""""""""""""""""""""""""""""""""""""""""""""""""""""""""""""""""""""""""""""""""""""""""""""""""""""""""""""""""""""""""!$)*"
,"
I INTRODUCTION
Until recently, developing countries were mainly viewed as recipients of foreign direct investments (FDI)1 from developed economies. As developing countries started to open up their economies in the late 1980s and early 1990s, FDI flowing into them substantially increased. In spite of rougher competition brought by foreign firms, some developing country firms have managed to catch up with their foreign counterparts and have gained leading positions in their industries.
In recent years, developing economies have actually become an important source of outward FDI (OFDI), having augmented their participation in world OFDI flows from an average around 8% between 1990 and 1992 when OFDI flows started to grow, to an average around 16% in the 2007-2009 period2. Most striking is that the growth of OFDI flows from developing economies has outpaced the growth of OFDI from developed economies. Since 2003, OFDI flows from developing economies have risen at a compound annual growth rate (CAGR) around 30% and its capital invested abroad at a CAGR of around 19% (UNCTAD, 2006).
Among the developing economies going through this process, Brazil, Russia, India and China (BRIC) have drawn much attention since the acronym first appeared (Goldman Sachs, 2001). In 2010, their economies represented the 2nd (China), 7th (Brazil), 10th (India) and 11th (Russia) largest economies in the world according to the International Monetary Fund (IMF)3. Despite such large economies, BRIC firms have just recently intensified their internationalization. Hence, BRIC OFDI flows increased substantially since 2002. This year, BRIC responded for only 1.9% of world OFDI flows. Together they also responded for around 18% of capital invested abroad from developing economies in 2002 and around 2% of world capital invested abroad. In 2009, these figures had gone up to around 26% and 3.75% respectively. In 2009, BRIC OFDI flows accounted for roughly 9% of world OFDI flows. Between 2003 and 2009, BRIC capital invested abroad have roughly grown at an annual compounded rate of 25%, reaching USD 713 billion in 20094.
""""""""""""""""""""""""""""""""""""""""""""""""""""""""
1
For definition of specific terms, please see the glossary at the end of this dissertation. 2
UNCTAD FDI database 3
IMF datamapper, US$ nominal terms 4
UNCTAD FDI database 5
Coase, R. H. (1937) ‘The nature of the firm’, Economica nº4, pp. 386-405. 6
Williamson, O. E. (1975) ‘Markets and hierarchies: analysis and anti-trust implication. New York: 2
UNCTAD FDI database 3
IMF datamapper, US$ nominal terms 4
)"
Although often put together, BRIC outward investment profiles are not entirely similar, as will be seen in chapter 3. Nevertheless, what is common to them is their recent intensification of outward investment and some similarities in regards to BRIC firms’ motivation to go abroad (Sauvant, 2005; Holtbrügge and Kreppel, 2008; Aykut and Goldstein, 2006). Moreover, they are increasingly investing in both developing and developed economies, and in some of them governments have started to actively support this movement.
This last point may seem normal for developed countries, which have long liberalized OFDI policies (Sauvant, 2005), but represents perhaps an watershed point in the political scene of most of the developing countries. Apart from some Asian countries (e.g. Malaysia, Singapore and Philippines) that liberalized OFDI policies in the 1960s and 1970s, and established OFDI supporting programs, only recently developing economies have recognized the benefits of OFDI for their companies and economies (Rasiah et al., 2010; Goh and Wong, 2010; Sauvant, 2005; Arbix et al., 2004; UNCTAD, 2006). Although the deregulation of capital controls in the 1990s opened the way for investments abroad by developing country firms, most governments were still reluctant to endorse such movements.
Among the BRIC, China has put in place an active supporting program: the Go Global policy (Luo et al., 2010). Brazil is another country that has put in place some measures to encourage OFDI, although it has not yet established a formal policy (Alem and Cavalcanti, 2005; Sennes and Mendes, 2010; Sauvant, 2005). India has also relieved restrictions in the early 2000s and has supported the internationalization of its firms (Pradhan, 2008; Kumar and Chadha, 2009; Prasad, 2009). Russia, like Brazil, does not have an explicit policy towards OFDI, although since the Puttin administration (1999-2008) it has intensified its influence on the matter (Sauvant, 2005; Filippov, 2010; Kalotay and Sulstarova, 2010). This new context shows that BRIC governments have paid more attention to the importance of the internationalization of their firms. No single model has been pursued, and instruments used to promote OFDI differ considerably across BRIC.
%+"
OFDI from developing economies is not a new phenomenon, only recently this phenomenon has gained more attention from scholars (Chudnovsky and Lopez, 2000; Aykut and Goldstein, 2006; Goldstein, 2007; Mathews, 2006; Luo and Tung, 2007; Khanna and Palepu, 2004; Van Agtmael, 2007). Before, only a few pioneering studies had focused on the subject (Wells, 1983; Lall, 1983; Lecraw, 1977).
The early work of scholars focused on the first wave of OFDI from developing economies. The first wave occurred in the 1960s and 1970s when mainly Latin American firms started to invest in their neighbouring countries in an early market-and-efficiency-seeking approach. A second wave took place in the 1980s, and was mainly dominated by newly industrialized Asian countries that begun to invest in other developing countries in search for resources and market. Recently, some authors have argued that a third wave of OFDI from developing countries, notably the BRIC, is taking place since early 2000s (Chudnovsky and Lopez, 2000; Gammeltoft, 2008).
This is more geographically distributed as Latin American firms are investing abroad again, CIS countries’ firms have initiated, Asian firms have continued, and the magnitude of developing country OFDI has consistently increased. But the distinctive feature has been the substantial increase in OFDI into developed countries as a result of technological and other asset-seeking investments by developing country multinationals (EMNCs). The main characteristics of the three OFDI waves from developing countries are described in Table 1.
%%"
Table 1 - OFDI waves from developing economies
Source: Rasiah et al., 2010.
Apart from companies, Sovereign Wealth Fund (SWFs) from both developed and developing countries have also emerged as a conduit for OFDI. Although SWFs are more likely to undertake portfolio investments, OFDI by SWFs has substantially increased since 2005 (UNCTAD, 2010, p.14). The growing importance of SWFs as direct outward investors has raised political concerns, notably in developed countries. It is argued that SWFs can be a threat to national security of host countries, as they might be politically motivated to advance a country’s foreign policy by acquiring strategic assets in host markets (UNCTAD, 2010, p.15). Among BRIC, Brazil, Russia and China have established their SWFs. India is considering the creation of one. A brief discussion on BRIC SWFs is presented in chapter 4.
%&"
In this sense, this dissertation seeks to compare OFDI policies implemented by BRIC countries as a way of highlighting policy-gaps and the effects of institutional set-ups in the development of internationalized companies. Drawing upon a comparative analysis of BRIC countries, it contributes to the understanding of this phenomenon by shedding light on how and why BRIC governments have been promoting their MNCs, and under which conditions they have moved towards an OFDI-friendly orientation. Further understanding of the role of governments in spurring developing market firms is needed to assist policy-makers in developing economies develop more adequate OFDI policies.
This dissertation intends to identify how different is BRIC governments involvement in the internationalization of their domestic firms and what are their objectives related to OFDI polices. To shed light on these issues, the following questions are addressed:
1. What has been the role of the state in the internationalization of BRIC firms since the early 1990s?
2. What has been the motivation behind BRIC policies towards OFDI?
By comparing the motivations and policy-orientation deployed by BRIC governments to support their firms’ internationalization, this dissertation contributes to further the understanding on how Brazilian and other developing market public officers can improve the business environment for their firms to compete globally in equal or better footing against their peers, and how these instruments can best be used to achieve objectives of long-term economic competitiveness of the country.
1.1 Considerations on the methodology
%-"
In order to identify what are the motivations behind BRIC OFDI policies and how much involved their governments are in the internationalization of their domestic firms, this dissertation looks for evidence in regulations, in OFDI statistics provided by UNCTAD, in the literature, in governments and public institutions websites, in public authorities speeches, and in the financial press. In order to better analyse the cases, this dissertation has created a framework of analysis based on previous literature (UNCTAD, 1995; Rasiah et al., 2010; Luo et al., 2010; Alem and Cavalcanti, 2005).
It begins by analysing the main trends and motivations driving OFDI by BRIC MNCs. This is achieved through OFDI and M&A data analysis, literature review, and illustrative examples of BRIC MNCs. This is further contrasted with OFDI policies implemented by BRIC governments, as evidenced by regulations and speeches by government officials.
To further the understanding of involvement of BRIC governments in the internationalization of domestic firms, this dissertation conducts a comparative analysis of historical changes in regulations and policies, and of current OFDI policies in place in these countries. Essentially, the range of policies goes from restrictive, permissive and proactive. Current OFDI policies are clustered into three broad categories (Table 2): financial and fiscal support, information and technical assistance, investment protection (UNCTAD, 1995).
%'"
Table 2 - OFDI supporting instruments for analysis
Source: author
1.2 Organization of the study
The second chapter contains the relevant literature review. The first section of the literature review explores the main models explaining FDI: Hymer (1960, published in 1976) ownership specific advantages model; the product lifecycle (Vernon, 1966); the OLI or Eclectic paradigm (Dunning, 1977); the risk diversification hypothesis (Rugman, 1975); the Uppsala model (Johanson and Vahlne, 1977); Kojima’s (1973) extensions of the Flying Geese model (Akamatsu, 1935); and the International Development Path (IDP) (Dunning and Narula, 1996).
The second section of the literature review explores the advancements on FDI models in light of the emergence of developing country multinationals (EMNCs). Essentially, it reviews the earlier explanations of EMNCs advanced by Wells (1983), Lall (1983), Lecraw (1977), and the most recent ones by Mathews (2006), Luo and Tung (2007) and Khanna and Palepu (2004).
The third section of the literature review deals with the debate on how beneficial is OFDI to the home economy, drawing on existing empirical studies to support the theoretical debate (UNCTAD, 1995; Lipsey, 2002; Globerman and Shapiro, 2008; Moran, 2008; Kokko, 2006; Navaretti and Venables, 2004; Arbix et al., 2004).
!"#$%&'(&)*%+,-.$*+% /*%+,-.$*+% 01#23*3+)'*%
!"#$%&'()$"*'"+* (,-.")-'/*'00)0('"-,
1,",%'/*)"#$%&'()$" 2$3"(%4*)"5,0(&,"(*63)+,07*/,6'/*'"+*'+&)")0(%'()5,*#%'&,8$%9:* )"#$%&'()$"*';$3(*.$&,*'"+*.$0(*-$3"(%4*03<<$%(:*.$0(*-$3"(%4* &'-%$,-$"$&)-*'"+*;30)",00*-$"+)()$"0:*.$0(*&'%9,(*$<<$%(3")(),0 ='(-.&'9)"6 >?@!*<%$A,-(0*+'(';'0,:*/$-'/*<'%(",%0*0,'%-.*'"+*)"(%$+3-()$"0 B%$A,-(*+,5,/$<&,"(*'"+*0('%(C3<*
'00)0('"-,
D00)0('"-,*)"*#)"+)"6*#)"'"-)"6:*)"*<%,<'%)"6*/,6'/*+$-3&,"(0:*)"* -$&</4)"6*8)(.*.$0(*-$3"(%4*%3/,0:*'"+*-$"('-(0*8)(.*.$0(*-$3"(%4* -$"03/()"6:*/,6'/*'"+*'--$3"()"6*0,%5)-,0
E30)",00*<%$&$()"6*&)00)$"0 !"5,0(&,"(*&)00)$"0:*(%'+,*#')%0:*'"+*0,&)"'%0
E30)",00*)"(,//)6,"-,*03<<$%( ?,'0);)/)(4*'"+*&'%9,(*0(3+),0:*)"+30(%4*%,<$%(0:*+)0(%);3()$"*'"+* /$6)0()-0*03<<$%(*</'"")"6:*'&$"6*$(.,%0
?)"'"-)'/*'"+*#)0-'/ F$'"0G2%,+)(*03<<$%( 2%,+)(*03<<$%(*#$%*,H3)(4*)"5,0(&,"(*';%$'+
IH3)(4*03<<$%( IH3)(4*)"5,0(&,"(*#$%*03<<$%()"6*(.,*)"(,%"'()$"'/)J'()$"*$#*#)%&0 @$3;/,*('K'()$"*(%,'(),0*L@MM0N M.,*"3&;,%*$#*@MM0*;4*0('(,*'6,"-),0
M'K*03;)0)+),0 M.,*,K)0(,"-,*$#*03;0)+),0*03<<$%()"6*(.,*)"(,%"'()$"'/)J'()$"*$#* +$&,0()-*#)%&0
%."
Chapter 3 explores the trends and patterns of OFDI by BRIC MNCs, including their destinations, entry-modes, main investors and motivations. For this, both quantitative data provided by Central Banks, UNCTAD and research centres, and extant studies from both domestic and international researchers are used. This serves as a departing point to analyse governments’ motivations to support the internationalization of their firms.
Chapter 4 discusses the role of the state in the development of BRIC MNCs. It looks into the historical changes in outward policies of BRIC countries, and how these policies have influenced OFDI patterns. Moreover, it discusses their current policies towards OFDI, and compares what kind of policies these countries have put in place to assist their domestic companies.
%("
II Literature Review
2.1 Models of Foreign Direct Investment
The post industrial revolution era has had two intense periods of globalization: a) 1850 – 1914 when the falling transportation costs and migration led to a convergence between Western economies at the time (Williamson, 1998); b) from 1960 on, when the liberalization of international trade, the changes in the international monetary system and also the falling transportation and communication costs have led to rapid rise in: i) international trade (Crafts and Venables, 2001); ii) in FDI, especially after 1984; iii) global financial integration (Baldwin and Martin, 1999).
Nested in the second globalization wave, several models on firms’ internationalization emerged. These focused on explaining cross-border investment flows from one developed economy to another (from the US to Western Europe, and vice-versa), which dominated the FDI environment in the post-war period. In the 1970s and 1990s, scholars’ attention also turned to the internationalization of advanced country firms into developing economies. With both investment flows (North-to-North and North-to-South) in mind, scholars’ focused on explaining why companies would invest abroad and what capabilities they were able to leverage internationally in order to compete with indigenous companies in the local markets. Drawing upon the rising American MNCs, the most prominent models were advanced by Hymer (1960, published in 1976), the ownership market power, and by Vernon (1966), the product lifecycle explanations.
%*"
Among the scholars focusing on economic reasons to internationalization, Kojima (1973) sought to explain a country’s propensity to engage in foreign production based on extensions of international trade theory; Buckley and Casson (1976, 2003), Buckley (1990), and Rugman (1981, 2009), building on transaction costs economics, argued that a firm’s internationalization is based on its need to operate in the market for intermediate products on an multi-country level; Dunning (1980) builds on earlier models to create a general framework that intends to explain the multinational firm development according to three economic reasons: ownership-specific advantages, location-specific advantages and internalization-specific advantages. Since then, Dunning has refined his work to incorporate recent evolution of the modern MNC, and to explain the pattern of inward and outward FDI in a country at different development stages (Dunning and Narula, 2000).
Most of these models addressed developed country MNCs since at the time there was almost no FDI from developing country firms. When the first wave of outward investments from developing countries occurred in the 1970s and early 1980s, scholars recurred to the existing models of the MNC. The early studies on EMNCs focused on the differences between the new South-to-South flows and the traditional North-to-North and North-to-South investment flows (Wells, 1983; Lecraw, 1977; Lall, 1983). Nevertheless, as Wells (2009:24) stated, much of the work was embedded in the broad political agenda and little attention was given to how “third-world MNCs” actually fit the general models of “multinationalization”.
Recently, with global integration and increasing participation of developing economies in world FDI flows during the 1990s and 2000s, scholars have once again given attention to developing country MNCs. As these firms sometimes pursue different internationalization strategies (Agtmael, 2007), and their investments pattern often deviates from its developed country counterparts, as well as the institutional context in which they occur, some scholars have argued that the existing models, though valid, may not be the most appropriate to fully capture the essence of rising EMNCs (Matthews, 2006; Luo and Tung, 2007; Rasiah et al., 2010).
%,"
reasonable framework for understanding the emergence of developing market MNCs and their strategies to compete in world markets.
2.1.1 Hymer’s model of oligopolistic market power
With the surge of FDI from American MNCs in the post-war period, the existing models used to explain all kinds of international investment flows – notably the international portfolio model – became more and more inadequate to explain cross-border investments in production abroad (Buckley, 2011; Dunning and Rugman, 1985). Hymer’s (1960, published in 1976) dissatisfaction with the model is due to its lack of explanatory power when risks and other structural transaction costs were incorporated to the model, denoting that these market imperfections actually changed the strategies of firms servicing foreign markets. Based on the industrial organizational model, he shifted the focus of models from states to firms (Dunning and Lundan, 2008: 84).
Under financial market imperfections, insufficient information, risks and uncertainty, and an oligopolistic industrial structure, the MNC would prevail over international trade between firms, because by internalizing the functions of commercial partners the MNC can reduce uncertainty, improve resource efficiency and mainly reduce competition (Hymer, 1968). According to Hymer (1970), “multinationals are a substitute for the market as a method of organizing international exchange”. By integrating internationally or expanding abroad, companies were able to reduce competition in industries facing entry barriers that sustained local monopolies, and thus internalize the pecuniary externalities that this sort of competition created.
%)"
Hymer’s seminal model of the MNC postulates that for firms to engage in FDI they need to rely on ownership-specific advantages that host country indigenous firms do not possess, and that these advantages have to be capable of overcoming the liabilities of foreignness, such as lack of knowledge of local customs, laws and norms, language differences, and exchange rate fluctuations. He argues that firms would expand abroad to exploit their proprietary or monopolistic power, which refers to advantages arising from the ownership of patents, brands, production and management skills. In this sense, the MNC is a product of market structural imperfections, which enables them to derive monopolistic power from their ability to transfer ownership-specific advantages (e.g., patents, brands, management and production skills) abroad that host country firms do not possess without loosing control over them, as could be the case under licensing agreements for instance.
However, as Dunning and Rugman (1985) note, by overly focusing on the MNC desire to advance its monopolistic power and, thus, “separate markets and prevent competition”, Hymer failed to acknowledge other forms of transaction costs influencing this process. Notably, he missed that MNCs might substitute markets for efficiency reasons, such as reducing costs, improving product quality and fostering long-term competitiveness, and as well increase their market power due to their “ability to use internal markets across nations”.
&+"
2.1.2 Vernon’s model of the product lifecycle
Vernon (1966) takes a quite different approach. Drawing upon the microeconomic model of the product cycle and newer trade models available in the early post-war period, he develops his model of the MNC as an evolution of technological leadership, productivity differentials and industry maturity levels. He argues that not only factor endowments influence the propensity of a country to engage in international trade activities, but also the capability of its firms to leverage its assets and develop new ones, notably technologies. He claims that the structure and pattern of home-country institutions, factor endowments and markets, in addition to the entrepreneurial spirit of firms, contributes to create competitive advantages (Porter, 1980) that firms need to compete in international markets.
Vernon develops his model based on the American MNC and the American economy of the time, which were marked by high unit labour costs and high-income levels. He argues that effective communication between the demand and the supplier is a driver for spurring innovations in certain products that either serve high-income individuals or that substitute capital for labour. Producers would be willing to undertake the risks of product development due to unmet needs of customers and the associated earlier monopoly benefits they gain from being the first movers. He asserts that production serving the domestic market initially locates near its innovation activities and/or markets, and not necessarily the lowest cost location, notably due to the need of production flexibility for adjustments and a swift and easy communication between the demand and the supplier.
&%"
such as trade barriers and/or the possibility of local entrepreneurs setting up production units in target markets.
However, as Vernon (1979) recognizes later on, the explanatory power of his model became less satisfactory in the view of the increasing global reach of MNCs involved in production of new products, and in face of reducing differences between the American economy and other advanced industrialized countries. The prevailing different conditions in the early post-war period are no longer the same, two to three decades later, in both market size and factor cost configuration terms. As Dunning and Lundan (2008: 86) highlight, his model did not explain other FDI motivations, such as efficiency-seeking and asset-seeking. Fleury and Fleury (2011: 71) also note the product cycle failed to explain the internationalization of Swedish firms, which were obliged to internationalize earlier due to the small domestic market.
Nonetheless, although recognizing its hypothesis limits, Vernon (1979) argues that the product lifecycle model of the MNC is probably still valid for small innovative firms. However, these firms might not be able to sustain innovation lead for long time because the speed of imitation and capacity of local innovators to come up with similar products are higher due to similar home conditions in other countries.
Vernon (1979) also argues that firms from rapidly industrializing countries possibly follow the lifecycle hypothesis, exploiting markets in less developed countries, pointing to Wells (1983) as an early evidence of this movement. But Vernon recognizes that, at that time, these investments had much more to do with oligopolistic power than with technological leadership. His model also does not explain direct investments from developing countries into developed economies, as they lack technological firm-specific advantages enabling them to compete in such markets. Nevertheless, his evolutionary model, linking international trade and foreign production, together with Hymer’s industrial organization approach, helped build additional models of the MNC (Dunning and Lundan, 2008: 87).
2.1.3 The internalization model of the MNC
&&"
labour. The interaction between these two forces (internalization pressure and location costs) determines the industry structure internationally. As Buckley (1988) explain, these two are related since the MNC’s ability to use international transfer pricing in its benefits also favours the location of international activities in low-tax regions. Building upon the transaction costs theory, having its roots in Coase (1937, in Buckley and Casson, 1976, p. 220)5, the internalization model of the MNC, developed by Buckley and Casson (1976) and Rugman (1981), among others, works to explain why firms become MNCs within the hierarchies versus markets discussion (Williamson, 1975, idem)6.
Simply put, Buckley and Casson (1976) consider two types of costs associated with international activity: transaction costs associated with markets for intermediate products and coordination costs associated with the use of company’s resources. Whenever the external transaction costs are higher than the internal transaction (coordination) costs, the company would rather internalize the market. Essentially, this means that in the presence of market imperfections, the MNC organizes its activities internally in order to exploit its firm-specific advantages in knowledge and other intermediate products (Rugman, 1981). As Dunning and Lundan (2008: 94) elucidate, the model seeks to explain the relative costs and benefits of the intra-firm international division of labour (hierarchy) in contrast to the inter-firm form of organization (market).
Further, Rugman and Verbeke (1992), recognizing that a MNC have a firm-specific advantage (FSA) that can be technology-base, knowledge-based or reflect organizational skills, extend the internalization analysis to incorporate a dynamic location variable (country-specific advantages). While FSAs represent firm’s proprietary unique capabilities, CSAs refer to country factors that are unique to business operating in that particular location, such as natural and factor endowments, cultural factors, and institutional factors. Rugman (1981) argues that the interaction between available FSA and CSA determines the way a firm allocates resources and coordinates its use worldwide.
Essentially, FSAs result from MNC’s ability to economize on transaction costs as a result of the hierarchical coordination and common governance of assets. CSAs result from MNC’s
""""""""""""""""""""""""""""""""""""""""""""""""""""""""
5
Coase, R. H. (1937) ‘The nature of the firm’, Economica nº4, pp. 386-405. 6
&-"
ability to reduce risk (Rugman, 1976) and benefit from specific local opportunities. As Rugman and Verbeke (1992) highlight, it is the MNC dynamic ability to combine both FSA and CSA that lead to new or extended FSAs. Citing earlier works, Buckley (1988: 182) shows that transaction costs are high in “vertically integrated process industries, knowledge-intensive industries, quality assurance-dependent products and communication-knowledge-intensive industries”, and argues that these industries see the predominance of multinational organizations.
However, he reminds that this is a dynamic process and that industrial structure and firms’ core competences determines the level of control a firm seeks to have. This explains why MNCs in the 1980s were starting to forego control of production in favour of control of marketing and distribution. This came in a time when the internalization model was being contested in face of the increasingly renowned Japanese management model, and “the rising tendency towards externalization rather than a rising degree of internalization” (Fleury and Fleury, 2011, p.73).
Dunning and Lundan (2008: 94) also argue that there is also a need to consider location-specific variables to the model in order to fully explain the MNC activity. Rugman (1981) introduces location specific variables, but does not consider that these can eventually become firm-specific assets (FSA) as well. Moreover, the model does not deal explicitly with the ownership-specific advantages that MNCs should possess in order to overcome the liabilities of being a foreigner, as Hymer (1970) had postulated. In the Internalization model, all FSAs are efficiency-based in light of transaction costs, and are not treated in terms of monopolistic advantages (asset-based ownership advantages) as Hymer advocated. In this sense, although helping understand why firms would go abroad, the internalization model fails to explain which firms are prone to undertake OFDI.
&'"
2.1.4 The Eclectic Paradigm or OLI Framework
The Eclectic Paradigm or OLI Framework7 is the outcome of a major systemizing effort of Dunning (1977) to put together explanations given by previous FDI models. As a framework, it attempts to provide a general conceptual structure for explaining what is the level and structure of a firm’s foreign activities, rather than predicting what it should be (Dunning and Lundan, 2008: 95). Dunning’s Eclectic Paradigm was first published in 1997 and refined and improved many times since then. It has become the main reference in international business literature. Basically, Dunning (1977) acknowledges that there are several reasons why firms invest abroad, and that these reasons differ according to industries and countries (home and host) concerned.
The Eclectic Paradigm builds upon modern international trade theory – the Heckscher-Ohlin-Samuelson (HOS) model – and other microeconomic theories of the firm, such as Hymer’s (1968) oligopolistic power and the previous internalization model. It agrees with the HOS theory that the distribution of factors endowments and capabilities determines the location of production. However, it argues that location-specific endowments8 are not sufficient to determine international activity of MNCs. Firms only engage in foreign production if two types of market failures are present: Hymer’s type of structural market imperfections which discriminates between firms in their ability to control and manage ownership-specific advantages; and transactional imperfections of intermediate product markets in transacting them more efficiently (at lower cost) than a hierarchy (Dunning and Rugman, 1985).
As Dunning and Lundan (2008: 97) clarify, the locational choice in the production of intermediate products relates to the decision export versus licensing, rather than export versus foreign direct production. This arises when there are imperfections in the market for intermediate products, leading the company to choose a hierarchical organization of foreign activity. Basically, the existence of ownership-specific advantages, which can be created or even purchased, helps determine which firms will supply international markets; location-specific advantages shape how the firm will supply the foreign market, either through exports
""""""""""""""""""""""""""""""""""""""""""""""""""""""""
7
OLI stands for ownership, locational and internalization advantages 8
&."
or local-production, but does not determine under whose ownership foreign production would occur.
However, it is the internalization forces driven by market failures that determine if the company will internalize the exploitation of its ownership-specific advantages or will sell/lease its advantages to a local firm exploit them. Thus, the decision to invest abroad can be explained by the OLI framework: the company will invest if it perceives gains of market power by the ownership (O) of products and production processes; if the company has location (L) advantages in locating their plant in foreign country; or if they achieve advantages of internalizing (I) their foreign activities in fully owned subsidiaries.
Ownership-specific advantages arise from a firm’s ability to bundle and access resources more efficiently than its competitors in a way that it creates, although it might even purchase, some sort of proprietary right of use. These ownership advantages include both intangible assets, such as brands, access to institution, technology, organizational skills, entrepreneurial capacity, and other assets arising from the coordination and governance of activities, such as access to raw materials, control of distribution channels, economies of scale. It is the possession of such ownership advantages that gives a MNC the competitive advantage it needs to overcome the barriers of operating internationally. The more it possesses ownership advantages relative to firms from another country, the more is the incentive to internalize their use and exploit them in foreign markets.
Although ownership advantages might often be linked to location endowments, their use is not so confined, giving MNCs the power to exploit these ownership advantages and extract monopolistic rents from it abroad. The fact that MNCs operate in different locations also gives them an additional ownership-specific advantage. Contrary to local competitors, a MNC can reduce risk by diversifying assets allocation; reduce supply disruption risks and uncertainty by shifting production between locations more easily, engage in international transfer pricing.
&("
coordinating such asset-specific advantages. These are referred to as transaction costs-minimizing advantages, which relates to the advantages of common and complementary governance of assets, such as economies of scale and scope, size, product diversity, favoured or exclusive access to raw material and product markets, access to resources of parent company at marginal cost, and bargaining power. Finally, there are also ownership advantages that arise from institutional assets that govern activities within firms, and between firms and stakeholders, such as corporate culture, incentive and appraisal systems.
The (L) location-specific advantages refer to the benefits of producing in a particular place as, for instance, lower production and trade costs, economies of agglomeration and spillovers, better institutional framework. Local production also allows companies to better tailor their final product to local demand (e.g., car manufacturers are able to avoid tariffs and trade barriers). Locating production in the target market might also reduce the marginal cost of supplying the market, by saving trade costs, compared with serving the market through imports (Navaretti and Venables, 2004, p. 30).
However, as Navaretti and Venables (2004: 31) explain, there are trade-offs between locating production abroad and serving the market through exports. This has to do with essentially two types of FDI: horizontal and vertical FDI. The former refers to the set up of a foreign plant, in addition to the home plant, that duplicates the same stage of the production process (e.g., an assembly plant). The latter refers to splitting the different stages of the production process across different locations.
Firms in industries, in which the firm-level activities are a major source of economies of scale, and plant-level economies of scale are minor, are more likely to undertake horizontal FDI. Firm-level assets include asset-specific advantages, such as patents, brands, and management skills. In these industries, however, production can easily be located abroad and even duplicated because the firm will increase returns on economies of scale at the firm-level assets. The benefits from market access and the exploitation of firm-level economies of scale are higher than the foregone economies of scale at the plant level. This tends to be the case in industries such as chemicals and automobiles.