PORTUGAL,1801–1930
Luís Espinha da Silveira, Daniel Alves, Nuno Miguel Lima,
Ana Alcântara, Josep Puig
Population and Railways in Portugal, 1801–1930
With a few exceptions, Portuguese historiography has adopted a pessimistic view regarding the contribution of the railways to the development of the country. In fact, available studies emphasize the prevalence of private and foreign interests, as opposed to those of the nation. They also underline the ªnancial burden of railway construction for the state, and the corruption associated with it, as well as the incapacity of the Portuguese economy to supply the capital and industrial goods necessary for the development of the railway network. Recent literature examines the role of the rail-ways in the relocation of industry during the ªrst half of the twen-tieth century and the link between this new means of transport and the country’s urban network, focusing mainly on Lisbon and Oporto.1
Luís Espinha da Silveira is Associate Professor, Faculty of Social Sciences and Humanities, New University of Lisbon. He is the author of Território e Poder: Nas Origens do Estado Contemporâneo em Portugal(Cascais, 1997); editor ofOs Recenseamentos da População Portuguesa de 1801 e 1849: Edição Crítica(Lisbon, 2001).
Daniel Alves is Assistant Professor, Faculty of Social Sciences and Humanities, New Uni-versity of Lisbon. He is the author ofA República atrás do balcão: Os lojistas de Lisboa na fase ªnal da Monarquia (1870–1910)(Lisbon, 2010); “Entre o balcão e a política: os lojistas de Lisboa e o republicanismo (1870–1910),”Ler História,LIX (2010), 101–123.
Nuno Miguel Lima is a doctoral student, Faculty of Social Sciences and Humanities, New University of Lisbon. He is the author ofOs “Homens Bons” do Liberalismo: Os Maiores Contribuintes de Lisboa (1867–1893)(Lisbon, 2009); “Henry Burnay no contexto das fortunas da Lisboa Oitocentista,”Análise Social,XLIV (2009), 565–588.
Ana Alcântara is an MSc student in Geographical Information Systems and Science, ISEGI, New University of Lisbon, and a research assistant, beneªting from a research fellow-ship [SFRH/BTI/33380/2008] awarded by the Fundação para a Ciência e a Tecnologia within the project (INVENT/0001/2007).
Josep Puig is agistechnician and an MSc student, University of Lleida, and a research as-sistant, beneªting from a research fellowship [SFRH/BTI/33897/2009] awarded by the Fundação para a Ciência e a Tecnologia within the project (INVENT/0001/2007).
This article was produced within the research project “The Development of European Waterways, Road and Rail Infrastructures: A Geographical Information System for the His-tory of European Integration (1825–2005),” as part of the EUROCORES program of the Eu-ropean Science Foundation. It was ªnanced by the Fundação para a Ciência e a Tecnologia in Portugal (INVENT/0001/2007).
© 2011 by the Massachusetts Institute of Technology and The Journal of Interdisciplinary History, Inc.
This article is centered on the relationship between the rail-ways and demography—the inºuence of accessibility to railrail-ways on the evolution of population, urban centers, and internal migra-tion. It pays particular attention to the way in which trains have inºuenced the population and urban dynamics of different re-gions, suggesting that they had a positive impact on population growth, urban development, and internal migration. Their effect, however, was not the same in all parts of the country; in reality, railways seem to have reinforced pre-existing regional inequalities. The period under study, from 1801 to 1930, includes the years before the arrival of trains in1856, thus allowing a long-term perspective. Nonetheless, this article pays special attention to the decades that witnessed the construction of the railway network; the analysis ends with the ascendance of modern roads. Indeed, in Portugal, as in the rest of Europe, motorization became a central issue after World War I. Following a movement sponsored by the League of Nations that promoted the road network as an increas-ingly vital element in the transport system in 1927, theJunta Autó-noma das Estradaswas created to undertake a major restructuring of the country’s roads. Alongside the government’s initiative came an increase in passenger-bus services, which clearly competed with the railways during the 1930s.2
The research herein used a set of tools capable of treating considerable amounts of historical data, such as population cen-suses; in the process, thousands of records were gathered. The re-lational database created to manage this information was linked to a geographical information system (gis) representing cartograph-ical data and allowing the development of spatial and quantitative analyses that would otherwise have been difªcult to perform.
A organização dos transportes em Portugal (1850–1910): As vias e o tráfego(Lisbon, 1990); Álvaro Ferreira da Silva and Lara Tavares, “Transport History in Portugal: A Bibliographical Over-view,” in Michèle Merger and Marie-Noëlle Polino (eds.),COST 340: Towards a European Intermodal Transport Network: Lessons from History: A Critical Bibliography(Paris, 2004), 126–136; Maria Eugénia Mata and Tavares, “The Value of Railways for Portuguese Consumers on the Eve of the First World War,”Transportes, Servicios y Telecomunicaciones,VII (2004), 81–100; Mata, “As Bees Attracted to Honey: Transport and Job Mobility in Portugal, 1890–1950,”
Journal of Transport History,XXIX (2008), 173–192; Ângela Salgueiro,A Companhia Real dos Caminhos de Ferro Portugueses, 1859–1891(Lisbon, 2008); Pinheiro,Cidade e caminhos de ferro
(Lisbon, 2008).
2 Frank Schipper,Driving Europe: Building Europe on Roads in the Twentieth Century (Amster-dam, 2008), 121–157; Lopes Vieira, “Os transportes rodoviários em Portugal, 1900–1940,”
concepts, methodologies, and sources
Maps and Data Interpolation Portugal’s smallest territorial unit is the parish. In 1911, the year that serves as a reference for data in-terpolation in this article, the vast majority of them (68 percent) were smaller than 20 km2 in area, although there were important
regional differences. The parishes were also the most stable territo-rial units, totaling 4,100 in 1801, 3,640 in 1911, and 4,005 in 1991.
No systematic records of the changes to parish boundaries ex-ist almost to this day. To retrace the hex-istory of these units means relying on the lists of parishes published during the great territorial reforms of the ªrst half of the nineteenth century and on those of the population censuses. Other sources include cartography, gaz-etteers, and local histories. Analysis of the available data indicates that the change in the number of these territorial divisions over time resulted mainly from the merging of two or more parishes or from the splitting of a parish into two or more units. Given the lack of systematic information, it is almost impossible to map de-tailed changes of their boundaries, especially in the nineteenth century. Thus, the maps produced in this article covering the peri-od from 1801 to 2001 represent those mergers or divisions without any of the micro-changes that might have occurred, except in the most important cases, among them in the city of Lisbon. The mapping process employed a retrospective methodology, starting from current maps to draw the older ones.3
The declining number of parishes before 1911 and the subse-quent increase, with obvious implications for the average area per parish, poses certain difªculties when comparing data from various censuses. It risks the inªltration of errors and bias into the analysis. This situation is no different from that in other countries. Various methods have been proposed to overcome these problems,
ing from the areal-weighting interpolation technique to more complex models.4
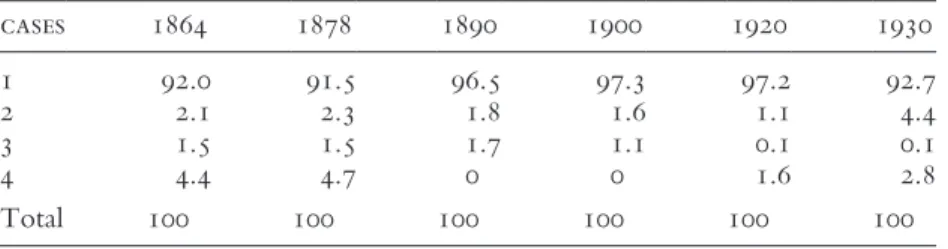
The procedure adopted for this article attempted to minimize errors by identifying the year that required the smallest number of splits in the interpolation process, thus affecting the lowest per-centage of the total population. The year1911 qualiªed since it had the smallest number of parishes, and it occupies a central point in the period under consideration. As can be seen in Table 1, the overwhelming majority of people in the various censuses were not affected by the interpolation process; the parishes where they were registered suffered no boundary changes between the source and the target years (case 1). However, three other cases were possible—the merging of two or more parishes between the source year and the target year (case 2); the division of a parish in the source year into two or more parishes in the target year (case 3); and the particular case of Lisbon’s urban parishes, which had their limits profoundly organized in 1885 (case 4). Case 2 re-quired only the aggregation of data in the target year, whereas cases 3 and 4 required the interpolation procedures described be-low.
With regard to Lisbon, we decided to use the interpolation method by weighting areas, recognizing that this procedure could generate errors, partly due to differences in population density be-tween the interpolated areas, especially when they were both rural and urban. However, in the case under consideration, the parishes
4 Ian Gregory and Paul Ell, “Breaking the Boundaries: Geographical Approaches to Inte-grating 200 Years of the Census,”Journal of the Royal Statistical Society Series A, CLXVIII (2005), 422–426;idem,“Error-Sensitive Historical GIS: Identifying Areal Interpolation Errors in Time-Series Data,”International Journal of Geographical Information Science,XX (2006), 136– 138.
Table 1 Population Affected by the Interpolation Process (%)
cases 1864 1878 1890 1900 1920 1930
all formed part of the urban center, having approximately the same population density and thus minimizing the errors introduced by this technique. Given that the division of parishes in Portugal sel-dom involved the level of fragmentation detected in other coun-tries (like Britain), case 3 had no need for complex methodologies. The simple procedure proceeded in four steps: (1) selecting the parishes, in the target year, that corresponded to the division of the parish in the source year; (2) calculating the total population of the target year for all the parishes selected in (1); (3) dividing the population of each parish in the target year by the total calculated in (2); (4) multiplying each of the coefªcients obtained in (3) by the total population of the source parish to calculate the propor-tion of populapropor-tion to be allocated to each parish in the target year.5
The methodology described so far allows the representation of data from the censuses carried out between 1864 and 1930, us-ing the parish map of 1911. Even though this methodology carries a risk of error, the percentage of the population affected by these operations never reached more than 6 percent of the total (cases 3 and 4) and remained below 3 percent in most years, ensuring a data set and a geographically uniform basis for comparisons over time with a relatively high level of reliability (Table 1).
Regions In a classic work published in 1945, Ribeiro argued that Portugal could be divided into three regions—Atlantic North, In-land North, and South. These regions were distinguishable by such characteristics as terrain, climate, settlement, patterns of land-holding, and social structure. In Ribeiro’s view, the individuality of these areas also had deep historical roots. The Atlantic North included the lowlands of the coast, with a mild climate, dispersed settlement, and rich agriculture, where small and medium-sized rural properties were dominant and urban life was traditionally important. The Inland North corresponded to the highlands, with a continental climate and poor agriculture, a sparse population, and a small number of urban centers. The South featured large plains and a Mediterranean climate, where landscape was
sively marked by thelatifundia,generating a particular social struc-ture. The population lived mainly in villages, and urban centers had a certain degree of importance. Ribeiro’s regional division in-ºuenced many historians, including Mattoso, who studied the ori-gins of Portugal using this conceptual framework. Taking a differ-ent perspective, Justino, in his analysis of the developmdiffer-ent of the domestic market, noted the contrast between two regions—the North, clustered around Oporto, and the South, centered on Lisbon.6
The territorial division based on three areas seems appropriate for a study on the effect of accessibility to railways, since it sepa-rates the mountainous region of the North, which has historically suffered from difªcult communications. It also helps to consider trends in Portugal within the broader context of the Iberian Pen-insula as a whole, as will be evident in due course. But in thegis employed in this study, Ribeiro’s boundaries were modiªed prin-cipally to take the geographical relief into better account, given its inºuence on accessibility. Hence, the Atlantic North region was deªned as the coastal area north of the river Tagus below 300m al-titude. This area is separated from the Inland North by the moun-tains parallel to the coast. The mounmoun-tains also deªne the boundary between this region and the Mediterranean South, where the overwhelming majority of the land is again below 300m altitude (see Figure 1).
Urban Population The deªnition ofurban center is a popular topic within Portuguese and international historiography. Along with the various criteria that scholars have proposed, those evinced by the primary sources must also be taken into account. The deªni-tion ofurban centerherein is an agglomeration with ade facto popu-lation of 5,000 or more inhabitants in its total number of parishes. The parish can stand as the fundamental unit because it is the most detailed one that is common to every Portuguese census and the only one that can support a comparative historical, urban spatial analysis. The adoption of the minimum limit of 5,000 inhabitants was borne of the need to take into account the small size of
Portu-6 Orlando Ribeiro,Portugal, o Mediterrâneo e o Atlântico: estudo geográªco(Coimbra, 1945);
guese urban centers throughout the period covered by the data-base.7
To select the urban agglomerations existing throughout the different years and to avoid the inclusion of parishes with large but scattered populations that were not part of any urban center, the censuses from 1911 and 1940 were used as ancillary data. In fact,
7 The ªgure of 5,000 inhabitants was adopted as a quantitative criterion for selection of the urban population starting with the 1890 census. Hitherto, cities—including district capitals,
these censuses identify not only the total population of each parish but also the people living in each of its settled areas. The 1911 cen-sus helped to identify urban centers in 1864, 1878, 1890, and 1900, and the 1940 census disclosed the centers in 1920 and 1930.
Accessibility Since parishes are the smallest territorial units on a map that can provide population data, they would seem to be a good place to start when exploring railway accessibility. In the original outline for this study, a parish had access to a railway only when it had a station. This criterion proved to be too restrictive, especially in ºat-land areas, since it tended to exclude neighboring parishes with a station not far away. Therefore, the understanding of accessibility was broadened to include parishes with a centroid no more than 5 km away from a station. The application of these two conditions turned out to be well suited to the characteristics of the different regions. The criteria chosen apply equally to areas where the parishes are small and to others where they are larger, as well as to ºat-land and mountainous regions
Migrant Population The censuses do not contain data about mi-grant populations. However, since 1890, they indicate, for each parish, the number of people born outside the municipality where they were at the time of the survey. Unfortunately, the sources disclose neither where these people lived nor their place of birth, information that is crucial to the study of migration movements. In any case, the data supplied are suggestive, although they must be treated with great caution. They provide, above all, an idea of how attractive various places were for migrants.
The Source and Quality of the Population Data The population data in this article come from nine different censuses. The oldest one, in 1801, was performed by the church hierarchy, acting independ-ently, although in response to a governmental requirement, and it was based on the parish registers; the same registers were also the source of the 1849 census, but, on this occasion, priests acted un-der the authority of state ofªcials. who supervised the entire pro-cess. In the history of population censuses in Portugal, 1864
sents the beginning of the modern era, since the census of that year, was executed at a given date by public authorities, who col-lected the information using the same questionnaire all over the country. Despite its ecclesiastical origins, the 1801 census is con-sidered a reliable source.8
the construction of the railways Until 1822, Portugal was the head of a vast colonial empire centered on Brazil. Brazil’s in-dependence caused Portugal severe economic difªculties for de-cades especially in its Atlantic North region, where most of the commercial and industrial activities were concentrated. Portugal began to recover in the second half of the nineteenth century, but agriculture continued to be a dominant activity despite the relative dynamism of the industrial sector, the growth rate of which was not fast enough to keep up with that of more advanced countries.9
The construction of the railways was part of an attempt to modernize the country. Portugal’s ªrst railway track, which ran between Lisbon and Carregado in 1856, was 36 km long. By that time, England had more than 10,000 km of track; France had al-most 6,000 km; and even Spain had about 500 km.10
The reason for Portugal’s late start is rooted in its political in-stability, its economic difªculties, and its strategic uncertainty re-garding the nature of the railway sector. One of the key issues was whether the government would construct and operate the railway itself or merely give a boost to private enterprise. There were also doubts regarding the form of ªnancial support to be provided by the state. Moreover, the plan for the network was long in the making; when it was completed in 1877, Portugal already had ap-proximately 1,000 km of railways.11
The prevailing practice was a mixture of private enterprise
8 Silveira (ed.),Os Recenseamentos da População Portuguesa de 1801 e 1849, Edição Crítica (Lis-bon, 2001).
9 Justino,A formação do espaço económico nacional;Jaime Reis, “The Historical Roots of the Modern Portuguese Economy: The First Century of Growth, 1850s to 1950s,” in Richard Herr (ed.),The New Portugal: Democracy and Europe(Berkeley, 1993), 126–148; Reis,O atraso económico português (1850–1930)(Lisbon, 1993); Pedro Lains, “Growth in a Protected Environ-ment: Portugal, 1850–1950,”Research in Economic History,XXIV (2007), 121–163. 10 Alegria,A Organização dos Transportes,214; RENFE (Red Nacional de los Ferrocarriles Españoles),Los ferrocarriles y el desarrollo económico de Europa occidental durante el siglo XIX (Ma-drid, 1981).
ther connections and the network to extend into areas hitherto without access to trains.12
The realization of these goals was not immediate, however. The late 1860s and the ªrst half of the 1870s saw new political up-heavals and economic hardships. Until 1878, the only new devel-opment was the growth of the network toward the extreme northwest (the Minho line), thus covering the entire region of the Atlantic North. The great period of construction, which occurred between 1878 and 1890, marked the arrival of the railway to the Inland North, to the extreme South, and to the coastal area north of Lisbon (a major supplier for the capital), as well as the opening of four international connections.
The network, which had grown to 3,423 km during the 1930s, was to be completed with the opening of regional lines, some of which are of considerable signiªcance: The Beira Baixa line opened from 1891 to 1893, linking the Mediterranean South to the Inland North; the branch to the northeast became opera-tional from the early twentieth century; the branch connecting the network south of the Tagus to the north of that river was con-cluded in 1904; and by 1906, trains reached the extreme southeast coast of the Mediterranean South.
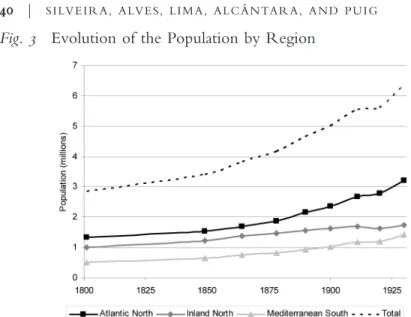
population The censuses of 1801 and 1849 show, not surpris-ingly, that the Portuguese population grew slowly (0.36 percent per year). From 1849 to 1911, the compound annual growth rate (cagr) more than doubled (0.79 percent), as economic perfor-mance improved and efforts to modernize the country produced some results. Between 1911 and 1920, the population almost stag-nated, mainly because of high rates of emigration, the effects of World War I, and the inºuenza epidemic of 1918; thereafter, its growth resumed, values reaching more than 1 percent per year. This population-growth pattern is a result of a late demographic transition and is similar to that of other southern European coun-tries (see Figure 3).13
12 Antonio Gómez Mendoza, “La modernisation des transports dans la Péninsule Ibérique au XIXe siècle,”Histoire, Économie et Société,XI (1992), 145–156; Juanjo Olaizola Elorid, “Los orígenes de las comunicaciones ferroviarias hispano-portuguesas,” Revista de Historia Ferroviaria,IX (2008), 5–64.
Bel-As shown in Figure 3, until 1864, the three Portuguese re-gions had a parallel development, but from that point forward, the Inland North was unable to follow the expansion of population in the Atlantic North and in the South. As a result, in 1930, the pop-ulations of the South and the Inland North were about equal.
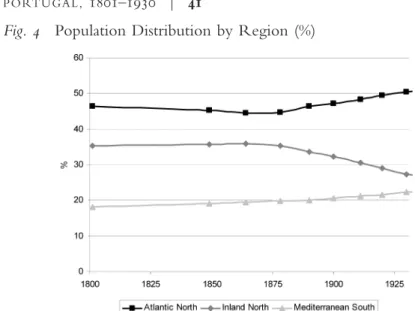
That the percentage of the total Portuguese population living in the Inland North, clearly visible in Figure 4, steadily declined is signiªcant. However, this trend is not unique; a similar trend was underway in the hinterland of the rest of the Iberian Peninsula. Another key feature apparent in Figure 4 is the large share of the population (46 percent) concentrated in the Atlantic North in the early nineteenth century. After a slight decrease by 1864, this area continued to gain momentum, surpassing 50 percent of the total population in 1930. The South also had a positive long-term evo-lution.14
gium (1.2%), the Netherlands (1.5%), and Britain (1.6%). Neil Tranter,Population since the In-dustrial Revolution: The Case of England and Wales(London, 1973), 43; Massimo Livi Bacci,
The Population of Europe: A History(New York, 2000), 132; David Reher, “The Demographic Transition Revisited as a Global Process,”Population, Space and Place,X (2004), 22, 35, 37; Teresa Rodrigues Veiga,A população portuguesa no século XIX(Oporto, 2004), 20–22; idem,
“A transição demográªca,” in Pedro Lains and Ferreira da Silva (eds.),História Económica de Portugal(Lisbon, 2005), III, 37–63.
14 The tendency to reinforce the coastal region to the detriment of the interior is best un-derstood in the context of the Iberian Peninsula as a whole. At the time, Spain was
The development described above is reºected in the variation of population density in the different regions, as shown in Figure 5 (maps published for the ªrst time). In 1801, the population density of the Atlantic North contrasted with that of both the Inland North and the South, where rates were exceedingly low. Ninety years later, the increase in density of the Atlantic North and of the South is clearly visible, especially in the coastal area of the extreme south (Algarve). Both regions reinforced this growth trend in 1930, unlike the Inland North, where the situation seems not to have changed signiªcantly.
urbanization The rate of European urbanization (excluding Russia) changed drastically from 19 percent in 1850 to 48 percent in 1930. In the case of Portugal, following the criteria adopted herein, the increase in the rate of urbanization was more modest, registering lower values—around 13 percent in 1864 and 24 per-cent in 1930, which was half of the value reported by Bairoch for
ing a similar process, which had already begun in the mid-nineteenth century. Juan Pons Izquierdo, Dolores López, and Carolina Montoro Gurich, “Del interior a la costa: dinámica espacial de la población española a lo largo del siglo XX,” inVII Congresso de la Asociación de Demografía Histórica(Granada, 2004), 8. Similar tendencies are evident in France and Ireland. Jordi Martí-Henneberg, “Empirical Evidence of Regional Population Concentration in Eu-rope, 1870–2000,”Population, Space and Place,XI (2005), 272–273.
the whole of Europe in 1930. These rates are a clear sign of the overall limitations of the country’s economic and social modern-ization.15
Urbanization in Portugal was generally slow and gradual; the two periods of greater acceleration were insufªcient to compen-sate for its structural weakness. The ªrst of these moments resulted
15 Paul Bairoch,Cities and Economic Development: From the Dawn of History to the Present
(Chicago, 1988), 216. By comparison with Spain, this limitation in urban growth was
from the territorial expansion of theconcelho(municipality) of Lis-bon during the mid-1880s, when its area increased roughly seven-fold. This alteration led to an increase in the proportion of the total urban population in the capital from 36.9 percent to 39.1 percent. The second moment was a rise of more than 3 per-cent between 1911 and 1920 due to the appearance of seventeen new urban centers. Curiously, this apparent vitality in Portuguese urbanization occurred at precisely the time when the rate of popu-lation growth was slowing down (see Table 2).16
The low level of urbanization in Portugal is also illustrated by its number of small centers (less than 10,000 inhabitants). These centers continually declined in their share of the population, how-ever; in 1900, they had 20.4 percent of the total, whereas the me-dium-sized areas (between 10,000 and 40,000 inhabitants) had risen to 21.1 percent. Lisbon and Oporto, situated in the Atlantic North region, had a huge preponderance of people, together be-tween 54 percent and 60 percent of the country’s total (during this period, the population of Lisbon was more than double that of
niªcant. In 1860, 22.5% of Spain’s population resided in urban agglomerations of more than 5,000 inhabitants; by 1930, the ªgure raised to 37%. David Reher, “Ciudades, procesos de urbanización y sistemas urbanos en la Península Ibérica, 1550–1991,” in Manuel Guardia, Francisco Monclús, and José Luis Oyón (eds.),Atlas Histórico de Ciudades Europeas(Barcelona, 1994), I, 25. See also Gabriel Tortella, El Desarrollo de la Espana Contempordnea: Historia Economica de los Siglos XIX y XX(Madrid, 2006), 37.
16 Ana Bela Nunes,A rede urbana portuguesa e o moderno crescimento económico(Lisbon, 1989); Pedro Telhado Pereira and Mata,Urban Dominance and Labour Market Differentiation of a Euro-pean Capital City: Lisbon 1890–1990(London, 1996); Ferreira da Silva, “A evolução da rede urbana portuguesa (1801–1940),”Análise Social,XXXII (1997), 779–814; Nuno Pires Soares,
O sistema urbano português, 1890–1991(Lisbon, 1998).
Table 2 Evolution of Urban Population
portugal urban centers
censuses population population %
Oporto, the second largest city). This rise of medium-sized centers is notable both in the Atlantic North and in the Mediterranean South; in this latter region, it had its greatest surge at the turn of the twentieth century.
Throughout the period under study, the Atlantic North, which was already the most urbanized region, enjoyed a higher rate of urbanization than any other region, by far. The rate in the South was also high and rising but not so that of the Inland North, which is noteworthy for its urban lethargy throughout the period (see Table 3). Not only did it have few urban centers (seven); al-most all of them were small (less than10,000 inhabitants). The ex-ception was the city of Covilhã, which joined the medium-sized ranks in 1878.
population and railways Not until 1911, ªfty-ªve years after the opening of the ªrst railway line, did coverage reach half of the population (51 percent). In 1930, it had risen to only 56 percent. Given the construction policy and the population distribution ready analyzed, it is hardly surprising that the Atlantic North al-ways had the highest percentage of people being served by the railway, in contrast to the Inland North, where railway penetra-tion was always the weakest. Periods of signiªcant increase in ac-cessibility can be identiªed for each region (see Table 4). In the Atlantic North, the rise occurred between the 1860s and 1870s, and in the South, only during the early years of the twentieth cen-tury. In the Inland North, the spread of railways was gradual after 1890; even at the end of the period under study, trains never di-rectly served more than one-third of the population.
The effect of railway accessibility on the population growth of the country as a whole is reºected in the fact that parishes with access grew faster than those without it. Moreover, the difference Table 3 Urban Population by Region (%)
region 1864 1878 1890 1900 1911 1920 1930
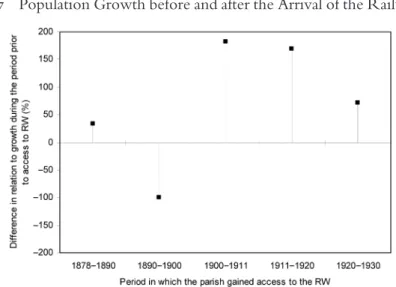
between the two groups increased over time, as can be seen in Figure 6. The positive impact of the railway is also visible through a comparison of the cagr of the population immediately before and after access; cagrwas always greater following the arrival of the railway (see Figure 7). The one exception occurred between 1890 and 1900, which can be explained by the negative conse-quences of the Beira Baixa line, the only one built during these years, for the Inland North region (see below).
The observations above are consistent with the Spearman’s Table 4 Spread of Railways into the Population by Region (%)
region railway 1864 1878 1890 1900 1911 1920 1930
North Atlantic Without 70.8 53.7 38.1 36.9 31.0 30.0 28.0 With 29.2 46.3 61.9 63.1 69.0 70.0 72.0 Total 100 100 100 100 100 100 100 Mediterranean South Without 88.3 85.3 77.5 71.3 57.2 55.4 51.7
With 11.7 14.7 22.5 28.7 42.8 44.6 48.3 Total 100 100 100 100 100 100 100 Inland North Without 100.0 98.9 80.5 77.8 72.0 69.6 67.5
With 0.0 1.1 19.5 22.2 28.0 30.4 32.5 Total 100 100 100 100 100 100 100
Rank Correlation Coefªcient calculated between the period of the arrival of the railway and thecagrof the population of a given parish from 1864 to 1930. The value obtained (⫺0.217) is
statisti-cally signiªcant; population growth tended to be greater the ear-lier that the railway became accessible. An equally signiªcant cor-relation, though less intense (⫺0.118), was found for the Atlantic North, though not true for the other regions, reinforcing the idea that the arrival of trains did not have the same impact everywhere, as is suggested by Figure 7 and Table 4.17
The routes of the railway network are intimately linked to the geography of the urban centers (see Figure 8). Indeed, the railway sought to connect the thirty centers that already existed while fa-voring the emergence of twenty new centers in areas that already formed part of the network. Only ten localities that did not have access to trains rose to the category of urban area during the period under study.18
17 The results obtained are similar to those indicated by Gregory and Martí-Henneberg, “The Railways, Urbanisation, and Local Demography in England & Wales, 1825–1911,” So-cial Science History,XXXIV (2010), 199–228. The possibility of applying this methodology to the Portuguese data, making the results comparable with the British case, arose in the context of the aforementioned project, “The Development of European Waterways, Road and Rail Infrastructures.”
18 Mendoza, “La modernisation des transports,” 145–156; João Silva,Os Transportes e o Espaço Urbano(Lisbon, 1998); Pinheiro, “Portuguese Cities and Railways in the Nineteenth and Twentieth Century,” in Ralf Roth and Marie-Noëlle Polino (eds.),The City and the Rail-way in Europe(Aldershot, 2003), 105–118; Mata, “As Bees Attracted to Honey,” 173–192.
network of this region after the arrival of the railway. The only ex-ception was Guarda, a district capital that did not become an urban center until 1920 in spite of being on the Beira Alta line from 1882 and serving as the terminal for the Beira Baixa line from 1892. Furthermore, the railway did not add to the growth of the urban areas already in existence.
Urban centers without access to railways between 1864 and 1911 grew at a signiªcantly slower pace than those with access. This tendency seems to have reversed in the period that followed, probably because of the conclusion of the main lines in 1911. The railway’s inºuence on the growth of urban centers seems to have unfolded in two distinct phases—a short-term one, in which the arrival of trains reinforced population growth, and a long-term one, in which the positive effect of the railway’s presence de-clined, apparently no longer a sufªcient condition in itself to sus-tain urban development.19
The relationship between the railway and population also in-volves internal migration. The number of people recorded in each parish who were born outside the concelho to which the parish belonged (an indicator of the migrant population) varied between roughly 510,000 in 1890 and 844,000 in 1930, the period for which these data are available. This number was always higher than the number of inhabitants in the country’s capital, represent-ing, on average, 13.7 percent of the country’s total population, in-dicating the existence of a relatively important mobility similar to that observed in Spain.20
The greater part of this population—on average, 67 percent throughout the period studied—was registered in the Atlantic North; 20 percent was in the South zone; and the rest were in the
19 The same hypothesis had already been proposed in a study on urban growth in the United States for the latter part of the nineteenth century by Robert Higgs, “The Growth of Cities in a Midwestern Region, 1870–1900,”Journal of Regional Science,IX (1969), 369–375. Gregory and Martí-Henneberg seem to be drawing the same conclusion for England and Wales, especially for the large urban centers in “Railways, Urbanisation, and Local Demogra-phy.”
Inland North, the least attractive region from this point of view. A little more than half of the migrant population (55 percent) lived in the cities across the country; the urban centers of the Atlantic North region were able to attract the largest share of them (85 per-cent). Studies reveal that Lisbon tended to lose population through migration during the ªrst half of the century, but that this trend had reversed by 1864. Thus, the data seem to indicate that Portugal was in tune with the rest of Europe, where migration was an important factor in the growth of cities.21
The railway may have favored the general population swing described above. Parishes with access to railways usually had a per-centage of migrant population that was higher than that of the par-ishes without access and consistently above the overall mean (see Figure 9). This pattern is evident in both the Atlantic North and the South, but the inºuence of railway access in the Inland North was signiªcantly less. The differences related to migration between urban areas with and without access are the highest that can be ob-served, although they tended to decrease with time (see Fig-ure 10).
21 Rodrigues, Nascer e morrer na Lisboa oitocentista: Migrações, mortalidade e desenvolvimento
(Lisbon, 1995), 137–143; Leslie Moch,Moving Europeans: Migration in Western Europe since 1650
(Bloomington, 2003), 126–131; Silvestre Rodríguez, “Temporary Internal Migrations in Spain, 1860–1930,”Social Science History,XXXI (2007), 540.
Analysis of the correlation between migration and population growth reveals statistical signiªcance for the parishes with and without access to trains. However, the coefªcient calculated through Pearson’s method for each decade points to a greater in-tensity for those with access, especially during the period from 1890 to 1911, for which the corresponding values vary between 0.331 and 0.242. In the coastal region, the correlation is generally closer, reaching a value of 0.434 in 1890 (signiªcance ⫽ 0.000; N ⫽ 706) (see Table 5).
the population growth rate observed in this region. Covilhã is an example of a place where the availability of the railway did not stimulate urban development.
Indeed, railway accessibility, population and urban growth do not always go hand in hand. Covilhã, although located in a rela-tively isolated region, was an important center for the woolen in-dustry. Contrary to tendencies observed across the country, the demographical boom cycle there (from 1864 to 1890) was fol-lowed by a dramatic break, from a cagr of 4 percent to one of 1.2 percent, which occurred simultaneously with the arrival of the railway (1891). Prior to the census of 1890, the highest growth rates were observed in urban parishes and in rural ones that were to have access to a railway station in the following decade. By contrast, after 1890, the growth trend of the urban areas was re-versed; at the same time, the rural parishes served by trains began to grow more slowly than those without access to a railway station.
The second half of the nineteenth century was a period of rapid economic growth in Europe. Following the loss of Brazil, its prin-cipal colony, Portugal sought to establish the bases for the mod-ernization of its economy, largely via the building of railways, which represented a huge ªnancial effort.
The relationship between railways and population dynamics has heretofore seen little study. This article shows that railway ac-Table 5 Correlation between Migration and Population Growth
correlation signifiicance n
cess helped to increase population concentration in the areas served by this infrastructure; railways favored the growth of pre-existing urban centers and the emergence of new ones. They also encouraged migration into towns, thus contributing to their de-velopment, even though the proportion of Portugal’s urban popu-lation in the 1930s was far from outstanding by European stan-dards.
As contemporary critics of Portugal’s economic policy during the second half of the nineteenth century afªrmed, railways came to beneªt the prosperous regions and might have exacerbated the conditions unfavorable to development in areas with greater struc-tural weaknesses. Recent historiography, in studying the spatial redistribution of industry, points to the validity of this idea, which this article reinforces, in relation to the evolution of Portugal’s population and its urban centers.