Biodiversity: Expanding Taxonomic and Geographic
Coverage
Lee A. Weigt1*, Carole C. Baldwin2, Amy Driskell1, David G. Smith2, Andrea Ormos1, Eric A. Reyier3
1Laboratories of Analytical Biology, National Museum of Natural History, Smithsonian Institution, Washington, D.C., United States of America,2Department of Vertebrate Zoology, National Museum of Natural History, Smithsonian Institution, Washington, D.C., United States of America,3Kennedy Space Center Ecological Program, IHA Environmental Services, Kennedy Space Center, Florida, United States of America
Abstract
This paper represents a DNA barcode data release for 3,400 specimens representing 521 species of fishes from 6 areas across the Caribbean and western central Atlantic regions (FAO Region 31). Merged with our prior published data, the combined efforts result in 3,964 specimens representing 572 species of marine fishes and constitute one of the most comprehensive DNA barcoding ‘‘coverages’’ for a region reported to date. The barcode data are providing new insights into Caribbean shorefish diversity, allowing for more and more accurate DNA-based identifications of larvae, juveniles, and unknown specimens. Examples are given correcting previous work that was erroneous due to database incompleteness.
Citation:Weigt LA, Baldwin CC, Driskell A, Smith DG, Ormos A, et al. (2012) Using DNA Barcoding to Assess Caribbean Reef Fish Biodiversity: Expanding Taxonomic and Geographic Coverage. PLoS ONE 7(7): e41059. doi:10.1371/journal.pone.0041059
Editor:Robert DeSalle, American Museum of Natural History, United States of America
ReceivedApril 2, 2012;AcceptedJune 16, 2012;PublishedJuly 17, 2012
This is an open-access article, free of all copyright, and may be freely reproduced, distributed, transmitted, modified, built upon, or otherwise used by anyone for any lawful purpose. The work is made available under the Creative Commons CC0 public domain dedication.
Funding:Funding was provided by the Smithsonian Marine Science Network and the Smithsonian DNA Barcoding Initiative at L.A.B. The funders had no role in study design, data collection and analysis, decision to publish, or preparation of the manuscript.
Competing Interests:One author works for a private company (Kennedy Space Center), but this does not alter the authors’ adherence to all the PLoS ONE policies on sharing data and materials.
* E-mail: [email protected]
Introduction
The use and acceptance of DNA barcoding for animal identification has proliferated to many life science disciplines and other areas of human concern. Critical to the utility of the methods is the ability to put into context the DNA barcoding results, which are dependent on a database of all the possible sequence matches. In relatively simple studies [1] where there are relatively few potential targets (all terrestrial vertebrates in a region) a correct identification of unknowns is likely due to the relative ease of obtaining sequences of all possible matches. In complex systems (all the invertebrates in the ocean, all insects in a tropical terrestrial system), the absolute numbers of possible ‘‘answers’’ for the DNA barcode of an unknown specimen increases greatly, but the probability of making an identification decreases to a great degree because of the vast size of the database of all possible matches. This fact only increases the challenges to the portion of DNA barcoding that is the effort to build the reference library against which to query samples. For example, if there are four possible answers in a simple case, and the database contains two of them, then you have a 50% chance of a positive ‘‘hit’’ or match to the database. However, as the two other species are lacking, there is no confirmation that the barcodes from these two taxa are different from the barcodes of the two taxa present in the database. The same is true if there are 1,000 or 10,000 species in the system or area of exploration, and only half are present in the reference library. The complexity of data interpretation increases further when geographic sampling and any potential individual or population variation are taken into account.
increases identification success and sheds new light on species diversity in the Caribbean.
Materials and Methods
Table 1 lists major collection efforts over six years in the countries by BOLD project name, country, number of samples successfully barcoded and reported here. Each trip represents many collection events. Additional samples from these collection efforts have been previously reported [10–14,17].
Fish specimens were collected with anesthetics, ichthyocides, cast nets, seines, benthic trawls, and pole spears, and a few were purchased from local fishermen. Upon collection and morpholog-ical sorting, fish were identified to the extent possible in the field, photographed (in the field whenever possible for best living color representation), and biopsied for tissues for subsequent molecular work. Many DNA extraction and PCR/DNA sequencing protocols have been published specific to special cases of preservation or tissues [27–33], but our methods across this project have not required special consideration other than generating high-quality DNA extractions for archival purposes [34–37]. Voucher specimens were preserved for permanent archival in the Smithsonian’s marine collections. Tissues and archival organic DNA extractions are submitted for permanent archival to the Smithsonian/NMNH Biorepository. Calculations of project statistics were done using the BOLD project workbench (www.boldsystems.org), the BOLI data portal tools (boli.uvm.edu), and the species delimitation plug-in for the Geneious software package [38]. Strictly for visualization purposes, neighbor-joining trees [39] were constructed using Kimura 2-parameter distances [40] utilizing BOLD, Paup* [41], and FigTree [42].
Results
All data are publicly available in BOLD public projects (listed in Table 1;www.boldsystems.org) and in GenBank (Accession
numbers: JQ839691–JQ840387; JQ840390–JQ840744;
JQ840747–JQ841039; JQ841042–JQ843096). Previously pub-lished projects now public on BOLD {APG (Apogon), BATHY (Bathygobius), CORY (Coryphopterus), PHAE (Phaeoptyxand Astrapo-gon), RYP (Rypticus), and STARK (Starksia)} are also comprised of
Table 1.Collection efforts (by BOLD project) resulting in specimens reported here.
BOLD Project Country-State Year Samples reported
BAHA Bahamas 2008 229
BZLWA Belize 2004 476
BZLWB Belize 2005 366
BZLWC Belize 2006 293
BZLWD Belize 2007 387
BZLWE Belize 2008 415
CURA Curac¸ao 2008 369
FCCA USA-Florida 2009 139
SMSA USA-Florida 2007 407
TOBA Tobago 2009 343
doi:10.1371/journal.pone.0041059.t001
specimens collected as part of this project but that were subjected to taxonomic evaluation prior to this evaluation. The data from those projects have been included in the statistical analyses (intraspecific and interspecific calculations) for the purposes of this report.
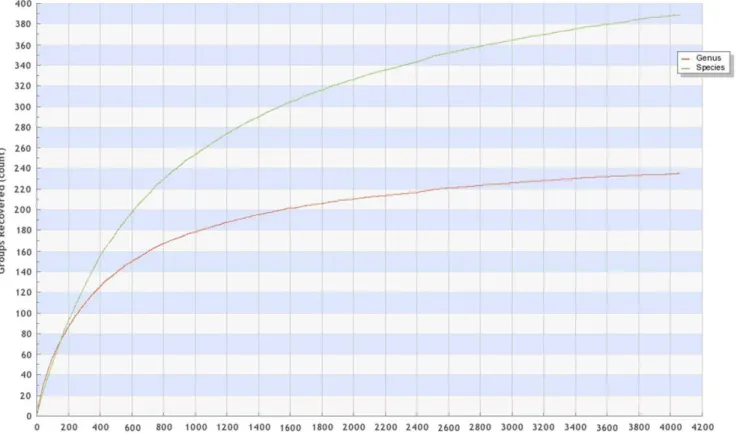
The accumulation curve (output from BOLD) of species, genera and ‘‘barcode clusters’’ is shown in Figure 1, and only includes specimens named to the species or genus level. For ease of re-evaluation and visualization, the nexus file of all specimens is provided in Table S1. Floeter et al. [43] provided a useful, though not comprehensive, metric utilizing 20 speciose families in the region [44,45] that include 158 genera. Table 2 shows our data converging towards comprehensive generic coverage for those families. Our groups collecting efforts here provide an additional 16 genera from the region not previously reported (Alectis, Arcos, Bathyanthias, Bollmannia, Bullisichthys, Coralliozetus, Decodon, Diplectrum, Gonioplectrus, Hemanthias, Hypsoblennius, Jeboehlkia, Pagrus, Pristipo-moides, Pronotogrammus, Seriola), and BOLD has specimens from an additional 15 genera (Anthias, Chaenopsis, Chriolepis, Dermatolepis, Ekemblemaria, Etelis, Gobulus, Hemicaranx, Hemiemblemaria, Nicholsina, Pycnomma, Schultzea, Serraniculus, Stenotomus, Xanthichthys). Genera currently lacking from these speciose families will then be subsequently reduced to: Amphichthys, Anarchias, Anarchopterus, Channomuraena, Dactylagnus, Derilissus, Evermannichthys, Halicampus, Leurochilus, Myxodagnus, Muraena, Nemaclinus, Palatogobius, Paralabrax, Parasphyraenops, Parella, Pariah, Plectranthias, Protemblemaria, and Vomerogobius.
Discussion
Our team places a strong emphasis on resolving taxonomic issues resulting from DNA barcoding both to improve our understanding of Caribbean shorefish diversity and increase our ability to successfully identify larvae. Extensive taxonomic and specimen review has resulted in several publications prior to this release of shallow water Caribbean fish data [10–14,17]. Combined with the data released here, DNA barcode data for more than half of the 1023 species in the Western Atlantic are now available [43]. Occasionally, issues arise because DNA barcoding indicates the potential presence of more lineages in a geographic location than are currently recognized [10] and nine new species have already been described [10,12], in addition to numerous others awaiting description. Rather than further delaying the release of the data presented herein pending additional revisions and species descriptions, we withhold species names of certain specimens (513 specimens or 15% of the total). Genera that fall into this category include: Acanthemblemaria, Acyrtops, Acyrtus, Elacatinus,Enneanectes,Gobiesox,Lythrypnus, Malacoctenus,Odontoscion, Pareques, Petrotyx, Platygillellus, Priolepis,Risor, andSynodus. Remain-ing specimens without associated species names are due to difficulties identifying specimens confidently to species. There are two distinct issues limiting species-level identification: 1) barcoding (of early life history stages in particular; 683 specimens in this data set, 20% of total) suggests that the adult form has not yet been collected and identified; and 2) specimens in-hand cannot yet be unambiguously assigned to a single species because of extreme morphological similarities (315 specimens, 9.3% of total). Rather than introducing more confusion by potentially incorrectly applying species names, we have chosen to leave the identifications at family or genus and allow for subsequent further investigation by us or other taxonomic experts. We continue to strive for data release earlier rather than later and therefore publish the data with the specimens identified only to the level to which there is currently high confidence. This has the added advantage of not resulting in matches to sequences in the database that are misidentified, which can cause confusion. One of the strengths of the BARCODE ‘‘flag’’ in GenBank is the confidence that much effort has been placed on not perpetuating incorrect information, much confidence can be placed on the identification of the specimen that was sequenced, and should a question arise in terms of identification, the location of the voucher specimen in an accessible collection has been documented.
Ward et al. [8] found the average interspecific variation in 207 species of Australian fishes to be 9.93%, and Hubert et al. [9] found an average 8.30% interspecific distance for 193 species of Canadian freshwater fishes. For animal species in general, Kartavtsev [46,47] reported an average intergeneric distance of 16.6%. Our data (all in BOLD and calculated using BOLD analytical tools) show and average interspecific (intra-generic) distance of 16.3% (+0.026%). Calculations of averages distances to the ‘‘nearest-neighbor’’, instead of just inter-specific distances, average 11.95% (+0.02%). If taxa not identified to the species level are removed, then interspecific and nearest neighbor distances average 16.11% (+0.026) and 12.08% (+0.02) respectively.
Earlier efforts [48,49] to identify Caribbean fish larvae without the aid of DNA were only marginally successful. Larvae have led to discoveries and descriptions of new species of fish including confirmed with molecular data [50], though not always with the COI barcode region. Through the use of DNA barcode data, we have realized an increase in the number of larval fishes identified to species from about 50 in 2004 to over 168 currently. Resolution of taxonomic issues highlighted by barcode data (e.g., [17]) also
Table 2.Coverage reported here of the speciose fish families listed by Floeter et al. [42] for the Western Atlantic (WA).
Family
WA genera
genera herein
% generic coverage
Apogonidae 3 3 100%
Balistidae 4 3 75%
Batrachoididae 5 4 80%
Blenniidae 7 6 86%
Carangidae 10 8 80%
Chaenopsidae 10 5 50%
Dactyloscopidae 6 3 50%
Gobiesocidae 6 4 67%
Gobiidae 25 18 72%
Haemulidae 3 3 100%
Labridae 8 7 88%
Labrisomidae 5 4 80%
Lutjanidae 6 4 67%
Muraenidae 8 5 63%
Pomacentridae 4 4 100%
Scaridae 4 3 75%
Serranidae 27 11 41%
Sparidae 6 4 67%
Syngnathidae 9 7 78%
Tripterygidae 1 1 100%
Total genera 158 107 68%
has allowed identification of larvae that were previously misiden-tified due to poorly resolved species classifications. By increasing the coverage of species and numbers of individuals through broader and repeated sampling, greater accuracy of identification of unknowns has now been enabled.
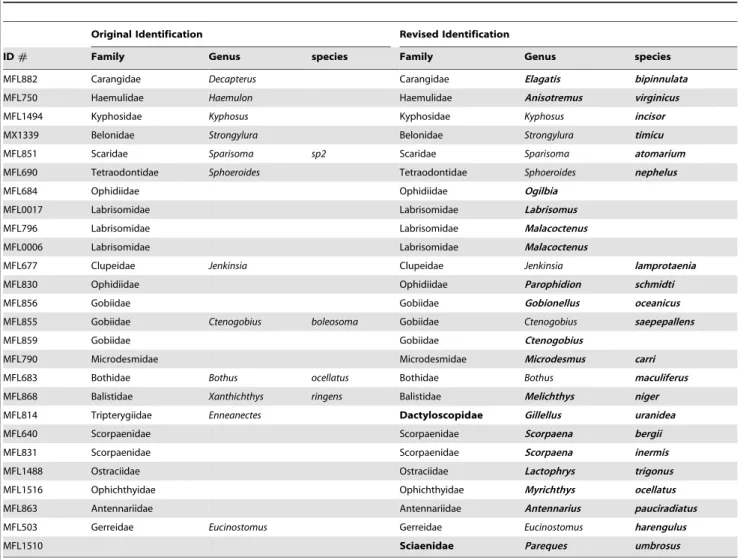
Valdez-Moreno et al. [24,25] also studied fish in the western Caribbean testing some adults, but a majority of samples were larvae and eggs that they attempted to identify by matching the barcode sequences to known BOLD records. Their sampling included 181 species, 136 genera and 74 families. Of their 782 larval and egg specimens, 137 failed to match any records and 75 barcode lineages failed to have a close correspondence with existing records. By increasing taxonomic and geographic coverage, we have shed more light on these identifications and have found several incorrect identifications, as well as some taxonomic issues. Table 3 lists the corrected identifications of some of the larval records reported [24,25].
Combining the barcoding data from Mexico [24,25] with ours proved informative in other ways as well. Three interesting cases arise which merit further discussion and are shown in a dendrogram for visualization purposes only in Figure 2, with no intent to show phylogenetic relationships. The first case (A in Figure 2) is of taxa that are similar enough to fall in the range of
differentiation that can be due to either closely related species or genetically more divergent populations of the same species. This occurs in the flatfish genus Bothus, and the samples from the Mexican studies [24,25] ‘‘MFL’’ in Fig. 2) are identified as conspecifics, fall into two groups and have Kimura 2-parameter genetic distances averaging 1.30% (range = 0.00–2.55%). All of these MFL and MX samples are larvae. This would be within the expected range of intraspecific variation for species maintaining a broad geographic range, but elevated for specimens collected in close proximity [8,51]. Do these specimens represent the high end of the range of intraspecific variation, or the low end of the range of interspecific variation? Without full taxonomic coverage, it can be difficult to determine, as both are realistic possibilities. However, when put into context with nearest neighbor taxa and other congeners via more comprehensive taxon sampling, the two larvae in question fall into reciprocally monophyletic groups, each with the appropriate species identification based on juveniles or adults. The resulting calculations of intraspecific divergences would be very low withBothus maculiferusat 0.12% (range 0.00%– 0.31%) andBothus ocellatusat 0.31% (range 0.00%–0.62%) and the interspecific divergences of 2.31% (range 2.04%–2.55%) showing a sizeable ‘‘barcode gap’’ over the intraspecific values.
Table 3.Mexican larvae and juveniles with improved identifications (in boldface) due to increased taxon and geographic sampling. Original data from Valdez-Moreno et al [24,25].
Original Identification Revised Identification
ID# Family Genus species Family Genus species
MFL882 Carangidae Decapterus Carangidae Elagatis bipinnulata
MFL750 Haemulidae Haemulon Haemulidae Anisotremus virginicus
MFL1494 Kyphosidae Kyphosus Kyphosidae Kyphosus incisor
MX1339 Belonidae Strongylura Belonidae Strongylura timicu
MFL851 Scaridae Sparisoma sp2 Scaridae Sparisoma atomarium
MFL690 Tetraodontidae Sphoeroides Tetraodontidae Sphoeroides nephelus
MFL684 Ophidiidae Ophidiidae Ogilbia
MFL0017 Labrisomidae Labrisomidae Labrisomus
MFL796 Labrisomidae Labrisomidae Malacoctenus
MFL0006 Labrisomidae Labrisomidae Malacoctenus
MFL677 Clupeidae Jenkinsia Clupeidae Jenkinsia lamprotaenia
MFL830 Ophidiidae Ophidiidae Parophidion schmidti
MFL856 Gobiidae Gobiidae Gobionellus oceanicus
MFL855 Gobiidae Ctenogobius boleosoma Gobiidae Ctenogobius saepepallens
MFL859 Gobiidae Gobiidae Ctenogobius
MFL790 Microdesmidae Microdesmidae Microdesmus carri
MFL683 Bothidae Bothus ocellatus Bothidae Bothus maculiferus
MFL868 Balistidae Xanthichthys ringens Balistidae Melichthys niger
MFL814 Tripterygiidae Enneanectes Dactyloscopidae Gillellus uranidea
MFL640 Scorpaenidae Scorpaenidae Scorpaena bergii
MFL831 Scorpaenidae Scorpaenidae Scorpaena inermis
MFL1488 Ostraciidae Ostraciidae Lactophrys trigonus
MFL1516 Ophichthyidae Ophichthyidae Myrichthys ocellatus
MFL863 Antennariidae Antennariidae Antennarius pauciradiatus
MFL503 Gerreidae Eucinostomus Gerreidae Eucinostomus harengulus
MFL1510 Sciaenidae Pareques umbrosus
Problems and confusion with identifications ofBothususing the BOLD database will persist until the Mexican larval specimens are renamed (not necessarily to the other species name, but merely to genus). Once these specimens are renamed in BOLD and GenBank they will not continue to perpetuate problems and misidentifications. The specimens in question should not neces-sarily be renamed solely based on their DNA matching an adult from a different taxon, but due to the fact that the specimens in question are larvae (juveniles might also apply) and the possibility or potential of incorrect identification is high, or conversely, the confidence in the species name is low, while the confidence in the genus name remains high. Removing the species name and naming themBothusin the database will eliminate these concerns, as well as correct the implied assertion that the barcoding method fails in this group, or doesn’t correctly distinguish between conspecifics, when it actually works very well.
The second case (B in Fig. 2) is part of a notoriously difficult to identify taxonomic group, the mojarras, specifically the genus Eucinostomus, which presents different problems in fresh versus preserved specimens. We have enlisted the assistance of a taxonomic expert to help us resolve this group, and will enlarge upon this study in the future. Specimens ofEucinostomus gulafrom the Atlantic coast of Florida and Mexico form the bottom group (clear triangle), whereas specimens from nearby Belize, Tobago and Curac¸ao form the other group (black triangle). But both groups also include specimens from Mexico. Were the Mexico specimens not present in both groups, we might not know if the observed level of sequence divergence indicated species level differences or geographic isolation patterns, but the occurrence in Mexico of specimens from both groups indicates significant isolation of gene flow between the two groups of mojarras.
The third case (C in Fig. 2) is another difficult to resolve scenario – this time in the sciaenid genusBairdiella. Two closely related and difficult to identify taxa occur across the entire western Central Atlantic, Bairdiella ronchusand B. chrysoura[51]. The two taxa are have distinct geographic distributions: all Yucatan specimens (MX) are identified as B. ronchus, which is distributed throughout the Caribbean; while our Florida specimens (FCC and SMS) are identified as B. chrysoura, which has a more northern distribution including the east coast of the U.S. and northern Gulf of Mexico. Our Florida specimens (juveniles size range 17– 36 mm; adults 85–130 mm) are from an area (east coast of Florida) only known to host one of the two taxa as adults and these key out to the lone species reported from the region, Bairdiella chrysoura. The larval specimens from Mexico are identified as two different species [24,25,51] but the two types appear to not show any differentiation. Adults of Bairdiella ronchus might shed some
light on this dilemma, but until such specimens are acquired, it is apparent that we have some difficulty identifying larvalBairdiella, and it would be prudent to remove the species-level designations from larvae of this group. If the removal of the species-level designations for those larval specimens were to happen, there would be no internal conflict in the data for this genus. So frequently have these misrepresentations appeared in our datasets and those of others [52] that our group now takes a very conservative approach to placing names on specimens that cannot be reliably keyed out. This has the adverse effect of increasing the number of specimens identified only to genus (44.44% of specimens in this data release), but ultimately makes for a more robust overall database.
While improvements in identifications, corrections of misiden-tifications, and illumination of additional taxonomic issues that need resolution are not unexpected, it is still valuable to witness and document the increasing confidence in interpretation of results as we grow our datasets to levels of completion that will be of value to ecologists, taxonomists, and the scientific consumers of our biodiversity data worldwide.
Supporting Information
Table S1 Aligned fasta-format file of all specimens. ‘‘Missing’’
sequence data from beginning and end of any sequences has been filled with ‘‘N’s’’ to avoid generating any alignment discrepancies. Title line for each specimen indicates Field Identification number and taxonomic identification.
(TXT)
Acknowledgments
W. Lee, J. Bagley, M. Carpenter, Z. Foltz, B. Holt, J. Lang, L. Lang, B. Langton, and J. Mounts provided field assistance. Research in Florida was conducted pursuant to SAL # 09SR–1024SR to CCB. A. Gazit, K. Wilson, and M. Kunen facilitated collecting in Curacao through the CARMABI laboratory. Fieldwork in the Bahamas was conducted under the auspices of the Perry Institute of Marine Science, with logistical assistance from B. Gadd, E. Lamarre, and D. O’Donnell. R. Langton, J. Gobin, and K. Caesar facilitated collecting in Tobago. Mike Trizna provided data assistance.
Author Contributions
Conceived and designed the experiments: LAW CCB AD. Performed the experiments: LAW CCB AD DGS AO EAR. Analyzed the data: LAW CCB AD. Contributed reagents/materials/analysis tools: LAW CCB AD EAR. Wrote the paper: LAW CCB AD. Participated in field acquisition of specimens: LAW CCB AD DGS EAR.
References
1. Smith KM, Anthony SJ, Switzer WM, Epstein JH, Seimon T, et al. (2012) Zoonotic Viruses Associated with Illegally Imported Wildlife Products. PLoS ONE 7(1): e29505. doi:10.1371/journal.pone.0029505.
2. Aquilino SV, Tango JM, Fontanilla IKC, Pagulayan RC, Basiao ZU, et al. (2011) DNA Barcoding the ichthyofauna of Taal Lake, Philippines. Molecular Ecology Resources 11: 612–619.
3. Ardura A, Linde AR, Moreira JC, Garcia-Vasquez E (2010) DNA barcoding for conservation and management of Amazonian commercial fish. Biological Conservation 143: 1438–1443.
4. Asgharian H, Sahafi HH, Ardalan AA, Shekarriz S, Elahi E (2011) Cytochrome c oxidase subunit 1 barcode data of fish of the Nayband National Park in the Persian Gulf and analysis using meta-data flag several cryptic species. Molecular Ecology Resources 11: 461–472.
5. Cawthorn D-M, HA Steinman and RC Witthuhn (2011) Establishment of a mitochondrial DNA sequence database for the identification of fish species commercially available in South Africa. Molecular Ecology Resources 11: 979– 991.
Figure 2. Dendrogram including three instances of specimen and taxonomic confusion discussed in the text.Combined barcoding
data from Mexico (MFL- and MX- prefixes) [24,25] with our data (BLZ = Belize; CUR = Curacao; FCC = Florida; FL = Florida; SMS = Florida) and shown in a dendrogram for visualization purposes only, with no intent to show phylogenetic relationships. The triangles are to scale showing the maximum amount of genetic variation within the clade, which ranges from the straight line (no differences between individuals) of the bottom clade (Bairdiella chrysoura) to the largest intraspecific variation in the Eucinostomus gula clade (B-white triangle: largest pairwise genetic distance = 0.0894) Interspecific and inter-clade distances and significance is discussed in the text.
6. Lakra WS, MS Verma, M Goswami, KK Lal, V Mohindra, et al. (2011) DNA Barcoding Indian Marine Fishes. Molecular Ecology Resources 11: 60–71. 7. Mecklenburg CW, Moller PR, Steinke D (2011) Biodiversity of arctic marine
fishes: Taxonomy and zoogeography. Marine Biodiversity 41: 109–140. 8. Ward RD, Zemlak TS, Innes BH, Last PR, Hebert PDN (2005) DNA barcoding
Australia’s fish species. Phil Trans Royal Soc B Biol Sci 360: 1847–1857. 9. Hubert N, Hanner R, Holm E, Mandrak NE, Taylor E, et al. (2008) Identifying
Canadian freshwater fishes through DNA barcodes. PLoS One. 3(6): e2490. 10. Baldwin CC, Weigt LA (2012) A new species of soapfish (Teleostei: Serranidae:
Rypticus), with redescription ofR. subbifrenatusand comments on the use of DNA barcoding in systematic studies. Copeia 2012(1): 23–36.
11. Baldwin CC, Mounts JH, Smith DG, Weigt LA (2008) Genetic identification and color descriptions of early life-history stages of Belizean Phaeoptyx and Astrapogon (Teleostei: Apogonidae) with comments on identification of adult Phaeoptyx. Zootaxa 2008: 1–22.
12. Baldwin CC, Weigt LA, Smith DG, Mounts JH (2009) Reconciling genetic lineages with species in Western AtlanticCoryphopterus (Teleostei: Gobiidae). Smithsonian Contributions to the Marine Sciences: 38: 111–138.
13. Baldwin CC, Castillo CI, Weigt LA, Victor BC (2011) Seven new species within western Atlantic Starksia atlantica, S. lepicoelia, and S. sluiteri (Teleostei: Labrisomidae), with comments on congruence of DNA barcodes and species. Zookeys 79: 21–72.
14. Baldwin CC, Brito BJ, Smith DG, Weigt LA, Escobar-Briones E (2011) Identification of early life-history stages of CaribbeanApogonspecies (Perci-formes: Apogonidae) through DNA barcoding. Zootaxa 3133: 1–36. 15. Holmes BH, Steinke D, Ward RD (2009) Identification of shark and fin rays
using DNA barcoding. Fisheries Research 95: 280–8.
16. Hubert N, Delrieu-Trottin E, Irisson J-O, Meyer C, Planes S (2010) Identifying coral reef fish larvae through DNA barcoding: A test case with the families Acanthuridae and Holocentridae. Molecular Phylogenetics and Evolution 55: 1195–1203.
17. Tornabene L, Baldwin C, Weigt LA, Pezold F (2010) Exploring the diversity of western AtlanticBathygobius(Teleostei: Gobiidae) with cytochrome c oxidase-I, with descriptions of two new species. Aqua 16(4): 141–170.
18. Wong EHK, Shivji MS, Hanner RH (2009) Identifying sharks with DNA barcodes: assessing the utility of a nucleotide diagnostic approach. Molecular Ecology Resources. 9: 243–256.
19. Wang ZD, Guo YS, Tan W, Li L, Tang EP, et al (2010) DNA barcoding, phylogenetic relationships and speciation of snappers (genusLutjanus). Science China Life Sciences 53: 1025–1030.
20. Becker S, Hanner R, Steinke D (2011) Five years of FISH-BOL: Brief status report. Mitochondrial DNA 22(S1): 3–9.
21. Ratnasingham S, Hebert P (2007) BOLD: The Barcode of Life Data System (http://www.barcodinglife.org). Molecular Ecology Notes 7: 355–364. 22. Ward RD, Hanner R, Hebert PDN (2009) The campaign to DNA barcode all
fishes, FISH-BOL. Journal of Fisheries Biology 74: 329–356.
23. Aranishi F (2006) Single fish egg DNA extraction for PCR amplification. Conservation Genetics 7: 153–156.
24. Valdez-Moreno M, Ivanova NV, Elias-Gutierrez M, Contreras-Balderas S, Hebert PDN (2009) Probing diversity in freshwater fishes from Mexico and Guatemala with DNA barcodes. Journal of Fisheries Biology 74: 377–402. 25. Valdez-Moreno M, Vasquez-Yeomans L, Elias-Gutierrez M, Ivanova NV,
Hebert PDN (2010) Using DNA barcodes to connect adults and early life stages of marine fishes from the Yucatan Peninsula, Mexico: potential in fisheries management. Marine and Freshwater Research 61: 665–6711.
26. Victor BC (2007) Coryphopterus kuna, a new goby (Perciformes: Gobiidae: Gobiinae) from the western Caribbean, with the identification of the late larval stage and an estimate of the pelagic larval duration. Zootaxa 1526: 51–61. 27. Bartlett SE, Davidson WS (1992) FINS (Forensically Informative Nucleotide
Sequencing): a procedure for identifying the animal origin of biological specimens. Biotechniques 12(3): 408–411.
28. Ivanova N, Zemlak TS, Hanner RH, Hebert PDN (2007) Universal primer cocktails for fish DNA barcoding. Molecular Ecology Notes 7: 544–548. 29. Kumar R, Singh PJ, Nagpure NS, Kushwaha B, Srivastava SK, et al. (2007) A
non-invasive technique for rapid extraction of DNA from fish scales. Indian Journal of Experimental Biology 45: 992–997.
30. Lucentini L, Caporali S, Palomba A, Lancioni H, Panara F (2006) A comparison of conservative DNA extraction methods from fins and scales of freshwater fish: A useful tool for conservation genetics. Conservation Genetics 7: 1009–1012. 31. Palero F, Hall S, Clark PF, Johnston D, Mackenzie-Dodds J, et al. (2010) DNA
extraction from formalin-fixed tissue: new light from the deep sea. Scientia Marina 74(3): 465–470.
32. Shokralla S, Singer GAC, Hajibabaei M (2010) Direct PCR amplification and sequencing of specimens’ DNA from preservative ethanol. Biotechniques 48(3): 305–306.
33. Zhang J (2010) Exploiting formalin-preserved fish specimens for resources of DNA barcoding. Molecular Ecology Resources 10: 935–941.
34. Handy SM, Deeds JR, Ivanova NV, Hebert PDN, Hanner R, et al. (2010) A single laboratory validated method for the generation of DNA Barcodes for the identification of fish for regulatory compliance. Journal of AOAC International 94: 1–10.
35. Weigt LA, Driskell A, Ormos A, Meyer C, Collins A (2011) Introduction to animal barcoding protocols. In: DNA Barcodes: Methods and Protocols Kress, WJ and DL Erickson, eds. Humana Press.In press.
36. Weigt LA, Driskell A, Ormos A (2011) DNA barcoding fishes. In: DNA Barcodes: Methods and Protocols Kress, WJ and DL Erickson, eds. Humana Press.In press.
37. Yancy HF, Fry FS, Randolph SC, Deeds J, Ivanova NV, et al. (2008) A protocol for validation of DNA-barcoding for the species identification of fish for FDA regulatory compliance. FDA Laboratory Information Bulletin. LIB No. 4420. 38. Masters BC, Fan V, Ross HA (2011) Species delimitation – a geneious plugin for
the exploration of species boundaries. Molecular Ecology Resources 11: 154– 157.
39. Saitou N, Nei M (1987) The neighbor-joining method: a new method for reconstructing phylogenetic trees. Molecular Biology and Evolution 4: 406–425. 40. Kimura M (1980) A simple method for estimating evolutionary rates of base substitutions through comparative studies of nucleotide sequences. Journal of Molecular Evolution 16: 111–120.
41. Swofford D (2002) Phylogenetic analysis using parsimony (* and other methods). Sinauer Associates, Sunderland, Massachusetts.
42. Figtree website. http://tree.bio.ed.ac.uk/software/figtree/Accessed 2012 Jun 22.
43. Floeter SR, Rocha LA, Robertson DR, Joyeux JC, Smith-Vaniz WF, et al. (2008) Atlantic reef fish biogeography and evolution. Journal of Biogeography 35: 22–47.
44. Eschmeyer WN (2010) Catalog of fishes website. http://research.calacademy. org/research/ichthyology/catalog/speciesbyfamily.asp Accessed 2012 Jun 22. 45. Eschmeyer WN, Fricke R, Fong JD, Polack DA (2010) Marine fish diversity:
history of knowledge and discovery (Pisces). Zootaxa 2525: 19–50.
46. Kartavtsev YP (2011) Sequence divergence at mitochondrial genes in animals: Applicability of DNA data in genetics of speciation and molecular phylogenetics. Marine Genomics vol. 4 (2) 71–81. http://dx.doi.org/10.1016/j.margen.2011. 02.002.
47. Kartavtsev YP (2011) Divergence atCyt-bandCo-1mtDNA genes on different taxonomic levels and genetics of speciation in animals. Mitochondrial DNA 22(3): 55–65.
48. Baldwin CC, Smith DG (2003) Larval Gobiidae (Teleostei: Perciformes) of Carrie Bow Cay, Belize, Central America.Bulletin of Marine Science, 72, 639–674. 49. Richards WJ (2006) Early stages of Atlantic fishes: an identification guide for
western central North Atlantic. CRC Press, Boca Raton, 2640 p.
50. McBride RS, Rocha CR, Ruiz-Carus R, Bowen BW (2010) A new species of ladyfish, of the genusElops(Elopiformes: Elopidae), from the western Atlantic Ocean. Zootaxa 2346: 29–41.
51. Ward RD, Holmes BH (2007) An analysis of nucleotide and amino acid variability in the barcode region of cytochrome c oxidase I (cox1) in fishes. Molecular Ecology Notes 7: 899–907.
52. Chao NL (2002) Sciaenidae, 1601–1602. In: The living marine resources of the Western Central Atlantic. Volume 3: Bony fishes part 2 (Opistognathidae to Molidae). Carpenter KE (Ed.). FAO species identification guide for fishery purposes and American Society of Ichthyologists and Herpetologists special publication no. 5. FAO, Rome. 601–1374.