Master Thesis
FGV EBAPE
Master in International Management
Green Logistics -
key elements for a well-functioning sustainable logistics
system.
Martin Nietz
Supervisor:
Profa. Monica Pinhanez
Fundação Getulio Vargas, FGV
2 Abstract
A growing awareness of the modern society about the direct relationship between a growing global community with increasing total industrial activities on one hand and various environmental problems and a natural limitation of natural resources on the other hand set the base for sustainable or “green” approaches within the supply chain. This paper therefore will look at the issue of “Green Logistics” which seeks to reduce the environmental impact of logistics activities by taking into account functions such as recycling, waste and carbon emission reduction and the use of alternative sources of energy.
In order to analyze how these approaches and ideas are being perceived by the system as a whole two models from the area of prospective and scenario planning are being used and described to identify the main drivers and tendencies within the system in order to create feasible hypothesis. Using the URCA/CHIVAS model allows us to identify the driver variables out of a high number of variables that best describe the system “Green Logistics”. Followed by the analysis of the actor’s strategies in the system with the Mactor model it is possible to reduce the complexity of a completely holistic system to a few key drivers that can be analyzed further on.
Here the implications of URCA/CHIVAS and Mactor are being used to formulate hypotheses about the perception of Green Logistics and its successful implementation among logistics decision makers by an online survey.
3
Table of Contents
Table of Contents ... 3
Table of Figures ... 5
List of Abbreviations ... 6
1. Introduction ... 8
1.1. An overview of global warming, social issues and economic data ... 9
1.2 Problem discussion... 17
1.3. Motivation ... 19
1.4. Research Purpose and goal ... 20
2. Literature Review ... 21
2.1 Sustainable and Green Logistics and Supply Chain Management ... 21
2.1.1. The 4 dimensions of Transportation ... 28
2.1.2. Examples of Industry initiatives and tools on Sustainable Logistics ... 30
2.2. Methodology: Structural analysis with URCA/Chivas ... 33
2.2.1. List of relevant variables ... 38
2.3. The MACTOR model ... 39
2.3.1. Functioning and Output of the Mactor model ... 42
2.3.2. Description of relevant actors ... 46
3. Methodology ... 55
3.1. Research Type and Research Strategy ... 55
3.2. Presentation of Driver Variables ... 55
3.3. List of objectives ... 59
3.4. Presentation of Results of the MACTOR Analysis ... 60
3.4.1. Direct and indirect influences ... 60
3.4.2. Actors Objectives Relationship ... 65
3.4.3. Convergence between actors ... 67
3.4.4. Divergence between actors ... 69
3.4.5. Actor ambivalence ... 72
3.4.6. Net distance between objectives ... 73
3.5. Interpretation of MACTOR Results ... 76
3.6. Hypotheses ... 79
4. Data Description and Analysis ... 82
4.1. Data Presentation ... 82
4.2. Data Analysis ... 88
4.3. Research Limitations ... 89
5. Conclusions and implications for future studies ... 91
4
7. Appendices ... 103
7.1. Questionnaire ... 103
5
Table of Figures
Figure 1 Projections of future global warming ... 10
Figure 2 Development of global GDP per capita ... 13
Figure 3 BRIC´s real GDP growth ... 14
Figure 4 Number of undernourished people in 2009 ... 16
Figure 5 Supply Chain Model ... 23
Figure 6 The Sustainable Supply Chain ... 24
Figure 7 Classification based on problem context in supply chain design ... 25
Figure 8 Reverse Logistics ... 26
Figure 9 Sustainable Logistics ... 28
Figure 10 Example URCA/CHIVAS Matrix... 35
Figure 11 The prospective diamond and the observed variables of the system ... 38
Figure 12 Influence-Dependence plan of actors ... 41
Figure 13 Indirect Influences in the Mactor model ... 43
Figure 14 The Mactor Convergences and Divergences Charts ... 46
Figure 15 The 15 extracted driver variables ... 56
Figure 16 The Matrix of Direct and Indirect Influences (MDII) ... 61
Figure 17 Map of influence and dependence between actors ... 62
Figure 18 Netscale of influences (NS) ... 63
Figure 19 Ranking of actors according to their competetiveness ... 64
Figure 20 MDII Competitiveness histogram ... 64
Figure 21 Simple position matrix (1MAO) ... 65
Figure 22 Valued position matrix (2MAO) ... 66
Figure 23 Histogram of actor's implication towards ts objectives (2MAO) ... 67
Figure 24 Convergence matrix (1CAA) ... 67
Figure 25 Map of order 1 convergences between actors ... 68
Figure 26 The graph of order 1 convergences between actors ... 69
Figure 27 Divergence matrix (1DAA)... 70
Figure 28 Map of order 1 divergences between actors ... 71
Figure 29 Graph of order 1 divergences between actors ... 72
Figure 30 Actor's ambivalence matrix ... 73
Figure 31 Histogram of actor's ambivalence ... 73
Figure 32 Map of net distances between objectives ... 74
Figure 33 Graph of net distances between objectives ... 75
6
List of Abbreviations
1CAA– Simple Convergence Matrix between Actors
1DAA– Simple Divergence Matrix between Actors
1MAO– Simple Position Matrix of each actor with each objective
2COO - Valued Convergence Matrix between Objectives
2DOO - Valued Divergence Matrix between Objectives
2MAO– Valued Position Matrix of each actor with each objective
3PL– Third Party Logistics
BCM– Bromochloromethane (CH2BrCl)
CFC– Chlorofluorocarbon
CO2 – Carbon Dioxide
EU– European Union
FAO - Food and Agriculture Organization of the United Nations
GDP– Gross Domestic Product
GHG– Greenhouse Gas
HBFC - Hydrobromofluorocarbon
HCFC - Hydrochlorofluorocarbon
IPCC - Intergovernmental Panel on Climate Change
ISO - International Organization for Standardization
MDG– Millenium Development Goals
MDI - Matrix of Direct Influences
MDII - Matrix of Direct and Indirect Influences
NASA - National Aeronautics and Space Administration
NGO - Non-Governmental Organization
7 OECD - Organization for Economic Co-operation and Development
OPEC - Organization of the Petroleum Exporting Countries
SPSS - Statistical Package for the Social Sciences (Microsoft Software)
TBL – Triple Bottom Line
UN– The United Nations
WTI– West Texas Intermediate
WTO– World Trade Organization
8
1. Introduction
With the UN World Conference on Environment and Development in June 1992 in Rio de Janeiro, the words “Sustainable Development“ became a global ruling principal for the 21st century. Sustainable development stands here for development that takes into consideration the needs of present generations without impacting prospects of future generations ((WCED), 1987). In 2001, the UN established the so called Millennium Development Goals (UN Web Services Section) which should bring the more or less vague ideas and concepts into a framework with clear missions, goals and the indicators needed to measure them. Along with those goals came a various number of indicators in order to measure the forecasted progress until the defined date of achievement, the year 2015.
The protection of Biodiversity, the protection of natural resources, employment and social solidarity in combination with economic growth and social development are just a few words that express how important it is for corporations and their strategies to implement systems that guarantee exactly that in the long run. The growing global demand of goods and the decrease of natural resources to feed it, leads the industry to simply add sustainability to their major goals. The historic conflict between rising efficiency on one hand and sustainability on the other does not exist in this manner any longer.
Companies have to seek a way to guarantee economic circles that are not just in themselves efficient and sustainable but also to the world outside of the factory walls. Sustainable Logistics and so-called Green Supply Chains, which are Supply Chains that consider not just economic factors but also ecological and social ones, are already major headlines in the logistics world in regions like Europe and the United States and it is most likely that those tendencies are going to spread globally sooner or later.
9 goods and services from one step to another within the supply chain with less environmental impact of logistics.
1.1. An overview of global warming, social issues and economic data
When talking about sustainability one is usually relating to ecologic issues such as global warming and melting pole caps. As we all know our beloved planet earth is a very complex system. Just in the last decades we got to see that it is not just complex but also very fragile.
The so called greenhouse effect has been a part of the natural circle since its beginning. Carbon dioxide (CO2), the most known greenhouse-gas, and methane allow sunlight to reach the earth, but prevent some of the resulting heat from radiating back out into space.
The NASA comments that “the main human activities that contribute to global warming are the burning of fossil fuels (coal, oil, and natural gas) and the clearing of land. Most of the burning occurs in automobiles, in factories, and in electric power plants that provide energy for houses and office buildings. The burning of fossil fuels creates carbon dioxide, whose chemical formula is CO2. CO2 is a greenhouse gas
that slows the escape of heat into space.”1
A world without the natural warming due to the greenhouse effect would simply not exist the way we know it, and most of all the way it allows mankind to live. Since the industrial revolution in the middle of the 18th century much larger amounts of carbon dioxide have been released to the atmosphere. Along with the constant development of industrial economies since then and especially after the 2nd World War, the atmosphere has grown warmer at an accelerating rate: “Since 1970, temperatures have gone up at nearly three times the average for the 20th century.”2
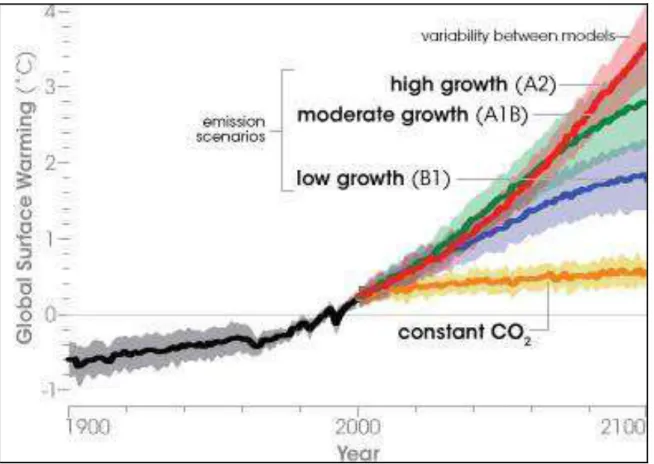
The graphic below illustrates the expected raise in global temperature until the year 2100. “Due to uncertainties about future emissions and concentrations of
1 http://www.nasa.gov/worldbook/global_warming_worldbook.html (Date of access: 20th of June 2010)
2 http://topics.nytimes.com/top/news/science/topics/globalwarming/index.html (Date of access: 20th of June
10 greenhouse gases, the net warming effect in the atmosphere, and the response of
the climate system, estimates of future temperature change are uncertain.”3
Figure 1 Projections of future global warming
Source: http://www.ipcc.ch/publications_and_data/ar4/wg1/en/spmsspm-projections-of.html (Date of
access: 20th of September 2010)
The Intergovernmental Panel on Climate Change (IPCC) made the projections of future warming, projected by Figure 1.
The IPCC used therefore 4 different scenarios, scenario B1 which has a relatively low increase of CO2 emissions, Scenario A1B with a moderate growth, scenario A2 with a relatively high growth and the scenario of relatively constant emissions of CO2. Despite the fact that this graphic can only be used as a vague estimation since scientific projections all over the world are changing almost every day, it clearly illustrates the trend towards a rise in global temperature. This rise will result not just simply in a higher sea level but it will also have an impact on water resources and natural disasters, agriculture, human health, plants and animals (IPCC, 2007).
3
11 Scenario planning, scenario thinking and scenario analysis, in general, are going to be major elements of this dissertation because they are very suitable methods to make flexible long-term plans. It can be best described as a method for learning about the future by understanding the nature and impact of the most uncertain and important driving forces affecting our world. This process encourages a knowledge exchange and a development of mutual deeper understanding of central issues important to the future of a certain field of interest (van der Heijden, 2005).
The goal is to craft a number of diverging stories by extrapolating uncertain and heavily influencing driving forces. Moreover the results and tendencies I am talking about during this dissertation are mostly based on scenarios due to the fact that we simply do not know what is going to happen in the future, neither in 2 nor in 20 years. Scenarios therefore can demonstrate possible trends and will be a very useful tool in this dissertation for strategic and successful guidance to possible future situations and the path, which lead to this future situation.
Even though it is not undoubtedly proven that human behaviour causes this rise in temperature, a survey conducted by the University of Illinois at Chicago in 2009 states: “A group of 3,146 earth scientists surveyed around the world overwhelmingly agree that in the past 200-plus years, mean global temperatures have been rising, and that human activity is a significant contributing factor in changing mean global temperatures.”4
The addition of 80 million people each year to an already overcrowded globe by itself is exacerbating the problems of underemployment, pollution, waste-disposal, epidemics, water-shortages, famine, over-fishing of oceans, deforestation, desertification, and depletion of non-renewable resources (CIA).
In December 2009 the world witnessed the great failure of the long overdue and highly desired United Nations World Climate Change Conference that took place in Denmark’s beautiful capital city Copenhagen (UN Web Services).Unfortunately, the global community was not able to reach a compulsory agreement which allowed to tackle ecological issues that already exist nowadays and will most likely become more challenging in the future.
4
12 Also, It is highly expectable that continued global warming will have damaging effects such as changing weather patterns, floods, draughts and damaging storms that will harm not only mankind but also plants and animals. Global warming could melt enough polar ice to raise the sea level in an alarmingly amount. This would also lead to the spread of human disease and declining crop yields that would result in poverty, chaos and migration.
As mentioned above the corresponding paradigm to sustainable development has three key elements, those of economic, social and ecological sustainability. Breaking those key elements down we talk about economic sustainability that encompasses growth, stability, productivity and trickle-down effects; environmental sustainability includes ecosystem integrity and attention to carrying capacity and biodiversity while social sustainability mainly deals with equity, empowerment, accessibility and participation (Kraemer L., 2000).
After the global financial crisis, the world economy now faces a major new challenge, together with several long-standing ones such as poverty, deforestation, global warming, lack of education and poor women’s rights in certain regions of the world among others (CIA).
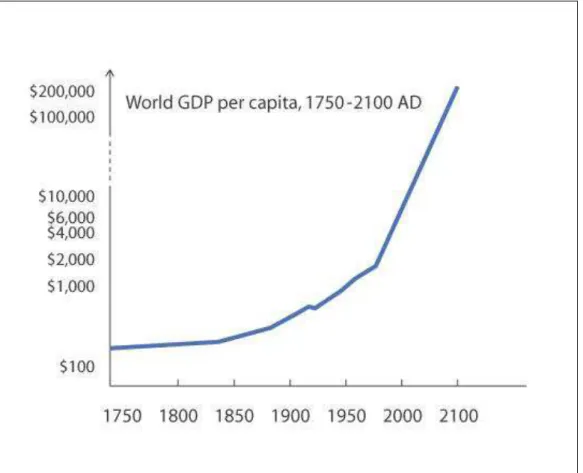
13 The most used indicator is probably the GDP per capita which is the widely accepted measure for the overall output of a country with a positive correlation with the standard of living.
Figure 2 below shows the development of the global GDP per capita from the beginnings of industrialization until a projected value for the year 2100.
Figure 2 Development of global GDP per capita
Source : http://www.futuretimeline.net/22ndcentury/images/world_gdp_2100.jpg (Date of access : 18th of August 2010)
14 drivers for the growing world economy but are still far away from reaching economic levels of Europe, Japan or the United States (Pelle, 2007).
A shift in economic power from the traditional world leaders such as the United States, Japan and Europe towards the highly growing emerging BRIC5 countries (Brazil, Russia, India and China) can be clearly monitored. A consumption growth forecast made by GoldmanSachs foresees that, by 2010, the BRIC´s will contribute to almost half of global consumption growth. Moreover the BRIC countries are showing constant independent growth scenarios (compare Figure 3 below). It happened even during the latest financial crisis when the performances were relatively constant, except from Russia.
Figure 3 BRIC´s real GDP growth
Source :http://www2.goldmansachs.com/ideas/brics/drivers-of-global-consumption-doc.pdf (Date of access: 6th of June 2010)
5The acronym BRIC is a synonym for the four biggest and most important emerging markets
15 It can be stated that these economies were hit much less in comparison to the so called G3 states USA, Japan and the European Union which used to be the bench mark for decades.
Moreover 2009 marked the first year in the post-World War II era that the global output - and per capita income – declined. Global trade plummeted nearly 25% from 2008's level, the largest single year drop since World War II. Among major countries, the biggest GDP losses occurred in Russia (-7.9%), Mexico (-6.5%), Japan (-5.7%), Italy (-5.0%), and Germany (-5.0%), while China (+8.4%), India (+6.1%), and Indonesia (+4.4%) recorded the biggest gains (CIA). In 2009, global per capita income fell about 2% to US$10,500, as global unemployment rose from just over 7% in 2008 to nearly 9% in 2009 - underemployment, especially in the developing world, remained much higher (CIA).
Despite these challenges, the world economy also shows great promise. Technology has made possible further advances in all fields, from agriculture to medicine, to alternative energy, metallurgy, and transportation. Improved global communications have greatly reduced the costs of international trade, helping the world gain from the international division of labour, raise living standards, and reduce income disparities among nations (CIA). These tendencies of an overall growth of economies worldwide and the rising living standards of great parts of the world community clearly have a significant impact on the amount of goods transported throughout the world. Reducing the consequences of exactly that is one of the main ideas of Green Logistics.
When talking about social issues we are also facing the consequences of the global financial crisis. Ban-Ki Moon, Secretary General of the United Nations describes the status quo like this:
“The numbers of people going hungry and living in extreme poverty are
much larger than they would have been had progress continued uninterrupted. Economic hardship has pushed tens of millions of people into vulnerable employment and increased the number of those who, though employed, do not earn enough for themselves and their families to
rise above the poverty line of $1.25 a day.”6
6
16 Throughout the world we are facing problems of poverty and hunger, lack of education, health and equality.
The most recent estimate of the United Nations Food and Agriculture Organization (FAO), released on October 14, 2009 by FAO, says that 1.02 billion people are undernourished, a sizable increase from its 2006 estimate of 854 million people. This increase has been due to mostly three factors:
1) neglect of agriculture relevant to very poor people by governments and international agencies; 2) the current worldwide economic crisis, and 3) the significant increase of food prices in the last several years which has been devastating to those with only a few dollars a day to spend: 1.02 billion people is 15 per cent of the estimated world population of 6.8 billion ((FAO), 2009). Nearly all of the undernourished are in a developing country, which also shows that there is a big gap between rich countries and poor countries as figure 4 shows below.
These remarks should remind the reader of the complexity of logistics actions which are highly related to economic, ecological and as a consequence of those two also to social issues such as hunger and poverty.
Figure 4 Number of undernourished people in 2009
17 The problem of global poverty and hunger is used here as an example of social issues the world is facing and is going to face in the close future.
1.2 . Problem discussion
In today’s business environment, organizations are under increased pressure to provide customers with environmentally friendly logistics services, which can be described as the process of planning, controlling and implementing the effective flow and storage of goods, services and related information from the point of origin to the point of consumption for the purpose of conforming to customer requirements (Branch, 2008). Not only the emissions from transporting goods are the most visible contributors to air quality problems in urban areas, but there are also high influential interest groups such as NGO´s, governments and, last but not least, the customer itself that directly or indirectly manifests the need for Sustainable and more ecological approaches such as Green Logistics (Emmett, 2010).
Behind this new Green Wave lie two interlocking sources of pressure:
“First, the limits of the natural world could constrain business operations,
realign markets, and perhaps even threaten the planet’s well-being. Second,
companies face a growing spectrum of stakeholders who are concerned about the environment. Global warming, water scarcity, extinction of species (or loss
of “biodiversity”), growing signs of toxic chemicals in humans and animals—
these issues and many others increasingly affect how companies and society
function. Those who best meet and find solutions to these challenges will lead the competitive pack.”7
As stated above the problems that we face today consist mostly of three different dimensions: social, ecological and environmental. These dimensions interact and influence each other simultaneously. In other words, for a company to be successful in the long run, it is crucial to invest not only in economically reasonable projects but also in socially and ecologically reasonable ones. Those investments in social and
7
ESTY, D.; WINSTON, A.; “Green to Gold: How Smart Companies Use Environmental Strategy to Innovate,
18 environmental projects shall, at the same time, automatically lead to economic advantages.
According to the issues stated above it is necessary to implement management tools that are not simply economically efficient but also environmentally friendly and socially sustainable such as Green Logistics or Fair Trade8. Customers are becoming more and more aware of where their products come from, how they were produced and by whom. Environmental management activities are already part of the International Organization for Standardization (ISO) standards of the 14000-family and their influence is going to rise.
Moreover the social pressure of Non-Governmental Organizations like Greenpeace or the World Wild Fund for Nature (WWF) - an international NGO working on issues like conservation and restoration of the environment - on corporate actions can have meaningful impacts on the reputation of a product, a company or complete industry sectors.
This research will be useful to governmental agencies as a way to describe a complex system and its most influential indicators by using two methods that help to reduce complexity. Here it will be demonstrated on the example of Green Logistics as an important issue of our times but the ideas behind it can be adapted to other complex issues as well. Furthermore NGO’s can be addressed when talking about the environmental impacts of growing world trade and how to overcome them. It can be also useful for corporations by giving them an insight on how their activities first impact and second can help to overcome crucial problems of our society caused by extensive industrial activity such as pollution, diseases and climate change e.g. and how to use the positive image of green logistics and green strategies in general to increase brand or market value (Seghal, 2009).
8 Fair Trade has two basic components: the first is to provide a working model of international trade that makes a
difference to the producers and consumers that engage in it, and to do so in such a way that social objectives are
met and the second, and more radical component is to challange orthodoxy in business practices and to
encourage business toward more social ends.
RAYNALDS; “Fair Trade: The Challenges of Transforming Globalization“, 2007, p.53
19 1.3. Motivation
As stated above, it is absolutely necessary for contemporary governments and corporations to implement environmental friendly policies as well as tackling the environmental challenges we face now and in future generations by holistic and, most of all, sustainable approaches.
This research tries to show that there is the possibility of a better market penetration, compared to a conventional approach, of a corporation when applying sustainable business approaches that seek to understand the needs of the involved variables and actors. The basic idea is to analyse the driving factors for a successful implementation of a Green Logistics system to establish long-term strategic advantages simply by understanding the system as a whole and draw the right conclusions out of it.
Sustainable Logistics not only creates more productive processes but also builds a basic step towards the need of fewer natural resources as an input factor. This strategy not only saves companies money, but also creates a certain attitude and image that can be used as a marketing tool in the short run and as part of the corporate strategy in the long run.
Logistical functions such as information management, transport, warehousing, inventory management, material handling and packaging are everywhere in a business structure and play an extensive role within every corporation. They can have a huge impact on how a company performs economically.
20 1.4. Research Purpose and goal
The aim of this work is it to identify crucial elements for a well-functioning Green Logistics system presenting methods of scenario planning (URCA/CHIVAS, Mactor) in order to give useful implications for logistics decision makers on how to run a Green Logistics initiative successfully. I also intend to identify which aspects need to be observed intensively considering the entire system with all its complexity. The basic idea behind URCA/CHIVAS and Mactor is it to capture the entire complexity of the system and reducing it to the most influential parameters in order to give valuable information about the driving forces within the system.
The research questions of this paper are 1) which elements within the system Green Logistics actually make the system work efficiently and 2) which ones minimize the resistance of the involved actors against its establishment.
To answer these questions, I will first identify variables related to green and sustainable logistics. They are divided into economic, cultural, technological, social, environmental, political, demographic, and legal dimensions in order to capture its diverse background. To evaluate which of those variables have the highest influence on all the other variables, I will run a structural analysis, by using the URCA/Chivas model, which will be explained in detail in chapter 2.3. This model also gives a hierarchical order of the crucial variables, ranked by their motricity within the system. By using the MACTOR model afterwards, which will be explained in chapter 2.4., the relevant actors and their strategies will be identified. Moreover, the crucial variables identified by the structural analysis will give me the objectives of the system “Green Logistics”.
21
2.
Literature Review
2.1 . Sustainable and Green Logistics and Supply Chain Management
Currently, society has become increasingly dependent on their transport systems to support a wide variety of activities ranging from commuting, to supplying energy needs, to distributing parts between factories. A quite frequent challenge is to develop transport systems that satisfy mobility needs as well as support economic development. Moreover, it became quite crucial for transportation in general to consider ecological and social issues. Transportation itself is a major part of our day-to-day routine in order to overcome space which is shaped by a great variety of human and physical constraints. The most common ones are time, distance, administrative divisions and/or topography. The goal of transportation is thus to transform the geographical attributes of freight, people or information, from an origin to a destination conferring them an added value in the process. In doing so, social, ecological and obviously economic aspects of transportation have to be considered (Rodrigue, J-P., 2009).
As stated above, the complexity of the term sustainable or green logistics is quite difficult to grasp, because there exist numerous definitions, frameworks and theories. Some use the term “sustainable logistics”, others prefer calling it “green logistics’ and others again simply refer to it as “reverse logistics”. Each of these terms can be distinguished by details or different approaches even though their main principle is identical. For this paper, I will continue using them interchangeably according to the context. Don Wilson for example, president of the Wilson Group, describes Green Logistics as “using less energy (which also means fewer emissions) to deliver finished products to a retail point of purchase while retaining enough profit margin to keep the doors open” (Wilson, 2009). Even though this is quite a straight forward statement, it describes pretty well what is and should be important to a company seeking to implement green logistics tools, fewer input with still efficient output.
Before getting deeper into what green logistics and its similar terms actually are, it might be interesting to explore what a supply chain and logistics itself are.
22 supplier to the customer. A customer can be internal, i.e., within one organization, or external, beyond the walls of one’s organization. Supply chain activities usually transform natural resources, raw materials, and components into a finished product that is delivered to the final customer. A major part of managing a supply chain is not only the flow of materials, but the management of channel intermediaries with the supply chain (Wood, D., 1998). In our study, supply chain systems are more sophisticated and used products re-enter the supply chain at any point where residual value is recyclable. Supply chains usually link the value chain, which means that the value of the good transported increases from each step to the next step on the very same chain.
For freight transportation, for example, all the components of a supply chain require movements of raw materials, parts and finished products on modes such as trucks, rail, or containerships. Thus, transportation is directly the outcome of the functions of production, manufacturing, and consumption (Rodrigue, J-P., 2009).
Govil and Proth created a very adequate definition when they describe logistics as a global network of organizations that cooperate to improve the flows of material and information between suppliers and customers at the lowest cost and the highest speed with the objective of customer satisfaction (Govil, 2002).
Here also the term “global” is introduced. The growing internationalization of the industry during the last two decades does not allow leaving out that term. Almost every good we use nowadays passes through various locations on the globe from the point of origin of each raw material involved to the home’s of the final customer throughout the world.
23
Figure 5 Supply Chain Model
CHEN, I. J.; PAULRAJ, A.; “Towards a theory of supply chain management: the constructs and measurements.” In: Journal of Operations Management, 22/2, 2004, p. 119-150
The most suitable definition of logistics in my view is the one Andreas Kannt uses when he describes it as “the part of the supply chain that plans, implements and controls the efficient, effective flow and storage of goods, services and related information from the point of origin to the point of consumption in order to meet
customers’ requirements.”9 In other words, logistics is involved in every process
from bringing an item from location to location within the supply chain, while at the same time keeping track of it and maximizing the efficiency of each movement. As we can see, both terms are interrelated in many ways and need to be addressed simultaneously. In other words logistics are necessary for a well working supply chain and a well-organized and cooperative supply chain is crucial for efficient logistics.
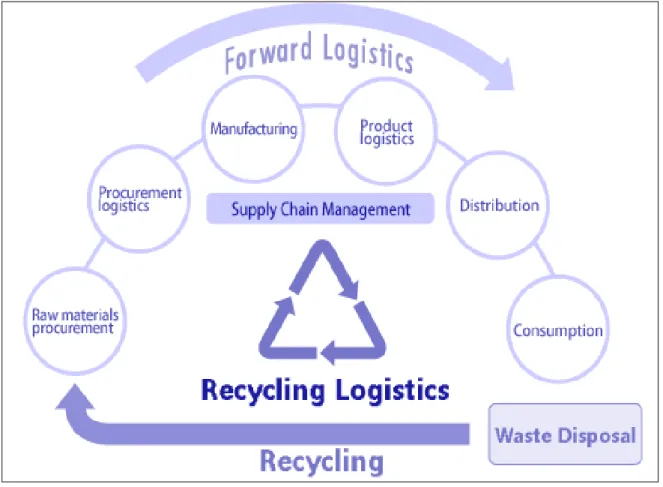
Figure 6 therefore illustrates that interrelation already including aspects of sustainable logistics.
24
Figure 6 The Sustainable Supply Chain
Source: http://www.kwe.co.jp/en/service/casestudy/logistics/green/index.html, (Date of access: 2nd of August 2010)
The first sustainable or green approach on logistics rose in the mid 1990’s due to the great awareness of environmental aspects. This awareness emerged out of a growing customer preference which was then followed by legal requirements. Countries like Germany e.g. passed laws already in the early 1990’s mandating that all packaging be returnable from customer to retailer, from retailer to wholesaler and from wholesaler to manufacturer (Wood, D., 1998). Even though this movement was growing much faster in Europe and Japan the global logistics world is simply unthinkable without sustainable aspects. Moreover the tendency to fewer raw materials in general and a strong dependency on fuel prices for the logistics industry in particular gave another incentive to develop “greener” strategies.
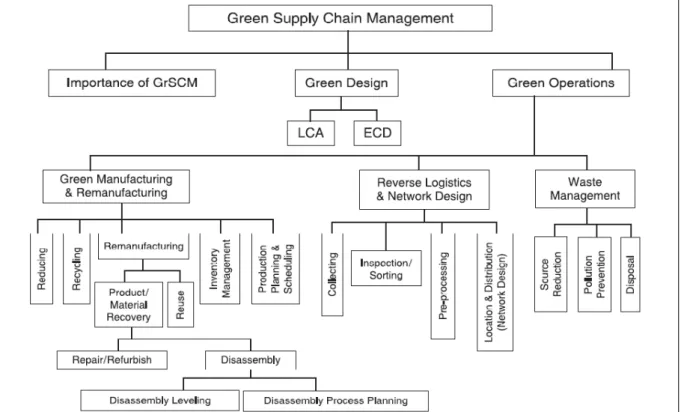
25 Management, Reverse Logistics and Green Manufacturing as an additional issue to the already highly complex system and mind-sets (Srivastava, 2007).
Figure 7 Classification based on problem context in supply chain design
Source: (Srivastava, 2007)
Out of these tendencies two main dimensions of green logistics arose. First, the aim of making the own global supply chains of companies more energy efficient and less environmentally harmful. And second, the need of bringing a company’s products into compliance with foreign government regulations (IOMA, 2007). As mentioned above, still the main impetus for greening the supply chain stems from customers who continue to push more to environmentally friendly products and services, and retailers who continue to demand better recycling solutions (Lopata, November 2009).
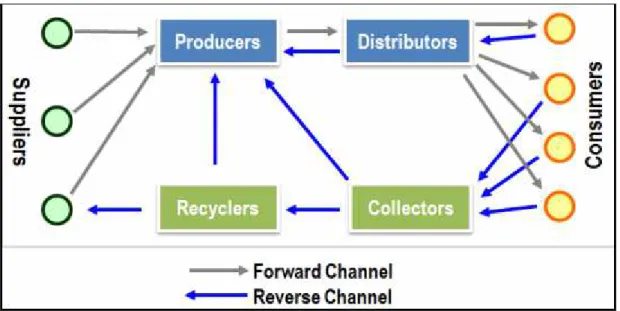
26 The transportation industry is undeniably a major contributor to environmental issues through its modes, infrastructures and traffics. The developing field of sustainable logistics and all its various characteristics can be seen as an opportunity for the transportation industry to present a more environmentally friendly face. While traditional logistics seeks to organize forward distribution, which is mostly the transport, warehousing, packaging and inventory management from the producer to the consumer, environmental considerations opened up markets for recycling and disposal, and led to an entire new sub-sector: reverse logistics (Rodrigue, J-P., 2009).
The conventional forward distribution channel in freight distribution usually deals with raw materials, parts and finished goods flowing from suppliers to producers, distributors and, finally, to consumers. In many cases, there is also a reverse channel where wastes, packages, and defective/obsolete products are flowing back up the supply chain again. In some cases, distributors will take back the merchandises, but in many others, a specialized segment of the distribution industry aims at collecting and then recycling goods and parts. Thus, reverse logistics is concerned about the movements of previously shipped goods from customers back to manufacturers or distribution centres due to repairs, recycling or returns (Dyckhoff, 2010).
Figure 8 shall give a visual overview of the idea of reverse logistics.
Figure 8 Reverse Logistics
27 As concern for the environment rises, companies need to take more account of the external costs of logistics associated mainly with climate change, air pollution, noise, vibration and accidents. Examining ways of reducing these externalities and achieving a more sustainable balance between economic, environmental and social objectives is a main aspect of green logistics.
Green Logistics, on the other hand, as explained before, is mostly concerned with
producing and distributing goods in a sustainable way, or in other words, taking
into account environmental and social issues. Furthermore the objectives are not
only concerned with the economic impact of logistics policies on the observed
company, but also with wider effects on society, such as the effects of pollution on
the environment. Activities on Green Logistics also include measuring the
environmental impact of different distribution strategies, reducing the energy
usage in logistics activities, and reducing waste and managing its treatment
(Sbihi, 2007).
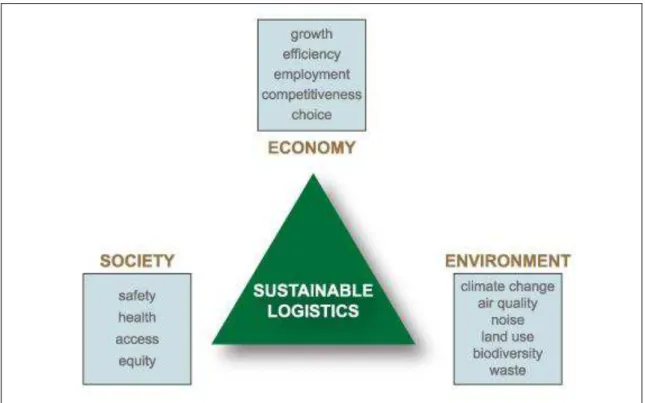
In doing so, Green Logistics also uses the so called Triple Bottom Line Approach (TBL) which is a metric for a corporation’s social, environmental, and economic performance. It seeks to describe business involvement in sustainability. TBL is all about dropping the financial bottom line as a meaningful indicator of where you stand in the market place and replacing it with a bottom line that properly acknowledges the interplay of the social, economic and environmental dimensions of our lives (Norman & MacDonald, Vol. 14, No.2, 2004).
28
Figure 9 Sustainable Logistics
Source: http://www.greenlogistics.org/PageView.aspx?id=97, (Date of access: 28th of August 2010)
2.1.1. The 4 dimensions of Transportation
Transport represents one of the most important human activities and is an indispensable component of the economy. It creates valuable links between regions and economic activities, between people and the rest of the world.
It is a four-dimensional activity whose importance is: .
1. Social.
Transport modes facilitate access to healthcare, welfare, and cultural or artistic events, thus performing a social service. They shape social interactions by favoring or inhibiting the mobility of people. Moreover it supports and may even shape social structures.
2. Political.
29 subsidize the mobility of their populations (highways, public transit, etc.). While most transport demand relates to economic imperatives, many communication corridors have been constructed for political reasons such as national accessibility or job creation.
3. Economic.
Transport has always naturally been linked to economic development.
It is an industry in its own right (car manufacturing, air transport companies, etc.). It also is an economic factor in the production of goods and services. It contributes to the value-added of economic activities, facilitates economies of scale, influences land (real estate) value and the geographic specialization of regions (Rodrigue, J-P., 2009). It can surely be stated that transport is both a factor shaping economic activities, and is also shaped by them.
4. Environmental.
Despite the various advantages of transport, its environmental consequences are also significant. They include air and water quality, noise level and public health. Therefore a common trend, as stated above, is relating decisions to transport, taking into account its corresponding environmental costs. Transportation is a dominant factor in contemporary environmental issues. Substantial empirical evidence indicates that the importance of transportation is growing (Rodrigue, J-P., 2009).
The following contemporary trends can be identified regarding the issue:
• Growth of the global demand. The twentieth century, more than any other, has seen a considerable growth of the transport demand related to individual (mostly passengers) as well as freight mobility. This growth can partly be seen as the result of larger quantities of passengers and freight being moved, but also the longer distances over which they are carried (Rodrigue, J-P., 2009).
30 overcome larger distances and further exploit the comparative advantages of space (Gangophady, 2009).
2.1.2. Examples of Industry initiatives and tools on Sustainable Logistics
During the last decades various initiatives have been made once through governmental incentives and also directly by the involved industry in order not only to benefit from a better public standing but also from its long-term economic benefits. Still, environmental programmes or initiatives need to involve agreements and partnerships between public and private operators, in order to take concerted action to tackle some of the most pressing environmental problems.
These innovative public/private programmes are designed to encourage voluntary adoption of technologies and strategies that save fuel and reduce greenhouse gases in the freight sector. Most of these programmes and initiatives are not specifically related to transport and logistics. Nevertheless, as the role of transport in Green House Gas emissions is constantly increasing, it seems worthwhile to consider all these programmes in order to have a complete overview.
The programme that looks most pertinent to the logistics world is the EPA SmartWay programme, which has sister programmes active in Mexico and Canada. As described below, several European countries have taken similar initiatives to promote best practices in the area of sustainable public, commercial and industrial transportation.
EPA US SmartWay programme (USA)
31 of other emissions and/or pollutants (United States Environmental Protection Agency, 2010).
The Energy Saving Trust and others (United Kingdom)
Current programmes are the Energy Saving Trust, Safe and Fuel Efficient Driving (SAFED) and Freight Best Practices. The Energy Saving Trust conducts green fleet reviews for fleets of more than 50 vehicles, as well as providing advice to smaller fleets, to help them cut costs and emissions (Energy Saving Trust, 2009). The Safe and Fuel Efficient Driving (UK Road Safety Ltd., 2005) programme includes ecodriving for van and heavy goods vehicle drivers. This programme teaches road skills to help industry increase safety as well as reduce fuel costs and emissions. A new working group has been created in conjunction with the freight and logistics industry to develop a consistent carbon measurement and reporting method standard for the logistics transport supply chain. The objective is to develop a basis that can be used for a future reward structure – such as a voluntary recognition scheme – which industry, or potentially government, could develop. Freight Best Practice is funded by the Department for Transport to promote operational efficiency within freight operations and offers free essential information for truck operators covering a wide range of topics (UK Road Safety Ltd., 2005).
Green Distribution Partnership and others (Japan)
32 Objectif CO2. (France)
In 2008, the French Ministry of Ecology and Sustainable Development and Spatial Planning (MEEDDAT) and the French Environment and Energy Management Agency (ADEME), together with the main French road transport and logistics associations, launched “Objectif CO2 - Les transporteurs s’engagent”. This voluntary public-private programme to reduce CO2 emissions in the transport sector provides a framework for transport companies to commit to reducing their fuel consumption and CO2 reduction. Twenty-five large transport companies in France are already participating and this number was expected to be around 100 at the end of 2009.The programme includes a CO2 diagnosis (baseline), identification of company specific environmental performance indicators, emission reduction goals to be realised within three years, and action plans (French Environment and Energy Management Agency, 2009).
EU Emission Trading Scheme
In January 2005, the European Union Greenhouse Gas Emission Trading Scheme (EU ETS) commenced operation as the largest multi-country, multi-sector Greenhouse Gas Emissions trading System in the world. The scheme is based on Directive 2003/87/EC, which entered into force on 25 October 2003. Since 2005, some 10 000 large industrial plants in the EU have been required to buy and sell permits to release carbon dioxide into the atmosphere. An emission trading scheme enables companies that exceed individual CO2 emissions targets to buy allowances from 'greener' ones to help reach the targets for the EU under the Kyoto Protocol (European Commission, 2010).
D
The Carbon Trust
33 The Greenhouse Gas Protocol
The Greenhouse Gas Protocol (GHG Protocol) is the most widely used international accounting tool for government and business leaders to understand, quantify, and manage greenhouse gas emissions. The GHG Protocol works with businesses, governments, and environmental groups around the world to build a new generation of credible and effective programmes for tackling climate change. The GHG Protocol was jointly convened in 1998 by the World Business Council for Sustainable Development (WBCSD) and the World Resources Institute (WRI) (Greenhouse Gas Protocol Initiative, 2011).
International Carbon Action Partnership
In October 2007, leaders of more than 15 governments met in Lisbon to establish the International Carbon Action Partnership (ICAP). ICAP is made up of countries and regions that have implemented or are actively pursuing the implementation of carbon markets through mandatory cap and trade systems. The partnership provides a forum for sharing experiences and knowledge. Sharing and evaluating best practices will help ICAP members determine the extent to which their respective programmes can be supported by, and/or benefit from, the ICAP process (International Carbon Action Partnership, 2011).
2.2. Methodology: Structural analysis with URCA/Chivas
In order to project the influence of Green Logistics on the MDG, this thesis is going to use the method of Structural Analysis. “Structural analysis is a tool that structures the pooling of ideas. This form of analysis describes a system using a matrix which combines the constituent components of the system. This method identifies the main variables which are both influential and dependent: those which are essential to the evolution of the system.”10
10
34 Structural analysis is, aside the method of scenarios, one of the most used tools in future studies. Claiming to have its inspiration in the systemic approach, structural analysis experienced a real boost no sooner than in the late 1960's. Jay Forrester who worked on models of industrial dynamics, and then urban dynamics (1961), can be seen as one of the initiators of the first justifications of structural analysis. At the same time, the necessity to take into account multiple and homogeneous, qualitative and quantitative variables, induced the pioneers of structural analysis to use other modes of representation based on matrix and charts.
Structural analysis is a tool designed to link up ideas. It allows describing the system thanks to a matrix which links up all its constitutive elements. The method enables, by studying these relations, to underline the variables that are essential to the system's evolution. It has the advantage of stimulating reflection within a group, and leading it to think about certain aspects, which are sometimes counterintuitive. It applies to the qualitative study of extremely different systems.
The system composes a group of interrelated elements. These elements' interrelations web, or in other words its structure, constitutes the key of its dynamics and remains quite permanent. Structural analysis, which aims at bringing this structure to light, takes place in usually three stages:
1. the inventory of variables / factors
2. the description of relationships between variables where the interrelations between the elements or variables are being described
3. the identification of essential variables where the essential variables and key factors to the system's global dynamics are being identified.
The URCA Matrix identifies which are the most influential and dependent variables. In order to define our key variables, we informed the matrix how each variable influenced the other variables. We classified the influence as being:
U - Unidirectional Influence
R - Reversal Influence
C - Circular Influence
35 C u s to m e r re q u ir e m R e s is ta n c e t o f o s P re fe re n c e t o lo c a E n v ir o n m e n ta l C o P e rc e n ta g e G ro w t M o v in g A ir t o S u r A p p ro v a l a n d D e m A m o u n t o f G re e n h In v e s tm e n ts i n T r In v e s tm e n t in E n e O il p ri c e P ri c e o f L a n d L e n g th o f P ro d u c t In v e s tm e n ts i n I n F re ig h t tr a n s p o rt i M o d a l s p li t (% o f In v e n to ry M a n a g e F u tu re a v a il a b il it y P e rc e n ta g e o f e m A v e ra g e l e n g th o f H a n d li n g f a c to r ra E ff ic e n c y o f F le e t In la n d f re ig h t c o s t F re ig h t C o s t E n v ir o n m e n ta l fe e A m o u n t o f w a s te C u s to m s d u tie s f o S u s ta in a b le T ra n s T a x I n c e n ti v e s f o P o rt & t e rm in a l c h S tr e n g th a n d E ff e P o li tic a l s ta b il it y C a rb o n T ra d e N u m b e r o f tr a n s it W o rk in g C o n d it io n A m o u n t o f d is e a s F a ir T ra d e I n it ia ti v G re e n M a te ri a l U s F u e l e ff ic ie n c y ( ra In te g ra tio n o f IT in H y b ri d o r E le c tr ic G o in g S o la r P ro d u c t a n d p a c k S p e e d o f L o g is ti c
1 Customer requirements 1 C C C U U U U U U C A C A U U A U A U U A C C U U A U A A U A U U U R U U U A U U C C
2 Resistance to fossil fuels C 2 U C U U U C A U C A A U U U A C A U A U U U R A A U U A A A U A A R U U U U U U U A
3 Preference to local products C 3 C A U U U U U A U U A A U U U A U U U U U A A C A A C A C A U U A U A A A A A U U
4 Environmental Consciousness C C C 4 U U U C U U C A U U U U A C U U U U A A U U U U U A U A U U U R U U U U U U U U
5 Percentage Growth of Amount of Vehicles 5 A A U U A C A C C A U A C A A A A A A R A A R R A A A C A A A A A C A C A A U
6 Moving Air to Surface routes 6 A U C A R R A C C C U R U U U C C C A A R R R R A A C U U A U A U U A A C C
7 Approval and Demand for Sustainable Development Projects 7 U U U C A A U U U A R A U A U A A U U A C C A C A C U U R U U U U U C U A
8 Amount of Greenhouse Gas Emmissions (GHG) C C 8 C C C A A C R C R R R R R R A A R R A R R A R A C A A U R R R R R R R R
9 Investments in Train routes C C 9 A C C A C R C C C A C C U C C A A C A A A A A A C A A U A U A A A C C
10 Investment in Energy Industry Development - Alternative Energy, Tec C 10 C A A U U U U C U U U U A A C U A U C A C A C U U C U U U U U U U U
11 Oil price C C C C U C C C C 11 A C U U U U C A U U U U U U A A U A A A C C U A U U C C A C C U U
12 Price of Land U C 12 A C A C U A A U A A A A A A A A A A R C A A A R U A A A A A A A
13 Length of Product Life Cycle C C C 13 R U U U C A U A A A A A A A A A A A A C A U A U A A A A A U U
14 Investments in Infrastructure (Ports, Aiports, roads) C C C C C U 14 C C U U U C C U C C A A A R R C A C A U U A A A A U A A A U
15 Freight transport intensity (ratio of tonne-kms to GDP) C U U C 15 U U U U U U C C C A R R R R C A A C U A U U A U U A A U U
16 Modal split (% of goods moved by different modes) C C C C C 16 C U U U U U C C R A R R R R A A R C U A U A U U A A C U
17 Inventory Management U C C 17 U U U U U U U A A R A A R A A A R C A A A A C A A C C
18 Future availability of the natural resource oil C C C U U U C C C C 18 C C C C U U R A A R R A C C C A A A U U C U U U C C
19 Percentage of empty containers U C 19 R R U C C A A C A A C A A A C U A A A U R A A C C
20 Average length of haul U C C C U 20 C C C C A A R A A R A A A C A A U A U C A A U C
21 Handling factor ratio U C C C U C 21 C C C A A R A A R A A A C U A U A U C A A C U
22 Efficency of Fleet Management C U C C C C 22 C C A A R R R R A A R R C A A A C C A A C C
23 Inland freight cost C C C C C C C C C C 23 C R R R R R R A A R C A A U A R R A A R R
24 Freight Cost C C C C C C C C C C C 24 R R R R R R A A A R A A U A R R A A R R
25 Environmental fees U U U C U U U U 25 U U U C U C A C U U U U U U U U U U U
26 Amount of waste disposal regulation U U U U 26 A R A A C U A A U C A U U U U U U A
27 Customs duties for imports and exports C U C U U U C U U U U U 27 C C C A R R C A A U A A A A A C C
28 Sustainable Transport Policies U U C U U U U U U U U U C 28 C U U A C U U U U U U U U U U U
29 Tax Incentives for Sustainable Technologies U U C U C U U U U U U U C C C 29 A C A U A U U U U U U U U U A
30 Port & terminal charges C U C C U U C U U U U U C 30 A U A U A A A U A A U U U U
31 Strength and Effectiveness of Public-Private Partnerships C U C U C C C C 31 C C A U U U U U A U U U A
32 Political stability C C C C C U C 32 C A C R C A A A A A A A
33 Carbon Trade C C C C C C C C U C U U C U C C C 33 U U U U U U A C C C A
34 Number of transit countries crossed C C U C C C U C U C 34 A A U A U U A A C C
35 Working Conditions C C C 35 R R A A A A A A A
36 Amount of disease related to ecological issues U U U U C U C U U 36 C C C A C C C A
37 Fair Trade Initiatives U C U C 37 A A A A A A A
38 Green Material Usage U C C 38 A A C C C U
39 Fuel efficiency (ratio of fuel consumption to vehicle-kms) C U C C C U U C 39 C U U C C
40 Integration of IT in the supply chain U C U C C C U U C 40 A A C C
41 Hybrid or Electric Vehicle usage C U C C C C 41 A A U
42 Going Solar C U C C C C 42 A A
43 Product and package design C C U C C C C C C C U U C C C C C C C 43 C
44 Speed of Logistics C C U C C C C C C U U C C C C C 44
37 The basic logic behind the interrelations expressed in a structural analysis matrix is based on an algorithm that Arcade, Godet, Meunier and Roubleat describe as follows:
1. Determination of variables/factors which receive no influence (empty columns in the structural analysis matrix)
2. Visual alignment of the variables concerned, which will constitute the peaks of the tree to be drawn
3. Removal of the variables concerned by barring rows and columns corresponding to them in the matrix
4. Repetition of the process until no variables are left
5. Transcription of direct influence relationships in the matrix in the form of arrows.11
The URCA/CHIVAS model computes all those steps automatically and gives a certain hierarchy of variables as a result. The calculation itself is based on counting the U´s, R´s, C´s and A´s per line and column filled in by the expert group describing the relationship between different variables. Each U for one variable in relation to another means an R for the very opposite combination expressed by either 1 or 0, while C´s create the same value (1) for both and A´s, which stand for no relationship at all can be expressed as 0´s. Summing up the rows gives a first hierarchy about the most influential variables while the sum of each column allow to draw a first conclusion about the most dependent variables. This first result already should give an idea about the hierarchy of the variables in terms of dependency and influence among the observed crucial variables of the system. Nevertheless the initial process of filling-out the URCA/CHIVAS matrix does not take into consideration indirect influences between the underlying variables nor does the initial hierarchy.
In order to include these indirect influences, the URCA/CHIVAS model multiplies the underlying matrix several times which can lead to changes within the hierarchy. Unfortunately it was not able to reveal the amount of times necessary for the matrix being multiplied until a reasonable result is produced.
11
ARCADE, J.; GODET, M.; MEUNIER, F; ROUBELAT, F.; “Structural analysis with the MICMAC method
38 2.2.1. List of relevant variables
In order to run the URCA/Chivas Model, it is necessary to define variables that may have an effect on the variable analyzed and rank their influences. The variables have been selected according to the prospective diamond (Figure 11) which is used in various aspects of organizational research (Cavalcanti, 2006). The system that is under research should be seen as a whole, which cannot be disassociated from its active elements and the meaning of which can only be fully perceived when analysed simultaneously with the set of the interrelationships involved (Marques, 2009). The variables that were identified significant in their influence on the system by the author are listed in figure 11 according to their classification as a cultural, demographic, ecological, economic, legal, social, political or technological variable. A total of 44 influential variables to the system Green Logistics were identified as listed below showing the prospective diamond with its eight dimensions and the variables representing them. All observed variables were chosen by the author according to his knowledge about the subject and personal perception of important aspects to the system.
Source : Created by author based on (Cavalcanti, 2006)
39 2.3. The MACTOR model
41
Figure 12 Influence-Dependence plan of actors
Source: GODET, M.; “Scenarios and Strategies; A Toolbox for Problem Solving”, 2004. p. 72
42 Lastly in step seven strategic recommendations and key questions for the future are being formulated One advantage of the MACTOR method is that it works for a wide range of strategies involving several actors using a series of stakes and associated objectives. In this, it is different from research coming from game theory which often results in the construction of models which can be applied but are not applicable. Nevertheless, significant progress may be made through a closer relationship between the concepts of game theory and the MACTOR method (Arcade, 2006). The MACTOR method contains a certain number of limitations concerning the gathering of necessary information. A certain reticence on the part of the actors may be observed when they are asked to reveal their strategic projects and external means of action. Representing an actor game on the basis of this method presupposes consistent behaviour on the part of each actor in relation to the outcome, which is often contradicted in reality. In terms of tools, MACTOR software currently requires only two tables of data from which several pages of result listing and diagrams can be obtained. Yet, this is the main danger that lies in wait for MACTOR’s users seduced, even carried away by the tide of results and comments generated, they forget that everything depends on the quality of the input data as well as the ability to pick out the most relevant results (Godet, Scenarios and Strategies; A toolbox for problem solving, 2004). Although the MACTOR method fits into the scenario method, where structural analysis, actors’ strategies, and probabilistic cross-impact matrices are commonly used it can also be used on its own, either for prospective purposes or for the analysis of a given strategic situation. In structural analysis, these impacts deal with variables, while the actors’ strategies concern actors and their characteristic objectives and probabilistic models combine events and hypotheses to create a certain scenario which are different from forecasts because they are based less on experiences of the past but on the experts opinion about actual developments.
2.3.1. Functioning and Output of the Mactor model
The method basically uses three main inputs, collected in three different matrixes.
43
c a,c c,b
b a, b
a, MID min MID ,MID
MIDI
URCA/CHIVAS - stored in the position matrix (1MAO). The Position is treated as the opinion of each actor on each of the formulated issues, determining whether it stands positive (value of 1), negative (-1) or neutral (0) to a particular issue. The second relevant input is the weight and relevance that actors give to a certain issue, collected in the so-called salience matrix. This matrix shall express how important each issue is to an actor, evaluated on a scale ranging from 0 (not important) to 4 (highly important).This matrix is merged with the position matrix, creating the 2MAO matrix which cells are the product of the corresponding cells of the salience and position matrixes (Bendahan, 2003). The final and third input is the influence of the involved actors on each other, filled into the influence matrix (MID) ranging from 0 to 4, respectively meaning from no influence to very high influence.
As being described, the first part of the method is mostly dedicated to the development of the concept of influence both between actors and on actors towards certain objectives or issues. While the input only includes the direct influence between actors, the Mactor model also takes into consideration indirect influence, which is exerted through the use of the influence with other intermediary actors (see Figure 13).
Source: (Bendahan, 2003)
According to this logic, the model automatically computes the matrix of direct and indirect influences (MIDI), which contains, for each pair of actors, the direct influence plus all the indirect influences passing from every possible intermediary actor (Bendahan, 2003).
A
B
C D
The influence of A on C, is the sum of the direct
influence it has on C and of all indirect influences it gains through all the other third actors (here B and D)
44
a,ab a,b
a MIDI MIDI
I
a,ab b,a
a MIDI MIDI
D
a aa a a a, a a D I I I M IDI -I r a a i a, i
a, 2MAO r
3MAO
i a,i
a 3MAO Mob
a a,i a,i
i 3MAO 3MAO 0
Ag
a a,i a,i
i 3MAO 3MAO 0
Disag
The proposal here is it to determine the indirect influence using the minimum of the two direct influences and generate an aggregate value which is the non-weighted sum of the direct and all indirect influences involved. The matrix itself allows determining the influence and dependence coefficients, which are themselves the sums of respectively the rows and the columns of the MIDI matrix, as seen in formulae below.
Having these values and comparing them to the other actors influence and dependence, the relative strength standardized coefficient can be calculated as seen in the equation below , allowing a first sight on the effective power of the observed actors (Bendahan, 2003).
In order to obtain a new matrix called 3MAO which contains an aggregated factor including position, salition and power the relative strength coefficients mentioned above are then applied to the 2MAO matrix using the formula:
Therefore the 3MAO matrix sets the basis of most of the analyses proposed by the MACTOR model and besides that important values can be drawn directly from it, such as the mobilization coefficient (see below), showing how much the different actors are involved in the situation, and the agreement and disagreement coefficients (see below), that indicate how controversial are the different objectives.