Arch. Biol. Sci., Belgrade, 66 (1), 337-346, 2014 DOI:10.2298/ABS1401337B
337
IMPORTANT BIOINDICATORS FOR HEALTH MANAGEMENT IN ROMANIA I. BARLIBA1,2 and S. TITA1
1 “Alexandru Ioan Cuza” University, Iaşi, 700506, Romania 2“Sf. Spiridon” University Emergency Clinical Hospital, 700506 Iaşi, Romania
Abstract - Performance measurement is a coherent, robust, integrated, purposeful, comprehensive, eicient and transpar-ent system. he evaluation of healthcare performance in Romania is based on four categories of bioindicators: human resources, use of services, economic and inancial aspects, as well as quality. In this work, we were mainly interested in ana-lyzing and describing these parameters. In order to illustrate the applicability of the hospital performance indicators, we considered the results obtained for these indices from the managers of three hospitals of the same level from Romania, the “Filişanilor” Hospital from Filiaşi, the Rovinari City Hospital and the Şegarcea City Hospital, and herein present them.
Key words:Evaluation, measuring performances, health, bioindicators
INTRODUCTION
he indicators for healthcare performance measure-ment can be categorized into two main classes: health expectancies and health gaps (Mihaila, 2006).
he irst class includes indicators such as disa-bility-free life expectancy (DFLE), active life expect-ancy (ALE), as well as the disability-adjusted life ex-pectancy (DALE). he indicators in this group, rep-resented by the hopes of health, mainly estimate the average number of years a person is expected to live in a certain state of health.
Among the health gap indicators, we found the disability-adjusted life years (DALY) or health ad-justed life expectancy (HALE). For a better under-standing of this group of indicators, the concept of “years of potential life lost” has been introduced to quantify the burden of mortality from various causes of death. his index estimates the period of “lost”
years in a person’s life between the real age at death and an age, arbitrarily chosen as a standard age, be-fore which death is considered premature (usually the age of 65 or 75 years) (Pineault et al., 2005). In other words, the concept of years of potential life lost (YPLL) describes the average time a person would have lived had he or she not died prematurely.
Health gap (losses of health) extends the notion of losses due to premature mortality in order to in-clude losses occurring as a result of time lived in dif-ferent states of health other than very good health (Khaliq et al., 2007).
338 I. BARLIBA ET AL.
healthy life, which has been changed since 2010 to Life Expectancy Index, educated population, as well as decent standard of living.
In order to illustrate the applicability of the hos-pital performance indicators, we considered the re-sults obtained for these indices from the managers of three hospitals of the same level from Romania, the “Filişanilor” Hospital from Filiaşi, the Rovinari City Hospital and the Şegarcea City Hospital.
METHODS
Hospital performance indicators
Hospital performance was measured using the “hos-pital management performance indicators” estab-lished by the Ministry of Health OrderNo. 922/2006, on approval of the public hospital management con-tract. According to this order, the performance indi-cators of hospital management have been classiied into four main classes. he indicators are grouped in four main categories: human resources indicators, indicators of resource utilization, economic-inan-cial indicators and quality indicators (for the man-agement performance).
he group of human resources indicators in-cludes seven indicators: the average number of pa-tients discharged per physician, the average number of patients discharged per nurse, the proportion of doctors from total hospital staf, the proportion of medical staf from total hospital staf, the proportion of higher educated medical staf from all medical personnel, the average number of outpatient visits per physician and the average number of emergency room visits per physician.
he indicators of resource utilization include the following: the overall number of patients discharged from hospital, the average length of stay in hospital, the percentage of admitted patients from the total number of patients in the emergency room (%), the emergency ratio of the total number of admitted pa-tients (%), the complexity index of clinical cases, the percentage of patients with surgery from all patients
discharged from surgical sections, the percentage of patients with complications and comorbidities from the total number of discharged patients, the number of outpatient consultations, the utilization rate of hospital beds (in days) and the utilization rate of hos-pital beds (%).
he inancial and economic indicators are budg-etary execution against approved expenditure budget (%), the proportion (%) of expenditures on laborato-ry services, emergency services, continuous hospital stay services, daycare services, specialist assistance services from total expenditures, the percentage of own incomes from total hospital income, the per-centage of hospital personnel costs, costs for goods and services, drugs costs from the total hospital spendings, the percentage of drugs expenditure pro-visions from the goods and services total propro-visions spendings, the percentage of capital expenditures in relation to total expenditures and the average daily cost of hospitalization.
he indicators regarding quality of care are the following: hospital mortality rate, proportion of de-ceased patients within 48 hours ater surgery, no-socomial infection rate on the entire hospital and in each section, rate of readmitted patients without appointment within 30 days of discharge, index of concordance between the diagnosis code at admis-sion and the diagnosis code at discharge, percentage of hospitalized patients transferred to other hospitals and the number of patient complaints.
RESULTS
Indicators of human resources
Proportion of doctors from total hospital staf
IMPORTANT BIOINDICATORS FOR HEALTH MANAGEMENT IN ROMANIA 339
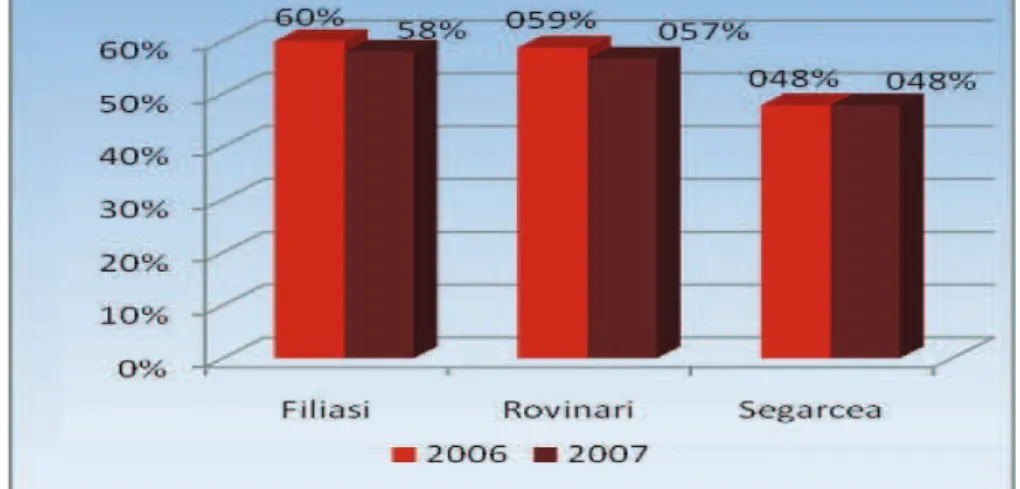
according to the status of functions, such as positions held, while the hospital employed personnel com-prises of the total number of posts occupied on labor contracts concluded for an indei nite or for a dei nite period. h e proportion of doctors from total hospital staf for the three reviewed hospitals is increasing, as shown in Fig. 1.
Proportion of medical staf from total hospital staf
h e proportion of medical staf from total hospital staf is the percentage ratio between medical staf and the total number of persons employed in the hospital. h e medical personnel includes doctors, pharmacists,
superior health personnel, physiokinetic therapists, medical bioengineers, biologists, biochemists, chem-ists, physicchem-ists, medical physics specialchem-ists, psycholo-gists, speech therapists, sociolopsycholo-gists, physiothera-pists, social workers, graduate nurses and midwives, medical equipment technicians, dental technicians, nurses, health oi cials, medical registrars and medi-cal statisticians.
Regarding the three institutions we considered for our study, the indicator registered a 2% decrease in 2007 compared with 2006 for two of the hospi-tals and no modifications were registered for the third.
Fig. 1. h e proportion of doctors from total hospital staf .
340 I. BARLIBA ET AL.
Proportion of higher educated medical staf from all medical personnel
h e proportion of higher educated medical staf from all medical personnel is the percentage ratio between higher educated medical staf and the total number of hospital staf . h e medical personnel with higher education include doctors, pharmacists, superior health personnel, physiokinetic therapists, medi-cal bioengineers, biologists, biochemists, chemists, physicists, medical physics specialists, psychologists, speech therapists, sociologists, physiotherapists, social workers, graduate nurses and higher studies midwives.
h e indicator registered an increasing trend for all three hospitals: 6% for Filiaşi Hospital, 1.63% for
Rovinari Hospital and 0.2% for Şegarcea Hospital (Fig. 3).
Average number of visits in outpatients per physician
h e physicians providing consultations in integrated departments for outpatients are doctors employed in the wards and departments with beds who provide consultations in the departments, as well as doctors from the integrated outpatient specialist departments. h e indicator is calculated as the ratio between the average number of visits to the outpatient depart-ment and the number of physicians providing con-sultations there.
A signii cant increase of over 1 000 cases per year was registered for the Filiaşi Hospital and over 600
Fig. 3. h e proportion of higher educated medical staf from all medical personnel
0 1000 2000 3000 4000 5000
2006 2007
2859
4037
3428 3600
1313 1912
Filiasi Rovinari Segarcea
IMPORTANT BIOINDICATORS FOR HEALTH MANAGEMENT IN ROMANIA 341
cases for Şegarcea Hospital, while for the Rovinari Hospital only 200 cases in 2007 compared to 2006 were recorded. h e growth of the number of diseases from one year to another is very noticeable, despite the small size of the considered hospitals, which in-dicates that the Romanian population is increasingly ill (Fig. 4).
Indicators of resource utilization
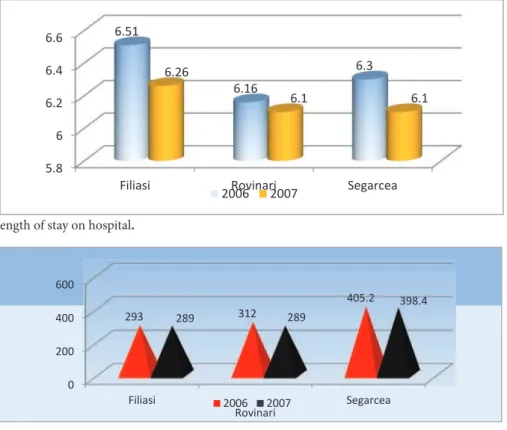
Average length of stay in the hospital and in each department
h is is the ratio between the number of patient hos-pitalization days and the number of patients hospital-ized at the beginning of the period and the number of patients between the periods.
As illustrated in Fig. 5, the average length of stay in the hospital decreases, but exceeds 6 days, the ef-fect being a constant level of costs for health care,
accommodation and food services. Hospitals would rather extend the hospitalization days in order to en-sure the budget, but this also greatly increases costs.
Utilization rate of hospital beds
h e average number of utilized beds is calculated by the ratio of beds used during a period of one year (or sometimes a quarter or semester).
h e utilization rate of beds in the aforemen-tioned hospitals is considered acceptable for the Filiaşi and Rovinari Hospitals because, in percent-age terms, it does not exceed 100%. h e situation is dif erent for Şegarcea Hospital, where the index values exceed 110% (Fig. 6). Given the fact that, ac-cording to existent legislative measures, there has to be a period of disinfection, the situation at Segarcea Hospital is alarming. h e cause could be either the small number of beds in the hospital wards or a large number of patients.
5.8 6 6.2 6.4 6.6
Filiasi Rovinari Segarcea
6.51
6.16
6.3 6.26
6.1 6.1
2006 2007
Fig. 5. h e average length of stay on hospital.
342 I. BARLIBA ET AL.
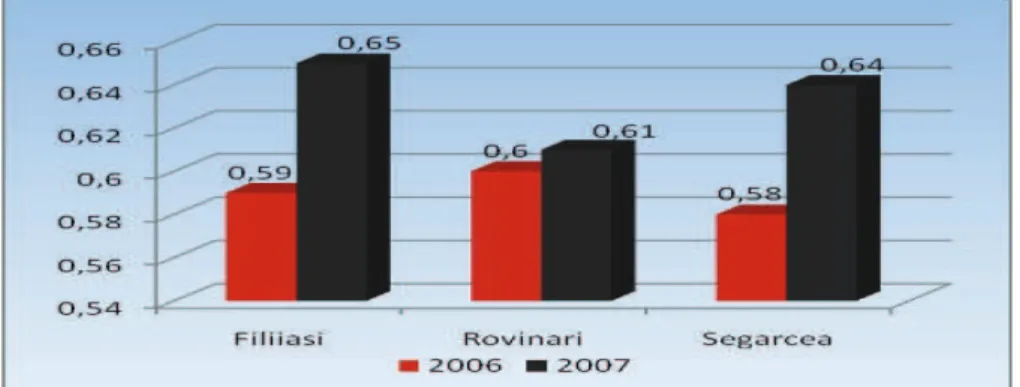
h e complexity index of clinical cases CASE-MIX (MCI)
h e complexity index of cases is a number expressing necessary hospital resources according to the types of treated patients, taking into account diagnosis and severity. h is index can be calculated as the ratio be-tween the total number of weighted cases (CP) and the total number of cases resolved (CR), as shown below:
As seen in Fig. 7, the complexity index of cases for the three hospitals is rather low. However, a cer-tain increase can be noticed for the year 2007 com-pared to 2006, due to an increase in the number of diseases in the area.
Percentage of patients with surgery of all patients dis-charged from surgical sections
h e indicator is calculated as the percentage of surgery patients of all patients discharged from sur-gical wards.
Regarding the percentage of patients with surgi-cal procedures from all patients discharged from sur-gical wards indicator (Fig. 8), the situation is dif er-ent for one of the three health units analyzed. h us, a decrease by approximately 34% occurs at the Filiaşi Hospital compared to Rovinari and Şegarcea Hos-pitals, where some increases have been registered. Due to the nature of the health unit and the values obtained for the case-mix indicator, the surgical in-terventions performed in these hospitals should be considered of simple category.
Financial and economic indicators
h e spendings pattern by type of services according to the sources of income is calculated as the percent-age ratio between the sum of the budgetary expendi-ture provisions related to services and the sum of rev-enue sources i nancing these expenditures. As a note, the value of this indicator is calculated as a percent-age related to the following structures: emergency services – including expenditure on personal rights, medicines and medical supplies, and other expenses, laboratory services (including imaging), costs occa-sioned by these services, as well as continuous hos-pitalization services and consequent costs, including expenditure under the national health programs. Other indicators day hospitalization services, costs occasioned by these services, including the expendi-ture under national health programs, hospital inte-grated ambulatory services, including expenditure on personal rights, medicines and medical supplies
IMPORTANT BIOINDICATORS FOR HEALTH MANAGEMENT IN ROMANIA 343
and other expenses, as well as the equivalent values of services reimbursed by the health insurance funds for ambulatory performed activity (which is to be reported separately from the i rst categories of ex-penditure).
Percentage of personnel costs from total hospital spendings
h e percentage of wages should not exceed, accord-ing to current legislative measures, 60% of total hos-Patients values for surgery indicator
P1 1
P2 0
P3 1
P4 null
P5 null
P6 null
344 I. BARLIBA ET AL.
pital costs. h e data provided for 2006 and 2007 for the three analyzed hospitals were 5.15% for Filiaşi Hospital, 12.86% for Rovinari Hospital and 1.83% in 2007 for Şegarcea Hospital higher compared to 2006 (Fig. 9).
Percentage of drugs expenditures from the total hospi-tal spendings
h e indicator is calculated as the percentage ratio be-tween drug spendings and total hospital spendings. In this case, the situation is dif erent for the three hos-pitals. As can be seen in Fig. 10, drug expenditures at Filiaşi Hospital decreased in 2007 compared to 2006 by approximately 4.5%. At Şegarcea and Rovinari Hospitals, an increase in expenditure on medicines was registered from one year to another, by about 3% in the i rst case and 4.18% in the second.
Average daily cost of hospitalization
h e data provided by the three hospitals regarding the average cost of hospitalization highlighted an in-crease in approximately 30 monetary units for Filiaşi Hospital, 3 monetary units for Rovinari Hospital, and 4.58 for Şegarcea Hospital (Fig. 11).
Index of concordance between diagnosis code at admission and at discharge
h is indicator represents the sum of patients for whom the diagnosis at admission was consistent with the primary discharge diagnosis (the diagnosis at admission and the primary discharge diagnosis are found in one of the blocks on the “List of diagnostic blocks” or “Exceptions list for diagnoses admission/ discharge considered concordant, although the
di-Fig. 9. h e percentage of the hospital personnel costs from the hospital total spendings.
IMPORTANT BIOINDICATORS FOR HEALTH MANAGEMENT IN ROMANIA 345
agnoses do not i t in the same block”). It is calcu-lated as the percentage ratio between the number of consistent diagnoses and the number of discharged patients.
h e concordance between diagnosis at admission and diagnosis at discharge in 2007, compared to 2006, decreased for Filiaşi Hospital, while for Şegarcea and Rovinari Hospital the situation was reversed. One of the reasons may be that doctors in Filiaşi face more complex cases and the state of health of the people in the area is worse (Fig. 12).
DISCUSSION AND CONCLUSION
h e hospital managerial performance implies the taking on of roles and responsibilities; this is a con-tinuous process that should rely on human resources development, the most precious resource in a hos-pital, to achieve the expectations of those who use
health services and their satisfaction, as well as on active involvement, accurate knowledge, and good communication with collaborators (e.g. physicians, heads of clinical departments, coordinators of health programs) (Witter et al., 2000).
Our investigations presented here coni rmed that hospital management performance accurately refl ects the general hospital performance and that improving management ei ciency is essential for better results.
h e performance criteria underlying the evalua-tion of hospital managers contain an objective com-ponent, which we acknowledge here as one of its most important dei ning assets. Although these concepts are in their infancy and the evaluation system is lack-ing in some regards (Champangne et al., 2005), we ap-preciate their manner of conception as certain human resource indicators and the fuli llment of the degree
Fig. 11. h e average daily cost of hospitalization.
346 I. BARLIBA ET AL.
of achievement would require a certain independence of the manager in terms of human resources policy. At this point, hiring or restricting the number of em-ployees is strictly regulated and decided by Health Ministry regulations (Radu et al., 2005). In addition, in the category of economic and inancial indicators, budget execution against approved budget is a major risk factor, since funding is, in some cases, below the approved budget. Moreover, quality indicators should also be reviewed, since there are indicators, such as in-hospital mortality rate, that cannot be assumed.
REFERENCES
Khaliq, A.A., Walston, S.L. and D.M. hompson (2007). Is chief executive oicer turnover good for the hospital? Health Care Manag (Frederick)26, 341-346.
Mihaila, V. (2006).Diferenţe în metodologia de calcul a unor in-dicatori de evaluare a sănătăţii populaţiei. Management în sănătate4.
Pineault, R. and C.Daveluy (1995). La planiication de la sante: concepts, methodes, strategies. Editions Nouvelles.
Radu, P. and S.Haraga(2005). L ‘allocation de resources du sys-teme d’assurance maladie en Roumanie- le pacient est le vrais beneicier ? ALASS, Montreal1, 17-20.
Roberts, M.J. (2006). Advanced Flagship Course on Eiciency, Quality and Health Systems. Health Services Management Training Center Semmelweis University.