Edna Maria de AraújoI
Maria da Conceição N CostaII Vijaya K HoganIII
Eduardo Luiz Andrade MotaII
Nelson Fernandes OliveiraI
Tânia Maria de AraujoI
I Núcleo de Epidemiologia. Universidade
Estadual de Feira de Santana. Feira de Santana, BA, Brasil
II Instituto de Saúde Coletiva. Universidade
Federal da Bahia. Salvador, BA, Brasil
III School of Public Health. University of North
Carolina at Chapel Hill. Chapel Hill, NC, USA
Correspondence: Edna Maria de Araújo
Av. Transnordestina s/n; km 03 BR 116 Campus Universitário
44031-460 Feira de Santana, BA, Brasil E-mail: [email protected] Received: 10/24/2007 Revised: 08/05/2008 Approved: 10/14/2008
Race/skin color differentials in
potential years of life lost due
to external causes
ABSTRACT
OBJECTIVE: Deaths by external causes represent one of the most important challenges for public health and are the second cause of death in Brazil. The aim of this study was to analyze differentials in mortality by external causes according to race/skin color.
METHODS: A descriptive study was carried out in Salvador, Northeastern Brazil, using 9,626 cases of deaths by external causes between 1998 and 2003. Data were obtained from the Forensic Medicine Institute and from Instituto Brasileiro de Geografi a e Estatística (Brazilian Institute of Geography and Statistics). The indicator “potential years of life lost” was utilized to identify the existence of differences among age groups, sex groups and race/skin color groups.
RESULTS: Deaths by external causes provoked the loss of 339,220 potential years of life, of which 210,000 were due to homicides. Nonwhite individuals died at earlier ages and lost 12.2 times as much potential years of life due to deaths by homicidies than white individuals. Although the nonwhite (black and mixed) population was three times larger than the white population, its number of potential years of life lost was 30 times higher. The population of blacks was 11.4 % smaller than the white population, but its loss of potential years of life was almost three times higher. Even after the adjustment for age, the differences observed in the indicator potential years of life lost/100,000 inhabitants and in the ratios between strata according to race/skin color were maintained.
CONCLUSIONS: The results showed differentials in mortality by external causes according to race/skin color in Salvador. The nonwhite population had greater loss of potential years of life, higher average number of years not lived and, on average, they died at an earlier age due to homicides, traffi c accidents an all other external causes.
DESCRIPTORS: External Causes. Mortality. Potential Years of Life Lost. Ethnic Group and Health. Health Inequalities. Social Inequity. Brazil. Race/Skin color.
INTRODUCTION
2 Race/skin color differentials due to external causes Araújo EM et al
The reduction in the number of deaths by external causes represents a great challenge both in developed and in developing countries. In Russia, for example, the external causes rank second among the main causes of death, mainly suicides, followed by homicides, ac-cidental poisoning by alcohol and traffi c accidents.8 In Alaska, the external causes represent 40% of overall mortality.7 In the 1990s, in the United States, homicides were responsible for more potential years of life lost than all the accidents, cancers and cardiovascular dis-eases among young and black men and among black women below 44 years of age.19
In Brazil, mortality by external causes is the second among the main causes of death. However, when they are evaluated in potential years of life lost, they rank fi rst.13 Especially in large urban centers, the external causes affect predominantly black youths aged between 15 and 49 years, when they are in the phase of repro-ductive life and high economic production.a According to Waiselfi sz21 (2007), the homicide rate of the black population in Brazil in 2004 was much higher than that of the white population. The rate of death by homicide of the black population was 1.731 times higher than that of the white population, which represented 73.1% more victimization due to this cause in the black population. Nevertheless, mortality studies that approach the role of race/skin color are scarce in Brazil.
Several authors have used the indicator “potential years of life lost” (PYLL) because of its capacity to discrimi-nate the magnitude, vulnerability and transcendence of causes of death. Among the Brazilian studies, Re-ichenheim & Werneck17 (1994) used PYLL when they studied the external causes in the municipality and state of Rio de Janeiro, and Arnold et al1 (1997) determined the PYLL by homicide among children and adolescents in Recife (state of Pernambuco). However, the race/skin color variable was not assessed in these studies.
As it expresses the effect of deaths occurred prema-turely in relation to the life expectancy that is expected of a certain population, PYLL can be considered a valuable tool to assess the relative importance of diseases and events that culminate in premature death and also as a parameter to assess social inequalities in health. 9,10,19,22
Investigations focusing on the analysis of health in-equalities according to race/skin color are also rare. Nevertheless, studies of mortality by external causes in Brazil have shown greater victimization among the black population.2,5 Although the deaths by external causes occur predominantly in the adolescent popula-tion and in individuals who are in the beginning of adult life, which would already justify their relevance as a
a Programa das Nações Unidas para o Desenvolvimento. Relatório de desenvolvimento humano: racismo, pobreza e violência 2005
[internet]. [cited 2006 Oct 16]. Available from: http://www.pnud.org.br/rdh
public health problem, and despite the broad use of the PYLL indicator in the international literature,4,10,12 few studies in Brazil have used it to measure differentials in mortality by external causes, and no studies have ac-complished this taking race/skin color into account.
The objective of the present study was to analyze the differentials in mortality by external causes according to race/skin color.
METHODS
PYLL values were compared between groups of indi-viduals classifi ed according to race/skin color (black, mixed, white) residing in Salvador, state of Bahia, who died due to external causes in the period from 1998 to 2003. Blacks and mixed-ethnicity individuals were assessed together, being called nonwhite popula-tion, and separately. This categorization would allow us to identify the existence, or not, of a gradient that indicates worse results as the skin color darkens. In-dividuals of yellow skin color or indigenous ethnicity were excluded due to the low number of occurrences in these groups.
Sociodemographic data were obtained from Instituto Brasileiro de Geografi a e Estatística (IBGE – Brazil-ian Institute of Geography and Statistics) and data about 9,626 deaths were collected from the database of Instituto Médico Legal (IML – Forensic Medicine Institute) of the Government of the State of Bahia. Data about the deaths included reference to police reports, postmortem reports and other complementary docu-ments when the cause of death was not specifi ed on the death certifi cate.
The analyzed variables were: sex, age group, race/skin color, according to types of deaths by external causes: homicide (X85-Y09); deaths caused by traffi c accident (V01-V99) and total number of deaths by external causes, classifi ed according to ICD-10.15 Deaths coded Y10 to Y36 (those whose intent was undetermined, legal interventions and operations of war) were not analyzed separately (they were included in the set of deaths by all external causes).
Communication Management of the state of Bahia) which, in turn, includes this information in Sistema de Informação de Mortalidade (Mortality Informa-tion System) of Ministério da Saúde (MS - Ministry of Health). Comparing the total number of deaths by external causes of individuals residing in Salvador provided by the IML with the information supplied by MS/Datasus, a percentage below 8% was observed for the former (IML).
In the data analysis, the following indicators were employed: absolute and average number of PYLL, percentage distribution of PYLL, age in which, on average, the deaths occurred, and the number of PYLL per 100,000 inhabitants, specifi ed according to type of external cause of death, sex, age group and race/skin color (gross and age-adjusted estimates; we adopted the direct method and the population of Salvador in the year 2000 as the standard). The PYLL per 100,000 inhabit-ants corresponded to the accumulated coeffi cients for 1998 to 2003, and the population of the middle of the period was the mean of the populations of the years 2000 and 2001, used as denominator. To each type of external cause, the ratio between PYLL/100,000 inhabitants was calculated, adjusted for the age group, considering the white race/skin color population as the reference group. To this indicator, the confi dence interval was estimated at 95%, according to Dever’s method6 (1988).
The absolute value of PYLL in each age group was cal-culated by multiplying the number of remaining years of life by the number of deaths occurred in the same age group. The total value of PYLL was obtained by the summation of the PYLL in each age group by applying the formula: PYLL = ∑ ai x di, where: ai represents the difference between the limit age and the middle point of each age group, based on the presupposition that the deaths that occurred in each group have a uniform distribution; di refers to the number of deaths due to a specifi c cause in this same age group.18 In the present study, 0 (zero) and 70 years of age were stipulated, respectively, as the upper and lower limits for the cal-culation of the PYLL.
For the calculation of the average number of PYLL, which expresses the amount of years that, on average, each death by a certain cause subtracted from a person (non-lived years), the number of PYLL related to each type of external cause was divided by the number of deaths occurred due to this same type of cause. The age at which, on average, the death occurred was obtained by subtracting the average number of non-lived years due to a certain external cause from the maximum stipulated age (70 years).11,16 For reasons of greater operational practicalness and because the data do not differ from those obtained directly, it was decided to calculate the age at which, on average, the deaths occurred according to the formula used by Peixoto & Souza (1999).16
The research project was approved by the Research Ethics Committee of the Public Health Institute of
Universidade Federal da Bahia (029-04 CEP-ISC/ UFBA).
RESULTS
Of the overall number of 9,626 deaths by external causes included in the study, 4.8% did not present in-formation on race/skin color and 1.7% did not record the type of cause that led to the death.
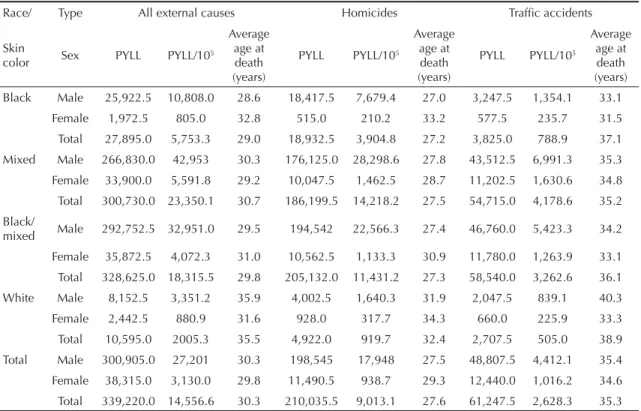
These deaths represented the loss of 339,220 potential years of life, or 14,507/100,000 inhabitants residing in Salvador in the period. Among all the analyzed race/ skin color segments, the greatest losses of potential years of life occurred among male individuals and among those who had mixed and black race/skin color. Analyzed separately, the mixed individuals of both sexes presented the highest values of PYLL/100,000 inhabitants, followed by those of black race/skin color of the male sex.
The average number of PYLL determined by deaths caused by homicide was higher than that caused by traffi c accidents. The age in which, on average, the individuals died due to homicide (27.6 years) was lower than that of the people who died due to traffi c accident (35.3 years) and due to all external causes (30.3 years). Homicides also determined the occur-rence of more premature deaths than the other types of external causes.
Premature deaths were more frequent among nonwhite individuals than among white ones, for all types of external causes. Analyzing the deaths by all external causes together and separately by homicide, men died more prematurely than women. As for traffi c accidents, the women died at an earlier age, especially black women (Table 1).
It was observed that 62.0% of the potential years of life lost were due to homicides, 18.0% to traffi c accidents and 20.0% to the other external causes. The age groups from 15 to 49 years presented the highest proportions of PYLL.
4 Race/skin color differentials due to external causes Araújo EM et al
DISCUSSION
The results of the present study show that there are differentials in mortality by external causes according to race/skin color in Salvador. Nonwhites had greater loss of potential years of life, greater average number of non-lived years and died, on average, at earlier ages due to homicides, traffi c accidents and other external causes.
One of the main limitations of the study is the utiliza-tion of different criteria to classify race/skin color: regarding the death certifi cates, it was classifi ed by legal experts; regarding the population – used as de-nominator to calculate the indicators –, IBGE adopts the self-classifi cation criterion. In addition, it is possible that, in a lower proportion, like the census takers,20 the medical examiners tend to classify people’s race/skin color considering their social and economic level, either because of their world views, value judgments or even due to social pressures.
Another problem may have derived from the fact that some death certifi cates were incorrectly fi lled in under the circumstances of the accident or violence that pro-duced the fatal lesion. However, this issue may have been minimized when these data were complemented
by other sources. Although it is possible that some deaths due to external causes were not registered due to the concealment of corpses, the nonwhites possibly were also the most affected by the lack of register, independently of this situation.
On the other hand, despite the mentioned limitations, the fi ndings of the present study indicate a visible gradi-ent in the loss of potgradi-ential years of life due to external causes among whites and nonwhites, represented by a linear growth towards the latter in all forms of presenta-tion of the PYLL indicator.
In spite of the fact that the race/skin color variable also represents an approximation in terms of socio-economic level, we have not included another variable of social stratifi cation to avoid possible biases in the analysis. The contribution of socioeconomic factors to the differentials that were found is important, since approximately 75% of the population of Salvador is composed of nonwhites, who also present lower income and schooling levels. Nevertheless, as this situation of the nonwhites being poorer is possibly related to racism and discrimination, it can be stated that these factors add to the determination of disadvantages also in the mortality by external causes of this population. Table 1. Potential years of life lost due to external causes according to race/skin color, sex and type of external cause. City of Salvador, Northeastern Brazil, 1998-2003.
Race/ Type All external causes Homicides Traffi c accidents
Skin
color Sex PYLL PYLL/105
Average age at death (years)
PYLL PYLL/105
Average age at death (years)
PYLL PYLL/105
Average age at death (years)
Black Male 25,922.5 10,808.0 28.6 18,417.5 7,679.4 27.0 3,247.5 1,354.1 33.1
Female 1,972.5 805.0 32.8 515.0 210.2 33.2 577.5 235.7 31.5
Total 27,895.0 5,753.3 29.0 18,932.5 3,904.8 27.2 3,825.0 788.9 37.1
Mixed Male 266,830.0 42,953 30.3 176,125.0 28,298.6 27.8 43,512.5 6,991.3 35.3
Female 33,900.0 5,591.8 29.2 10,047.5 1,462.5 28.7 11,202.5 1,630.6 34.8
Total 300,730.0 23,350.1 30.7 186,199.5 14,218.2 27.5 54,715.0 4,178.6 35.2
Black/
mixed Male 292,752.5 32,951.0 29.5 194,542 22,566.3 27.4 46,760.0 5,423.3 34.2
Female 35,872.5 4,072.3 31.0 10,562.5 1,133.3 30.9 11,780.0 1,263.9 33.1
Total 328,625.0 18,315.5 29.8 205,132.0 11,431.2 27.3 58,540.0 3,262.6 36.1
White Male 8,152.5 3,351.2 35.9 4,002.5 1,640.3 31.9 2,047.5 839.1 40.3
Female 2,442.5 880.9 31.6 928.0 317.7 34.3 660.0 225.9 33.3
Total 10,595.0 2005.3 35.5 4,922.0 919.7 32.4 2,707.5 505.0 38.9
Total Male 300,905.0 27,201 30.3 198,545 17,948 27.5 48,807.5 4,412.1 35.4
Female 38,315.0 3,130.0 29.8 11,490.5 938.7 29.3 12,440.0 1,016.2 34.6
Total 339,220.0 14,556.6 30.3 210,035.5 9,013.1 27.6 61,247.5 2,628.3 35.3
5
Type
Male Female Total
Race/skin
color PYLL/105
Ratio
PYLL/105 95% CI Race/skin color PYLL/105
Ratio
PYLL/105 95% CI
Race/skin
color PYLL/105
Ratio
PYLL/105 95% CI
Homicide
Mixed 28347.7 17.3 16.76;
17.84 Mixed 1420.16 4.5 4.20; 4.80 Mixed 14001.2 15.5
15.01; 15.99
Black 7027.56 4.3 4.15;
4.45 Black 190.34 0.6 0.54; 0.66 Black 3560.98 3.9
3.77; 4.03
Black/
mixed 19941.8 12.2
11111.82;
12. 58 Black/mixed 1140.79 3.6 3.36; 3.84 Black/mixed 11027.4 12.2
11.82; 12.58
White 1633.92 1 White 313.142 1 White 905.437 1
Traffi c accidents
Mixed 7005.47 8.5 8.12;
8.88 Mixed 1582.85 6.9 6.36; 7.44 Mixed 4098.97 8.3
7.93; 8.67
Black 1277.78 1.5 0.95;
4.13 Black 220.921 1 0.89; 1.11 Black 743.774 1.5
0.95; 4.13
Black/
mixed 5328.48 6.5
6.21;
6.79 Black/mixed 1285.71 5.6 5.16; 6.04 Black/mixed 3163.81 6.4
6.12; 6.68
White 819.572 1 White 230.588 1 White 491.879 1
Other external causes
Mixed 7504.86 8.8 8.36;
9.24 Mixed 1879.67 5.7 5.28; 6.12 Mixed 4516.81 8.0
7.60; 8.40
Black 1689.87 2.0 1.88;
22.12 Black 355.303 1.1 0.99; 1.21 Black 1018.34 1.8
1.69; 1.91
Black/
mixed 5845.19 6.9
6.55;
7.25 Black/mixed 1188.53 3.6 3.33; 3.87 Black/mixed 3407.33 6.0
5.70; 6.30
White 851.339 1 White 327.681 1 White 565.496 1
All external causes
Mixed 42858 13 11.88;
14.12 Mixed 5428.15 6.2 5.37; 7.03 Mixed 22896 11.7
10.69; 12.71
Black 9995.22 3.0 2.63;
3.37 Black 766.56 0.9 0.73; 1.07 Black 5323.1 2.7
2.37; 3.03
Black/
mixed 32172.8 9.7
8.86;
10.54 Black/mixed 2.289.6 2.63 2.58; 2.98 Black/mixed 17279 8.8
8.04; 9.56
White 3304.83 1 White 871.411 1 White 1962.81 1
6 Race/skin color differentials due to external causes Araújo EM et al
As the largest portion of the population of Salvador is composed of nonwhite individuals, the number of potential years that are lost due to this group of causes for this population would also be higher. However, it is observed that although the nonwhite population of this municipality is only three times larger than the white population, the number of years of life lost by the former was more than 30 times higher. Besides, com-pared to the whites, the population of blacks – 11.4% smaller - lost more than twice (2.6 times) the number of potential years of life.
These differentials were maintained when the PYLL was calculated to every 100,000 individuals of the respective race/skin color, which supports the hypoth-esis of the existence of some degree of social inequal-ity in the determination of deaths by external causes, mainly because the nonwhites constitute the portion of the population that has the most unfavorable socio-economic level. The differentials according to race/skin color that were observed in this study, represented by the PYLL due to deaths by external causes, were also found in studies conducted in other fi elds of knowledge, like work and education, in which a gradient of worse social situation was observed for black and mixed individuals, respectively.
Consistently with the specifi c literature, the present study found that men presented a greater loss of po-tential years of life due to external causes, as well as individuals belonging to the age group between 15 and 49 years – particularly 20 - 49 years -, which suggests a greater exposure of this population group. However, it was noted that white women died at an earlier age than black and mixed women, respectively, when the cause of death was homicide. There were no differences when the cause of death was traffi c accidents. These results placed white women in a position of vulnerability that is similar to the nonwhite women with regard to the loss of potential years of life due to deaths by external causes. Nevertheless, this fi nding may refl ect a better register of white women’s deaths.
Although the nature of the study of PYLL and the measures deriving from it is descriptive rather than being connected with risk measurement, this indicator is a valuable tool to identify differentials in the health area, especially regarding deaths by external causes. The reason is that the majority of deaths by this cause occurred from the age of 15 onwards, contributing to minimize one of the limits of this indicator (underes-timation of children’s deaths), which, in turn, would affect the PYLL profi le.17
These fi ndings ratify the few Brazilian studies on social inequalities that approach race/skin color in which worse health results are presented to the nonwhite population,2,5
not to mention several other international studies.4,10,22
The approach to health differentials deriving from so-cial inequalities according to race/skin color requires, at least, a brief discussion of the theories of racial relations in Brazil. They explain, to some extent, the historical and social construction that led to an evident division of the Brazilian society into population sub-groups, characterized, for example, by the lack of equity in the fulfi llment of social rights. Generally speaking, this process has been occurring through the maintenance of the position of advantage and domination – trans-lated as the condition of citizenship and better quality of life – for one portion of the population and by the maintenance of the position of disadvantage and sub-ordination for the other.a
However, although it supports the idea of “social democracy” and despite the fact that it has the largest population of African descendants in the Diaspora, Brazil was the last country to abolish slavery and only from the last decade onwards has it begun to recognize the existence of racism.
The creation of Departments for Affi rmative Actions, in the federal, state and municipal governments, for African descendants and the implementation of the system of quotas to foster the inclusion of black students in the universities are some of the recent benchmarks for the national recognition of the existence of social differences among segments according to the race/skin color of the population. According to Carvalho3 (2003), in Brazil only 2% of the university students are black, only 1% of the black population are teachers, while 50% of this population are illiterate.
This investigation reveals differentials in mortality ac-cording to race/skin color. However, discussing these differences represents facing a “taboo” in a society that views itself as a “racial democracy” but, on the other hand, has social indicators that show the existence of distinctions in treatment among its segments according to race/skin color.
While in the social sciences there are many studies on racial relations in Brazil, in the public health area there seems to be a tension that has hindered the incorporation of this theme. Therefore, despite the descriptive nature and all the limitations of the present study, its results point to the existence of differentials in mortality by ex-ternal causes that cannot be ignored in the planning and programming of actions to overcome social inequalities in the health area. It is necessary that these differentials are further investigated by means of the development of more robust study designs that have greater power of analysis, in order to produce information that can strongly support the above-mentioned actions.
a Programa das Nações Unidas para o Desenvolvimento. Relatório de desenvolvimento humano: racismo, pobreza e violência 2005
1. Arnold MW, Falbo Neto GH, Figueroa JN. Years of potential life lost by children and adolescent victims of homicide, Recife, 1997. J Trop Pediatr. 2002;48(2):67-71. DOI: 10.1093/tropej/48.2.67
2. Batista LE, Escuder MML, Pereira JCR. A cor da morte: causas de óbito segundo as características de raça no Estado de São Paulo, 1999 a 2001. Rev Saude
Publica. 2004;38(5):630-6. DOI:
10.1590/S0034-89102004000500003
3. Carvalho JJ. Inclusão étnica e racial no Brasil. A questão das cotas no ensino superior. São Paulo: Attar; 2005.
4. Centers for Disease Control and Prevention (CDC). Suicide among Hispanics- United States 1997-2001.
MMWR Morb Mortal Wkly Rep. 2004;53(22):478-81.
5. Cunha EMGP. Raça: aspecto de iniqüidade
esquecido no Brasil? In: Barata RB. Equidade e saúde: contribuições da epidemiologia. Rio de Janeiro: Fiocruz; 2001. p. 219-34.
6. Dever, GEA. A epidemiologia na administração dos serviços de saúde. São Paulo: Ed. Pioneira; 1988.
7. Froelicher J. Violent death in Alaska. In: Alaska Science Forum, 1977 [internet]. Fairbanks: Geophysical Institute, The University of Alaska; 1977 [citado 2009 fev 2]. Disponível em: http://www.gi.alaska.edu/ ScienceForum/ASF1/181.html
8. Gavrilova NS, Semyonova VG, Evdokushkina GN, Gavrilova LA. The response of violent mortality to economic crisis in Russia. Popul Res Policy Rev. 2000;19(5):397-419. DOI: 10.1023/A:1010621601409
9. Johansen JD, Smith E, Juel K, Rosdahl N. The Aids epidemic in the city Of Copenhagen, Denmark: potential years of life lost and impact on life expectancy. Scand J Public Health. 2005;33(3):222-7. DOI: 10.1080/14034940510005671
10. Lam LT. Different quantitative measures of the impact of premature deaths on the community. Aust N Z
J Public Health. 2004;28(6):555-8. DOI: 10.1111/
j.1467-842X.2004.tb00046.x
11. Laurenti R, Mello Jorge MHP, Lebrão ML, Gotlieb SLD. Estatísticas de saúde. São Paulo: Editora Pedagógica Universitária; 1987.
12. Liu J, Xiong Q, Liang JZ, Qian P, Wang XY, Pan JP. Analysis on the potential losses of maternal mortality in Sichuan province in 2003. Zhonghua Fu Chan Ke Za Zhi. 2005;40(4):246-8.
13. Mello Jorge MHP, Gawryszewski VP, Latorre MRDO. Análise dos dados de mortalidade. Rev Saude Publica. 1997;31(4 Supl):5-25.
14. Organização Mundial da Saúde. Relatório mundial sobre violência e saúde. Genebra; 2002.
15. Organização Panamericana da Saúde. CID – 10ª Revisão. Classifi cação estatística internacional de doenças e causas de morte. São Paulo: EDUSP; 1996. p.1012-130.
16. Peixoto HCG, Souza ML. O indicador anos potenciais de vida perdidos e a ordenação das causas de morte em Santa Catarina, 1995. Inf Epidemiol SUS. 1999;8(1):17-25.
17. Reichenheim ME, Werneck GL. Anos potenciais de vida perdidos no Rio de Janeiro, 1990. As mortes violentas em questão. Cad Saude Publica. 1994;10:(Supl 1):188-98. DOI: 10.1590/S0102-311X1994000500014
18. Romeder JM, McWhinnie JR. Potential year of life lost between ages 1 and 70: an indicator of premature mortality for health planning. Int J Epidemiol. 1977;6(2):143-51. DOI: 10.1093/ije/6.2.143
19. Stark E. Rethinking homicide: violence, race and the politics of gender. Int J Health Serv. 1990;20(1):3-26. DOI: 10.2190/2TN0-DAFW-8CPG-8VE5
20. Telles E, Lim N. Does it matter who answers the race question? Racial classifi cation and income inequality in Brazil. Demography. 1998;35(4):465-74. DOI: 10.2307/3004014
21. Waiselfi sz JJ. Mapa das mortes por violência. Estud Av. 2007;21(61):119-138.
22. Wong MD, Tagawa T, Hsieh HJ, Shapiro MF, Boscardin WJ, Ettner SL. Differences in cause-specifi c mortality between Latino and white adults.
Med Care. 2005;43(10):1058-62. DOI: 10.1097/01.
mlr.0000178196.14532.40
REFERENCES
Article based on the doctoral dissertation authored by EM Araújo, submitted to the Public Health Institute of Universidade
Federal da Bahia in 2007.