In vivo
Conditions Induce Faithful Encoding of Stimuli by
Reducing Nonlinear Synchronization in Vestibular
Sensory Neurons
Adam D. Schneider1, Kathleen E. Cullen2, Maurice J. Chacron1,2*
1Department of Physics, McGill University, Montreal, Quebec, Canada,2Department of Physiology, McGill University, Montreal, Quebec, Canada
Abstract
Previous studies have shown that neurons within the vestibular nuclei (VN) can faithfully encode the time course of sensory input through changes in firing ratein vivo. However, studies performedin vitrohave shown that these same VN
neurons often display nonlinear synchronization (i.e. phase locking) in their spiking activity to the local maxima of sensory input, thereby severely limiting their capacity for faithful encoding of said input through changes in firing rate. We investigated this apparent discrepancy by studying the effects ofin vivoconditions on VN neuron activityin vitro
using a simple, physiologically based, model of cellular dynamics. We found that membrane potential oscillations were evoked both in response to step and zap current injection for a wide range of channel conductance values. These oscillations gave rise to a resonance in the spiking activity that causes synchronization to sinusoidal current injection at frequencies below 25 Hz. We hypothesized that the apparent discrepancy between VN response dynamics measured in
in vitroconditions (i.e., consistent with our modeling results) and the dynamics measuredin vivo conditions could be
explained by an increase in trial-to-trial variability underin vivovs.in vitroconditions. Accordingly, we mimicked more
physiologically realistic conditions in our model by introducing a noise current to match the levels of resting discharge variability seenin vivoas quantified by the coefficient of variation (CV). While low noise intensities corresponding to CV
values in the range 0.04–0.24 only eliminated synchronization for low (,8 Hz) frequency stimulation but not high (.12 Hz) frequency stimulation, higher noise intensities corresponding to CV values in the range 0.5–0.7 almost completely eliminated synchronization for all frequencies. Our results thus predict that, under natural (i.e. in vivo)
conditions, the vestibular system uses increased variability to promote fidelity of encoding by single neurons. This prediction can be tested experimentallyin vitro.
Citation:Schneider AD, Cullen KE, Chacron MJ (2011)In vivoConditions Induce Faithful Encoding of Stimuli by Reducing Nonlinear Synchronization in Vestibular Sensory Neurons. PLoS Comput Biol 7(7): e1002120. doi:10.1371/journal.pcbi.1002120
Editor:Boris S. Gutkin, E´cole Normale Supe´rieure, College de France, CNRS, France
ReceivedDecember 22, 2010;AcceptedMay 26, 2011;PublishedJuly 21, 2011
Copyright:ß2011 Schneider et al. This is an open-access article distributed under the terms of the Creative Commons Attribution License, which permits unrestricted use, distribution, and reproduction in any medium, provided the original author and source are credited.
Funding:This research was funded by FQRNT (ADS, KEC, MJC), CIHR (KEC, MJC), CFI (MJC), and CRC (MJC). The funders had no role in study design, data collection and analysis, decision to publish, or preparation of the manuscript.
Competing Interests:The authors have declared that no competing interests exist. * E-mail: [email protected]
Introduction
The vestibular system provides information about head motion relative to space that is necessary for maintaining posture, computing spatial orientation, and perceiving self-motion. Periph-eral vestibular afferents encode the detailed time course of either horizontal rotations, vertical rotations, or linear acceleration through changes in their firing rates and spike timing [1–4]. These afferents project unto neurons within the vestibular nuclei (VN) [5–7]. In vitrostudies have established that VN neurons in
mammals are classified into two main subpopulations (type A and type B) that differ in their responses to current input as well as action potential shape [8–11]. In response to depolarizing current steps, type A neurons show a sustained tonic response while the type B neurons display spike frequency adaptation. Type B neurons moreover display a resonance at frequencies within the behaviorally relevant range that increases the tendency of small amplitude, high-frequency synaptic inputs to trigger non-linear firing behavior in the form of synchronization to the peaks of the input [12,13]. This synchronization severely limits the range of input frequencies and amplitudes for which the activity of type B
neurons accurately follows the input [13–15]. In contrast, type A neurons, despite also displaying a resonance, tend to follow the time course of current injection accurately for a much wider range of stimulus amplitudes [12,13].
In contrast, the results ofin vivoexperiments have shown that the
firing of many VN neurons accurately follows the time course of sensory stimulation over the behaviorally relevant frequency range (0–20 Hz) [16,17]. While this result is at odds with those ofin vitro
studies, it is consistent with the fact that eye movement produced by the vestibuloocular reflex (VOR), which is largely driven by the activities of VN neurons, has a very short latency and is accurate over this same frequency range [18,19]. How can the same neurons display nonlinear responses such as synchronizationin vitroand yet accurately follow the time course of sensory input in vivo? The
discrepancy can be dramatic. For example, Floccular target neurons (FTNs) have been shown to correspond to a subpopulation of type B VN neurons [20,21] that display the strongest tendency for nonlinear synchronizationin vitro, yet do not display such synchronization in
response to sensory inputin vivo[16].
can be explained by an increase in trial-to-trial variability underin vivo vs. in vitro conditions. To do so, we used a simplified
biophysical model that has been previously used to describe VN neuron activity in vitro [14]. We show that this model displays
membrane potential oscillations that give rise to a resonance in the membrane potential response. This resonance is transferred to the spiking response and causes nonlinear synchronization to sinusoidal current injections over a wide range of frequencies (0– 20 Hz). We then mimicked the high-conductance state that is
typical of in vivo conditions in our model by increasing the
membrane conductance. Moreover, we mimicked their large resting discharge rates by increasing the bias current. Interestingly, both of these changes in parameter values were not sufficient to remove this synchronization that thus severely limits the range of inputs for which our model’s response follows the input accurately. However, we show that adding noise to our model in order to mimic the resting discharge variability displayed by VN neuronsin vivo can be sufficient to eliminate synchronization over the full
range of behaviorally relevant frequencies.
Results
Our biophysical model is based on the Hodgkin-Huxley formalism and consists of a single compartment endowed with several membrane conductances (see Methods and Figure 1). Note that a full biophysical justification of the model can be found elsewhere [12,14]. Although previous studies have shown that this model could display a resonance in its spiking response to sinusoidal current injections [14], they have not systematically explored its dependence on different parameters as well as the interactions between different membrane conductances that underlies its generation.
As it has been previously shown that resonances in the spiking response could be caused by resonances in the membrane potential [22], we first investigated the models capacity to display membrane potential oscillations in response to current input. To do so, we first turned off the spiking sodium and rectifier potassium conductances by setting their maximum conductances values to zero (i.e. ggNa~ggK~0mS=cm2). We note that this approach is
valid for the parameter values used here (see Methods).
Intrinsic membrane conductances give rise to damped membrane potential oscillations in the presence of perturbations
It is well known that damped or sustained membrane potential oscillations can arise from the interplay between several mem-brane conductances including voltage gated calcium channels [23]. The magnitude of these oscillations is furthermore strongly dependent on the amount of depolarizing current bias [22]. As such, we varied both the maximum calcium conductanceggCaand
the bias currentIbiasin our model. We first studied the membrane
potential response to step current injections as these have been previously used to demonstrate the presence of membrane potential oscillations [23].
Our results show that the model can display damped membrane potential oscillations with different magnitudes and frequencies for a wide range of Ibias and ggCa values (Figures 2A,B,C). We
characterized this dependency by systematically varying bothIbias
andggCaover a wide range of values and quantified the amplitude
of these damped oscillations by computing an oscillation index (see Methods). Further, we computed the oscillation frequency from the squared magnitude of the Fourier transform of the response (see Methods). Our results show that, for a given value of the maximum calcium conductanceggCa, the oscillation index displays
a maximum as a function of the bias currentIbias(Figure 2D). The
oscillation frequency displayed qualitatively similar behavior to that of the oscillation index (Figure 2E). We note that the oscillation frequency was mostly within the behaviorally relevant range found in natural vestibular stimuli (0–20 Hz) [24]. This indicates that the model can display calcium induced damped membrane potential oscillations, the magnitude and frequency of which are highly dependent on the level of depolarizing bias current Ibias. We note that qualitatively similar results were
obtained when varying the persistent sodium conductance ggNaP
(Figure S1). The results agree with the known effects of persistent sodium, namely to depolarize the membrane and amplify the resonant behavior [23].
It is well known that neurons receive massive synaptic
bombardment under in vivo conditions, which gives rise to a
high-conductance state [25,26]. Mathematically, the increased membrane conductance under such synaptic bombardment can be mimicked by increasing the leak conductance ggleak and by Figure 1. Vestibular anatomy and model description.Schematic of peripheral vestibular system, indicating projections from semi-circular canals to the vestibular nuclei (VN). VN neurons were modeled using the Hodgkin-Huxley formalism with several membrane conduc-tances as shown. Sensory input was mimicked by somatic current injection.
doi:10.1371/journal.pcbi.1002120.g001 Author Summary
The vestibular system senses the motion of the head in space and is vital for gaze stability, posture control, and the computation of spatial orientation during everyday life. The activities of single vestibular neurons recorded in the brains of awake behaving animals show that they can accurately transmit information about the time course of head motion, which is necessary for several behaviors such as the vestibulo-ocular reflex required for gaze stabiliza-tion. In contrast, this is not the case when the same neurons are recorded in isolation and sensory stimulation is mimicked experimentally. We investigated the cause for this discrepancy by studying how a mathematical model of vestibular neuron activity responds to mimics of sensory stimulation under different conditions. We found that the differences in the activities of vestibular neurons recorded in awake behaving animals and in isolation can be explained by the addition of synaptic noise, which in turn, increases the variability of action potential firing that is seen in more natural conditions. Our modeling results make a clear prediction that can be tested experimentally.
adding an appropriate amount of bias current [22,27]. As such, we characterized the oscillation index and frequency as a function of both the leak conductance ggleak and the bias current Ibias.
Although increasing the leak conductance ggleak decreased the
oscillation amplitude, it also decreased the oscillation frequency to values that were contained within the behaviorally relevant frequency range (Figures 3A,B,C). These changes were
further-more seen for a wide range of bias current Ibias values. We
observed that the oscillation index decreased as a function of the leak conductance ggleakfor a given value of Ibias (Figure 3D). In
contrast, the oscillation index displayed a maximum as a function of Ibias for a given value of ggleak (Figure 3D). The oscillation
frequency again displayed qualitatively similar behavior to that of the oscillation index as a function of both ggleak and Ibias and
remained within the behaviorally relevant range (Figure 3E). As such, we conclude that an increased leak conductance is not sufficient to eliminate our models tendency to display membrane potential oscillations. These oscillations could potentially be detrimental to the models ability to accurately encode the timecourse of current injections as their frequency is within the behaviorally relevant range. In order to better understand the source of these oscillations, we performed a standard perturbation analysis in our model around the resting membrane potential (see
Methods). Our results show that the linearized model gave rise to oscillation indices and frequencies that were quantitatively similar to those obtained with the full model (compare Figures 2,3 with Figure S2). Moreover, computing the eigenvalues of the Jacobian matrix of the linearized system revealed that they all had a negative real part. As such, the membrane potential oscillations are unstable as our model has a stable fixed point. This is consistent with the damped oscillations that we observed in response to steps (Figure 2).
Membrane potential oscillations induce a resonance in the spiking activity
We next investigated whether the membrane potential oscilla-tions induced a resonance in the membrane potential response and whether this resonance causes a resonance in the spiking activity. As such, we used a zap stimulus (i.e. a sinusoidal waveform with a constant amplitude and a frequency that increases linearly as a function of time; Figure 4A) as an input to our model. Such inputs are frequently used to characterize resonant behavior [28,29]. Our results show that the model does display a resonance in the membrane potential in response to zap current injection for different values ofggleakandIbias(Figures 4B,C,D). We note that
these responses show asymmetries, which is to be expected since Figure 2. The model displays damped membrane potential oscillations in response to step current input.The model’s membrane potential response to step current input was characterized for a physiologically plausible range of bias current and calcium conductance values. A–C) Example membrane voltage responses and the normalized squared magnitude of their Fourier transforms. These correspond to parameter values as follows: A)Ibias~{0:1nA,ggCa~0:05mS=cm2, B)I
bias~0nA,ggCa~0:125mS=cm2, and C)I
bias~0:25nA,ggCa~0:25mS=cm2. D) Oscillation index (see Methods) measuring the strength of the oscillation in the subthreshold response as a function ofIbiasandggCa. E) The peak frequency component of the squared magnitude of the responsesO˜ Fourier transforms as a function ofIbiasandggCa. The parameter values corresponding to panels A,B,C are also shown. Other parameter values were:ggNaP~0:05mS=cm2,ggKCa~1mS=cm2, ands~0nA.
doi:10.1371/journal.pcbi.1002120.g002
we are using a nonlinear model. We characterized this resonance by an oscillation index that quantifies its magnitude (see Methods) as well as its frequency (i.e. the zap frequency for which the membrane potential oscillation is maximal). Our results show that both the oscillation index and frequency computed from the models response to zap currents had qualitatively similar dependencies on ggleak and Ibias to those of the oscillation index
and frequency computed from the models response to step currents (compare Figures 4E,F to Figures 3D,E, respectively).
How does resonant behavior in the membrane potential relate to resonant behavior in the spiking activity? We investigated this by turning on the spiking conductances (i.e. ggNa~10mS=cm2,
g
gK~2mS=cm2) and by studying the variations in the
instanta-neous firing rate in response to zap current injection. Our model displayed differential resonant behavior in its spiking activity in its response to zap current injection as a function of the leak conductanceggleakand the bias currentIbias (Figures 5A, B,C,D).
We note that these responses also show asymmetries, which is to be expected since we are using a nonlinear model. In general, parameter values that gave rise to resonance in the membrane potential also gave rise to resonance in the spiking activity (compare Figures 4B,C,D with Figures 5B,C,D, respectively). We further characterized the resonance in the spiking activity by an oscillation index that quantifies its magnitude (see Methods) as well as its frequency (i.e. the zap frequency for which the ensuing
variation in the instantaneous firing rate is maximal). Our results show that the oscillation index and frequency computed from the spiking activity had dependencies onggleakandIbias that followed
qualitatively similar trends to those of the oscillation index and frequency computed from the membrane potential (compare Figures 5E,F to Figures 4E,F, respectively). Note, however, that the spiking resonance frequency varied over a wider range than the membrane potential resonance. Importantly, the resonance in the spiking regime persisted over a wide range of parameter values and its frequency overlapped with the behaviorally relevant range.
Increasing variability promotes faithful encoding of the stimulus time course through changes in firing rate
It is expected that the resonance in the spiking activity will lead to nonlinear synchronization of the response with the peaks of the input current that is expected to be detrimental to the faithful encoding of the stimulus time course through changes in firing rate. This synchronization occurs because of the tendency of excitable systems to display n:m phase locking (i.e. fire n spikes per m cycles of forcing) in response to sinusoidal stimuli [30–32]. We thus characterized the models response to sinusoidal current injections that mimicked the waveforms of sinusoidal sensory
stimuli used experimentally in vivo [16,17,19,24,33–36] and
systematically varied the frequency of stimulation between 0 and 25 Hz. Our results show that the model tends to display phase Figure 3. Effects of increased leak conductance on membrane potential oscillations.The model’s membrane potential response to step current input was characterized for physiologically plausible ranges of bias current and leak conductance values. A–C) Example responses and the squared magnitude of their Fourier transforms. These correspond to parameter values as follows: A)Ibias~0:5nA,ggleak~0:3mS=cm2, B)I
bias~0:5nA,
g
gleak~0:5mS=cm2, and C)Ibias~0:1nA,ggleak~0:6mS=cm2. D) Oscillation index as a function ofIbiasandggleak. E) The peak frequency component of squared magnitude of the responses Fourier transform as a function ofIbiasandggleak. The parameter values corresponding to panels A,B,C are also shown. Other parameter values wereggNaP~0:05mS=cm2,ggKCa~1mS=cm2,ggCa~0:25mS=cm2, ands~0nA.
doi:10.1371/journal.pcbi.1002120.g003
locking for high (w12Hz) frequencies (Figures 6A,B,C). We
therefore quantified the models accuracy at encoding the detailed time course of sinusoidal current injections through changes in firing rate by computing the variance accounted for (VAF, see Methods). Our results show that the VAF was high (&1) for a wide
range of Ibias values and stimulus frequencies below 5 Hz
indicating a strong tendency for faithful encoding of the current stimulus time course (Figure 6D). Increasing the baseline firing rate by increasing the bias current widened the range of stimulus frequencies for which our model displayed negligible phase locking and could faithfully encode the detailed time course of sinusoidal input from 0–5 Hz to 0–10 Hz (Figure 6D). However, we observed low VAF values (v0:1) for stimulus frequencies above
10 Hz for a wide range ofIbias values. In order to test whether
these low VAF values corresponded to parameter regimes for which our model displays phase locking, we computed a phase locking index (PLI) (see Methods). As expected, we observed that parameter regimes that gave rise to high VAF also gave rise to low PLI values and vice-versa (compare Figures 6D and 6E). This
strong negative correlation between PLI and VAF for a wide range of Ibias and stimulus frequencies within the natural frequency
range (0–20 Hz) shows that the low VAF values correspond to a strong tendency for phase locking.
Our simulation results are largely contrary to recordings from
VN neurons performed in vivo. Indeed, many VN neurons
accurately follow the time course of vestibular stimuli through changes in firing rate and do not display synchronization or phase locking for frequencies between 0 and 25 Hz [16]. As our modeling results described above were obtained for high values of
g
gleak and were robust to increases in the bias current Ibias, it is
unlikely that the discrepancy between our model results and
experimental recordings from VN neurons in vivo is due to a
change in membrane conductance or the fact that VN neurons might be in a depolarized statein vivo. Thus, while our results show
that increasing the bias current Ibias such that the firing rate
increases to values seenin vivodid increase the range of frequencies for which our model could faithfully encode the time course of sinusoidal input, this alone was not sufficient to eliminate Figure 4. Membrane potential responses to zap current input are greatest for a given frequency.The model’s membrane potential response to zap currents is greatest for a given input frequency. The magnitude of the response and the input frequency for which it occurs vary with bothIbiasandggleak. A) Instantaneous frequency of the zap stimulus frequency as a function of time. B–D) Example membrane voltage responses as a function of time, corresponding to parameter values as follows: B)Ibias~0:05nA,ggleak~0:3mS=cm2, C)I
bias~0:35nA,ggleak~0:3mS=cm2, and D) Ibias~0:35nA,ggleak~0:6mS=cm2. The envelope of each response is fit with a black curve with an arrow marking the peak in the response and the associated instantaneous frequency. E) Oscillation index (see Methods) as a function ofIbiasandggleak. F) Oscillation frequency as a function ofIbiasand
g
gleak. The parameter values corresponding to panels B,C,D are also shown. Other parameters values were ggNaP~0:05mS=cm2 and
g
gNa~ggK~0mS=cm2.
doi:10.1371/journal.pcbi.1002120.g004
nonlinear synchronization for the full range of frequencies found in natural vestibular stimuli (Figures 6D,6E,7A).
Thus, we hypothesized that the increased trial-to-trial variability that is characteristic ofin vivoconditions [25,26] might explain this
discrepancy. It is expected that such variability will limit phase locking by inducing firing at all phases of the input and thus promote the faithful encoding of the stimulus waveform by changes in firing rate (see [37] for review). We thus addressed the specific question of whether the levels of resting discharge
variability displayed by VN neurons in vivo are sufficient to
account for the suppression of nonlinear phase locking, which is observedin vitro, thereby allowing faithful encoding of the stimulus
time course through changes in firing rate.
In order to test this hypothesis, we systematically varied both the
bias current Ibias as well as the noise intensity within the
experimentally observed ranges of baseline firing rates
(Figure 7A) and resting discharge variability as quantified by the coefficient of variation (CV) (Figure 7B), respectively. We note that
previous studies have shown that VN neurons displayed values of CV in their resting discharge ranging from 0.05 to 0.7 [16,17] and resting discharge firing rates between 6 and 170 Hz [16,17,34]. Furthermore, we also explored the effects of such increased noise intensities on the models firing rate resonance, via repeated presentation of the zap stimulus for the same range of bias current values and noise intensities. For higher bias currents (0:4nA)
corresponding to the baseline firing rates seen under in vivo
conditions (*50Hz), the addition of noise is seen to reduce the oscillation index (Figure 7C). Addition of noise also decreased the oscillation frequency to values near the behaviorally relevant range (Figure 7D). As an aside, we note that, for low values of bias current (0:1nA), we observed a sharp increase followed by a decrease in the oscillation frequency (Figure 7D). This sharp increase at low noise intensities is consistent with previous studies showing that, for low noise, model neurons have a resonance at the spontaneous firing rate, while for higher noise intensities, the resonance frequency shifts to lower values [22]. We do not further Figure 5. Spiking responses to zap current input display a resonance.The model’s spiking response to zap current input also displays a resonance whose intensity and frequency vary with bothIbiasandggleak. A) Instantaneous stimulus frequency as a function of time. B–D) Example instantaneous firing rates as a function of time. These correspond to parameter values as follows: B) Ibias~0:05nA, ggleak~0:3mS=cm2, C) Ibias~0:35nA,ggleak~0:3mS=cm2, and D)Ibias~0:35nA,ggleak~0:6mS=cm2. The envelope of the response is fit with a black curve with an arrow marking the location of the maximum response amplitude. E) Oscillation index as a function ofIbiasandggleak. F) Oscillation frequency as a function of Ibiasandggleak. The parameter values corresponding to panels B,C,D are also shown. All other parameters had the same values as previously described exceptggNa~10mS=cm2andggK~2mS=cm2.
doi:10.1371/journal.pcbi.1002120.g005
explore this regime since VN neurons typically have baseline firing rates underin vivoconditions that are outside those for which this
regime is observed.
We first recomputed phase histograms in response to sinusoidal current injection (Figures 8A,B,C) for the same range ofIbiasand
stimulation frequencies used before but with the addition of noise with a low intensity that gave rise to low resting discharge CV values (0.04–0.24) and with bias currents giving rise to firing rates between 25–80 Hz in the absence of stimulation. We note that these overlap with the experimentally observed ranges of values [16]. We observed that this noise increased the range of stimulus phases that elicited spiking for higher stimulus frequencies, which reduced phase locking (compare Figures 8B,C with Figures 6B,C, respectively). However, this noise was not sufficient to completely
eliminate phase locking as can be seen from the low VAF and high PLI values observed for high (w8Hz) stimulation frequencies for a
wide range ofIbiasvalues (Figures 8D,E respectively).
We next performed simulations with a higher noise intensity giving rise to higher resting discharge CV values (0.5–0.7) and bias current giving rise to firing rates from 35–85 Hz. Our results show that the phase histograms in response to sinusoidal current injection were all sinusoidal in shape, even for parameters that gave rise to phase locking in the absence of noise (compare Figures 9A,B,C with Figures 6A,B,C, respectively). This indicates a lack of phase locking as every phase of the input can now elicit
spiking. We recomputed the VAF as a function of Ibias and
stimulus frequency and found large (w0:7) values over the entire
range explored (Figure 9D). Consequently, the model displayed Figure 6. Synchronization to sinusoidal input and its consequences on faithful encoding of this input through changes in firing rate.We characterized the model’s response to sinusoidal current injections with different frequencies using the phase histogram. A–C) Three example raster plots (top) and phase histograms (bottom) for different values ofIbiasandfstim. These correspond to parameter values as follows: A) Ibias~0:2nA,fstim~3Hz, B)Ibias~0:1nA,fstim~12Hz, and C)Ibias~0:3nA,fstim~15Hz. Also shown are the best fit sinusoidal curve to each phase histogram (red). D) Variance accounted for (VAF) as a function ofIbiasandfstim. E) Phase locking index (PLI) characterizing the model’s tendency to synchronize to the sinusoidal current as a function ofIbiasandfstim. It is seen that the VAF is low for parameters for which the PLI is high and vice-versa. The parameter values corresponding to panels A,B,C are also shown. Additional parameters were the same as described previously except
g
gleak~0:6 mS=cm2.
doi:10.1371/journal.pcbi.1002120.g006
negligible phase locking as quantified by the PLI (Figure 9E). Note that the range of values of VAF and PLI used in Figures 9D and 9E, respectively, were the same as those used previously (compare Figures 9D,E with Figures 6D,E and Figures 8D,E, respectively). As such, this noise intensity was sufficient to eliminate nonlinear phase locking and thereby give rise to faithful encoding of the stimulus waveform through changes in firing rate for all stimulus frequencies within the behaviorally relevant range.
In order to verify the robustness of our results, we also computed a second measure of nonlinear synchronization, the nonlinearity index (NI, see Methods), that is based on the ratio of the Fourier coefficient amplitude squared at the second harmonic to that at the stimulus frequency. This measure had qualitatively similar behavior to that of the PLI measure as a function of the bias currentIbias, stimulus frequency, and noise intensity (compare
Figure S3 to Figures 6,8,9).
Finally, in order to test that these results were not an artifact of our using current input, we used conductance input rather than current input stimuli in our model. The effect of noise on phase locking in this model (Figure S4) were in qualitative agreement with those shown in Figures 6,8, and 9, illustrating the robustness
of our main result to the type of input used. We note that this outcome was expected given that increasing the membrane conductance alone was not sufficient to completely eliminate phase locking over the behaviorally relevant frequency range.
The effects of noise intensity on our models ability to accurately encode the time course of sinusoidal current injections through changes in firing rate are summarized in Figure 10. While the PLI rapidly decreases as a function of increasing noise intensity, the VAF rapidly increases (Figure 10A). For comparison, the resulting firing rate and CV values in the absence of stimulation are also shown for the same noise intensities (Figure 10B). Because high noise intensities were sufficient to eliminate nonlinear phase locking from our model, we used linear systems analysis to characterize the relationship between input and output in our model. Specifically, we computed the gain (i.e. the coefficient relating input and output) as a function of Ibias and stimulus
frequency. Our results show that the gain increases smoothly as a function of stimulation frequency for a given value ofIbiasin the
presence of high noise but not so when noise is not present (Figures 10C, D). This result is important as previous studies conductedin vivohave shown that VN neurons generally display Figure 7. Effects of the bias current and noise intensity on resting discharge rate and variability, and resonance strength and frequency.The effects of the bias currentIbiasand noise intensityson the resting discharge rate and variability as quantified by the coefficient of variation (CV) were explored. A) Resting discharge rate as a function ofIbiasands. B) CV as a function ofIbiasands. Parameter values were the same as those previously described. C) Oscillation index from zap stimuli as a function ofIbiasand noise intensitys. D) Oscillation frequency as a function of Ibiasand noise intensitys.
doi:10.1371/journal.pcbi.1002120.g007
increasing gains as a function of stimulus frequency [16,17]. Our results therefore suggest that the high-pass filtering characteristics seen in most VN neuronsin vivowhich are due, at least in part, to
an intrinsic resonance. This resonance is attenuated by the high resting discharge variability that results from the intense convergent synaptic input that the cell receives under in vivo
conditions.
Discussion
Summary of results
The goal of this study was to resolve an apparent discrepancy between the responses of VN neurons to current injectionin vitro
and to sensory input in vivo. VN neurons are prone to display
nonlinear responses such as synchronization to the peaks of
sinusoidal current injectionin vitro. In contrast, studies performed in vivohave shown that VN neuron can respond to sensory input
through changes in firing rate that accurately follow variations in sensory stimulation over a wide frequency range [16]. We investigated the cause for this discrepancy by subjecting a mathematical model based on the Hodgkin-Huxley formalism of
in vitroVN neuron activity toin vivoconditions.
Our results show that this model displays membrane potential oscillations that persisted for a wide range of parameter values. These oscillations give rise to a resonance in the membrane potential which is transmitted to the spike train, causing nonlinear behavior such as synchronization or phase locking over the natural stimulus frequency range (0–20 Hz). It is well known that neural variability resulting from the intense synaptic bombardment to which VN neurons are subjected toin vivo will promote faithful Figure 8. Effects of low intensity noise on synchronization to sinusoidal input and its consequences on faithful encoding of this input through changes in firing rate.We characterized the model’s response to sinusoidal current injections with different frequencies using the phase histogram as before. A–C) Three example raster plots (top) and phase histograms (bottom) for the same parameter values used in Figure 6 with the best sinusoidal fits (red). D) VAF as a function ofIbiasandfstim. E) PLI as a function ofIbiasandfstim. It is seen that low intensity noise somewhat disrupts phase locking but that there are still ranges of parameter values for which the model displays significant phase locking. The parameter values corresponding to panels A,B,C are also shown. Parameter values were the same as those previously described except fors~0:0022nA. doi:10.1371/journal.pcbi.1002120.g008
encoding of the stimulus waveform through changes in firing rate [37]. As such, we tested the hypothesis that the levels of resting discharge variability seen underin vivoconditions could account for
the fact that some VN neuron classes do not display
synchroni-zation in vivo. To do so, we added noise whose intensity was
calibrated in order to match the resting discharge variability experimentally observed in VN neurons underin vivo conditions.
We found that low noise intensities did not completely eliminate phase locking behavior. In contrast, we found that high noise intensities almost completely eliminated phase locking and that our model could now faithfully encode the time course of sinusoidal current injections at frequencies contained within 0– 20 Hz for a wide range of input bias currents. These results are consistent with experimental recordings from VN neuronsin vivo,
suggesting that the addition of noise in the in vivo condition
underlies the discrepancy between the responses of VN neurons to current injectionin vitroand to sensory inputin vivo. Furthermore,
they suggest that the vestibular system uses increases in variability to increase the fidelity of encoding by single neurons. This strategy appears to be found across several sensory systems (reviewed in [37]).
Correspondence between anatomy and function in VN
In the present study, we focused on the type B neurons as observedin vitro. This is because these neurons display the greatest tendency to respond to sinusoidal current injection with synchronization as well as spike frequency adaptation. In contrast, type A neurons show a sustained tonic response and faithfully Figure 9. Effects of high intensity noise on synchronization to sinusoidal input and its consequences on faithful encoding of this input through changes in firing rate.We characterized the model’s response to sinusoidal current injections with different frequencies using the phase histogram as before. A–C) Three example raster plots (top) and phase histograms (bottom) for the same parameter values used in Figure 8 with the best sinusoidal fits (red). D) VAF as a function ofIbiasandfstim. E) PLI as a function ofIbiasandfstim. It is seen that high intensity noise eliminates phase locking and promotes faithful encoding of the input waveform by changes in firing rate as can be seen from the sinusoidal phase histograms, high VAF values, and negligible PLI values. The parameter values corresponding to panels A,B,C are also shown. Parameter values were the same as those previously described except fors~0:0225nA.
doi:10.1371/journal.pcbi.1002120.g009
follow the time course of sinusoidal current injections that are up to three times larger than those followed by type B neurons [8– 11,13]. The differences between type A and type B neurons are thought to be mediated by differences in the levels of different membrane conductances [12,14]. In particular, type B neurons display larger calcium-activated conductances [13]. Such currents mediate spike frequency adaptation (see [38,39] for review). Theoretical studies have shown that spike frequency adaptation leads to high-pass filtering of time varying stimuli [40–42], which is consistent with our modeling results showing an increased gain for higher frequencies. We note that one could use the same model as was used here in order to mimic the activity of type A VN neurons by changing membrane conductances as was done previously [14]. We predict that a model of type A VN neuron activity would not display phase locking for the sinusoidal current injections considered here but would display phase locking for larger amplitudes.
In vivo studies have found three major functional neuronal classes in MVN that are based on the responses to voluntary eye movements and passive whole-body rotation: 1) Vestibular-Only (VO) neurons, 2) Position-Vestibular-Pause (PVP) neurons, 3) Floccular Target neurons (FTN). VO neurons project to the spinal cord and are thought to mediate vestibulo-spinal reflexes that control posture [43–45], as well as cerebellum and thalamus [46,47], where they are thought to play a role in spatial orientation
computation. The vestibular system also generates the vestibulo-ocular reflex (VOR) that functions to effectively stabilize gaze by moving the eye in the opposite direction to the on-going head motion. The three-neuron arcs mediating the VOR are well characterized. The primary pathway consists of projections from afferents to PVP neurons, which in turn project to extraocular motoneurons that control the eye muscles. A secondary pathway is mediated via FTN neurons that receive direct input from the Floccular lobe of the vestibular cerebellum and also project to the extraocular motoneurons. The correspondence between type A
and B MVN neurons as observed in vitro and the different
functional classes observedin vivois not well understood in general.
The most direct link that has been made to date is based on the findings of electrophysiological and anatomical studies that suggest a subpopulation of type B neurons receive input from Floccular purkinje cells, such that they most likely correspond to the FTN
neurons which have been characterized in vivo [20,21]. This
correspondence between type B cells and FTN cells, however, is
unexpected since in vivo experiments have shown that FTN
neurons do not display robust phase locking and instead respond to sinusoidal head rotations through changes in firing rate that scale with stimulus intensity for frequencies spanning the behaviorally relevant rangein vivo[16]. Thus, our results provide
a potential explanation of this discrepancy originating in the intense synaptic bombardment that these neurons receivein vivo. Figure 10. Effects of varying noise intensity on the VAF and PLI.A) Increasing noise intensity results in decreased PLI and consequently increased VAF values forIbias~0:1nAandfstim~12Hz. B) Increasing noise intensity also results in increased resting (ieS(t)~0) discharge rate as well as increased spiking variability as quantified by CV. C) Gain obtained from our model with no noise (s~0nA) as a function ofIbiasandfstim. D) Gain obtained from our model with high noise intensity (s~0:0225nA) as a function ofIbias andfstim. It is seen that for a given value ofIbiasthe gain increases as a function of the input frequencyfstimuntil about 22 Hz.
doi:10.1371/journal.pcbi.1002120.g010
The correspondence between VO and PVP neuronsin vivoand
type A/B neuronsin vitrois not known. However, previous studies
have shown that PVP neurons display nonlinear phase locking
behavior in response to high frequency (w12Hz) sinusoidal
rotations [16]. This is consistent with our modeling results showing that phase locking is not abolished for low noise intensities (Figure 8). Our results therefore predict that: i) PVP neurons should have type B like responsesin vitro; ii) PVP neurons
with low resting discharge rates will display a greater tendency for phase locking and, iii): this tendency is a consequence of their low resting discharge variability. Previous studies have reported that VO neurons do not display phase locking dynamics but have only explored frequencies between 0 and 4 Hz [48]. Further studies are needed to explore VO neuron responses to higher stimulus frequencies and might help elucidate their correspondence with either type A or type B neurons.
In conclusion, while it is clear that the filtering properties of VN neurons as observed in vivo are shaped by intrinsic mechanisms
[13], our simulations are consistent with a growing body of literature emphasizing the role of network mechanisms [42,49]
such as synaptic bombardment that is present under in vivo
conditions affecting their responses to sensory input.
Sources of variability in VN
What are the sources of resting discharge variability in VN neurons? A unique aspect of the vestibular system, compared to other sensory systems, is that information processing is strongly multisensory and multimodal at the first stage of central processing. This occurs because the vestibular nuclei receive inputs from a wide range of cortical, cerebellar, and other brainstem structures in addition to direct inputs from the vestibular afferents. First, there is complete overlap in the terminal fields of regular and irregular afferents in each of the major subdivisions of the vestibular nuclei [50], and the results of electrophysiological studies have shown that about half of the VN neuron population receive significant input from both afferent classes [5,6]. Additionally, not only do neurons typically receive convergent input from otolith as well as canals afferents, but there is an impressive convergence of extra-vestibular information within the VN (reviewed in [51]). Notably, sensory inputs encoding somatosensory, proprioceptive, and visual information as well as premotor signals related to the generation of eye and head movements are sent directly to the vestibular nuclei. In alert animals, these extra-vestibular signals strongly modify the processing of vestibular information during our everyday activities, such that this convergence plays an important role in shaping the simple sensory-motor transformations that mediate vestibulo-ocular and vestibulo-spinal reflexes as well as higher-order vestibular functions, such as self-motion perception and spatial orientation. Thus, as a result of their cortical, cerebellar, and brainstem and afferent input afferents, VN neurons are likely to receive substantial synaptic bombardment in vivo. For example,
extracellular recordings in the cerebellar flocculus reveal irregu-larities in the spontaneous simple spikes firing rate of the output neurons (i.e. Purkinje cell) [52]. This provides a clear source of variability to FTN neurons which might explain their lack of synchronization to sensory stimulation as predicted from our modeling results.
Differences betweenin vivoandin vitroconditions in VN neuronal activity
Previous reports have found that the high conductance state of neuronsin vivocan have a significant influence on their processing of
synaptic input through changes in intrinsic dynamics [27,53–55].
Specifically, these changes consist of: 1) increased synaptic input that is dominated by excitation that acts as a net depolarizing bias; 2) increased membrane conductance and; 3) increased variability. In general, bridging the gap betweenin vivoandin vitroconditions is not
well understood because it is not clear which combination the three aforementioned effects is responsible for the observed changes in dynamics. For example, both changes in the depolarization bias as well as in variability can alter burst dynamics in thalamocortical neurons [54,56].
Previous studies have investigated the effects ofin vivoconditions
on the activity of VN neurons [14,57,58]. In particular, it has been proposed that heterogeneities might allow for the VN neuron population to accurately encode the time course of vestibular stimuli while maintaining nonlinear synchronization at the single neuron level [58]. This hypothesis is contrary to more recent experimental results showing that many neurons in the VN, such as FTNs, do not display phase lockingin vivo [16]. Our results
instead predict that increased variability seen under in vivo
conditions can account for the fact that these neurons accurately follow the time course of vestibular stimuli through changes in their firing rates and that nonlinear behavior such as phase locking occurs because of intrinsic rather than network dynamics.
Moreover, it has been proposed thatin vivoconditions could be
mimicked in VN neurons by increasing the bias current, thereby increasing the firing rate [14,57]. Our results show that increases in both bias current and membrane conductance are not sufficient to eliminate synchronization for the parameter values used in our model. Instead, our results predict that variability in the form of noise is the main reason for many VN neurons not displaying
synchronization in vivo. The mechanism by which this noise
attenuates synchronization is not by increasing the baseline firing rate but instead by enabling the firing of action potentials at all phases of the stimulus cycle. This prediction can be tested experimentallyin vitroby mimickingin vivoconditions through the
dynamic clamp technique [25]. Similar variability-related effects have been observed experimentally in recordings from entorhinal cortical stellate cellsin vitro[27]. Indeed, these cells show a strong
tendency to display subthreshold membrane potential oscillations in the theta rangein vitro[59] but no significant peak in the theta
range has been observed in their activities in awake behaving animals [60]. This suggests that these subthreshold membrane oscillations are strongly attenuatedin vivo. The results of Fernandez
and White [27] support this viewpoint as they observed weaker oscillations when they increased conductance and variability through dynamic clampin vitro.
In particular, we note that our model did not include the inward rectifier currentIhthat is known to be present in VN neurons [21].
While this current has been previously shown to increase the magnitude of membrane potential oscillations [23], it is unlikely to be activated in the depolarized state characteristic of in vivo
conditions in VN neurons [21]. Indeed, in order to activateIh, the
membrane potential must be brought to about 15 mV below the spiking threshold for at least 300 ms [21]. Such a large hyperpolarization leads to a cessation of firing as observedin vitro
that lasts for at least 300 ms. However, VN neurons are spontaneously active with firing rates of*50Hz in vivo and do not respond to vestibular stimuli (for the intensities typically used in vivo studies) with a complete cessation of firing that lasts 300 ms [17]. Instead, VN neurons smoothly encode variations in head velocity through changes in their firing rate but their firing rates does not reach zero. Thus, it seems unlikely that the membrane potential would reach the values that are necessary to activateIh.
Finally, we note that there exist highly detailed compartmental models of VN neurons that are more morphologically realistic
than the model used here [61]. While it would be more realistic to use a detailed compartmental model with an anatomically accurate dendritic tree, such a model would have a significantly greater number of parameters than our current one. Justifying the values used for many of these parameters (i.e. the precise location, strength, and dynamics of afferent synapses on the dendritic tree) would be non-trivial at best. Based on our results, we can conclude that taking into account the shape of the dendritic tree of VN neurons is not necessary to explain the discrepancy betweenin vitro
and in vivoresults. Nevertheless, future experiments should focus
on understanding the effects of dendritic processing in VN neurons.
Stochastic resonance in VN neurons promotes linear coding: functional consequences
Our results have demonstrated that noise can enhance signal transmission in our model VN neuron. Such enhancement of signal transmission by noise is often referred to as stochastic resonance [62–67], a phenomenon by which noise enhances the transmission of a subthreshold signal (i.e. a signal whose intensity is not sufficient to induce spiking activity on its own). We note that our result is, strictly speaking, not stochastic resonance since we chose model parameter values within the suprathreshold regime (i.e. the stimulus could induce action potential firing in the absence of noise). However, in our model, one of the effects of the noise is to induce firing for subthreshold stimulus values. Such effects have been widely discussed before and are commonly referred to as the O` linearization of systems by noise [37,68].
While this linearization by noise enables our model VN neuron to faithfully encode the time course of input within the natural frequency range (0–20 Hz), such encoding will only be seen for a finite range of stimulus amplitudes. Indeed, stimuli with larger amplitudes are expected to elicit nonlinear synchronization in VN neurons despite high trial-to-trial variability. In particular, such large amplitude stimuli might lead to activation ofIhfrom the argument above. The
putative function of such nonlinear encoding remains a mystery and should be the focus of future studies.
What is the functional role of suppressing synchronization in VN neuronsin vivo? It is clear that such synchronization in the
form of phase locking is used extensively in the auditory system [69–76]. Previous studies have shown that the addition of noise leads to a linearization of the steady state current-response relationship (i.e. the f-I curve) in model neurons [68]. Such linearization of the f-I has also been shown to give rise to gain control mechanisms [77–79] which will extend the dynamic range (i.e. the range of input values that can be coded through a change in output) of a neuron. We propose that increased variability serves to increase the dynamic range of VN neurons and therefore promote more faithful encoding of the stimulus time course through changes in firing rate over a wider range of vestibular stimulus intensities encountered by the organism in the natural
environment. This prediction can be tested in vitro using the
aforementioned dynamic clamp technique.
Methods
Model
We used a conductance based Hodgkin-Huxley-type model of VN neuron activityin vitro[14,80,81]. The model includes spiking
sodium, persistent sodium, delayed rectifier potassium, calcium, and calcium-activated potassium currents. We note that our model did not include the hyperpolarization activated inward rectifier currentIhwhich is present in VN neurons [21] and that addition
of this current did not qualitatively affect the nature of our results
(data not shown). The model is described by the following system of stochastic differential equations:
CmVV_~Iinput{Iions
_ n
n~½n?(V){n=tn(V) _
x
x~½x?(V){x=tx(V) _
C
C~Kp({ICa){RcC _
p
p~½p?(V){p=tp(V)
ð1Þ
where Iions~INazIKzIK½CazICazINaPzIL are the ionic
currents, which are given by
INa ~ggNam3?(V)(1{n)(V{VNa) IK ~ggKn4(V{VK)
IK½Ca ~ggK½Ca(
C
KdzC)(V{VK) ICa ~ggCax2(
Kc
KczC)(V{VCa) INaP ~ggNaPp(V{VNa) IL ~ggL(V{VL):
ð2Þ
The dynamical variables are the membrane voltageV, the calcium concentrationC, and the activation variablesn,x, andp. Although synaptic inputs are most accurately described by fluctuating conductances as described by Destexhe et al. [26], an effective synaptic input [22] can be modeled as an additive current decomposed into three components: a bias current, additive current fluctuations, and a stimulus modulation current. As such, we had
Iinput~Ibiaszsj(t)zS(t)whereIbiasis the bias current andS(t)is
the stimulus current injection.sis the noise intensity andj(t)is low pass filtered (4th-order Butterworth with 50 Hz cutoff) [82] Gaussian
white noise with mean zero and standard deviation unity. The activation variablesz[fn,x,pgobey the following equation:
z?(V)~
1
1zexp {2a(z) V{V(z) 1=2
h i: ð3Þ
Furthermore, while the time constantstx(V)andtp(V)are taken to
be independent of the membrane voltage V, the voltage dependent time constanttn(V)is given by
tn(V)~
1 2lcosh a(z) V{V(z)
1=2
h i: ð4Þ
Unless otherwise indicated, parameter values were taken as originally tuned [14], and are listed as follows: ggNa~10mS=cm2, VNa~55mV, V1(m=2)~{33mV, a(m)~0:055, ggK~2mS=cm2, VK~{80mV, V1(n=)2~{40mV, a
(n)~0:055, l~0:2,
g gCa~
0:25mS=cm2, V
Ca~124mV, V1(x=2)~{30mV, a(x)~0:08, tx~
10ms,ggK½Ca~1mS=cm2,Kp~0:05, Kc~1, Kd~0:5,Rc~0:05,
g
gNaP~0:05mS=cm2,VNaP~55mV,V1(=p)2~{56mV,a(p)~0:075,
tp~5ms, ggL~0:3mS=cm2, VL~{50mV, andCM~1mF=cm2.
The model equations were integrated numerically using an Euler-Maruyama numerical integration technique [83] with an integration time step of0:02ms.
If the time scale at whichggNa andggKvary at is much smaller
than all other time scales in the model, then one can replace the sodium and potassium currents in equation (1) by their average values during an action potential. This is the case for the parameter values used here. Indeed, the time constant of ggK is
*0:1mswhile the minimum time constant of all other processes in our model is 5 ms (note thatggNa tracks the membrane potential
instantaneously and thus has an effective time constant of zero). We note that, for our parameter values, the average value of summed sodium and potassium currents during an action potential is 0:12nA, which is an order of magnitude less than the range of bias currents used in this study. As such, our approach of setting ggNa~ggK~0mS=cm2 is valid if one is interested in
looking at the dependence of these oscillations on parameter values.
Neurons are known to receive massive amounts of synaptic bombardment from afferent inputsin vivo, which puts them into a
high-conductance state. Such conditions are characterized by a depolarized and fluctuating membrane potential with a reduction in input resistance (or equivalently an increase in membrane conductance) [26]. Although each individual synaptic input can be accurately modeled by including the presynaptic action potential sequence, the increased membrane conductance and membrane potential fluctuations due to synaptic bombardment onto a neuron can be accurately reproduced by increasing the leak conductance, adding a depolarizing bias current, and adding a noisy current [22,82,84]. We note that increasing the leak conductance in order to mimic the increased membrane conductance due to synaptic bombardment is used in dynamic clamp experiments [27].
In order to verify the robustness of our results to more biophysical conditions, we also modeled our sinusoidal stimulus input using an excitatory conductance-based input rather than a simple current input. In this case we used an input current
Iinput~Ibiaszsj(t)zgex(t)(V{Vex), with the excitatory reversal
potential Vex~0. The excitatory conductance was set to
gex(t)~ggex(1zS(t)), whereS(t)is now a sinusoid with amplitude
of unity, ensuring that gex(t)w0. The overall strength of the
sinusoidal input is then set by ggex~0:07mS=cm2, the value of
which was chosen to achieve a comparable firing rate modulation as achieved for equivalent simulations with current input.
Measures
For membrane potential responses to step current inputs, the oscillation index is calculated from the response in the time domain V(t), from the following equation:
Iosc~
Vmax{Vmin Vf{Vi
, ð5Þ
whereVmaxis the maximum voltage occurring after the input step
onset, and Vmin is the minimum voltage that occurs after the
maximum. Vi and Vf denote the initial and final values of the
voltage, respectively.
In the case of zap current injection, the oscillation index was computed from the envelope of the amplitude modulated membrane voltage response. The envelope was computed by subdividing the membrane potential waveform into windows of length 100 ms and by taking the maximum value within each window. The resulting curve was then low-pass filtered (50th-order
low-pass FIR filter with 1.875 Hz cutoff). The oscillation index is then given by the envelope maximum minus the value at t = 0. For the spiking activity, the oscillation index is computed in a manner similar to that described above but using the instantaneous firing rate (i.e. the reciprocal of the ISIs) waveform. In that case, each
window was 400 ms long and the filter was a50th-order low-pass FIR filter with 0.625 Hz cutoff.
We also characterized the model’s response to sinusoidal current injections that spanned the behaviorally relevant frequen-cy range (0–20 Hz). As done before [14], to convert current density to current, we assume that our model neuron is spherical with a radius of 20mm, so that 10mA=cm2 is equivalent to
*0:5nA. This was done in order to facilitate the comparison of our simulation with experimental data. We used sinusoid amplitudes ofA~0:13nA, as were previously used experimentally
in vitro [13]. Sinusoidal current injections of a given frequency
lasting one cycle were repeatedly presented with the model neuron’s initial conditions randomized before each presentation, until 100 seconds of data had been generated for each combination of 100 stimulus frequencies and 100 values of bias current. A cycle histogram was then computed and normalized in order to give the firing rate R(t), as a function of the stimulus phase. The firing rate was then fit to the optimal linear regression model defined as RR(^ t)~Asin(2pfstimtzw)zB, as is done
experimentally [18,19,85]. Although fitting the phase w of RR(^ t)
is nonlinear, an optimal linear fit was made for many possible phase values held constant, and the best linear fit taken. The goodness of the fit is then quantified by the variance-accounted-for (VAF) given by the following equation:
VAF~1{ S(R(t)
{RR(^ t))2T
S(R(t){SR(t)T)2T, ð6Þ whereS:::T~N1PNi~1:::withNthe number of bins. In the case of a perfect fit, the numerator is equal to zero and the VAF is equal to its maximum value of one. The worst possible fit results in a the minimal VAF of zero. The gain and phase of the response are then calculated as the amplitude of the fit sinusoid normalized by the amplitude of the stimulus and the phase shift of the fit with respect to that of the stimulus, respectively [18,19,85].
The phase locking index (PLI) is computed using the entropy of the cycle histogram [86]. Unlike measures of vector strength [87], this measure can quantify the degree of phase locking present in multi-peaked phase histograms, as present in our case. It is given by:
PLI~1{E0=Emax E0~{SP(w) log2P(w)T Emax~log2N:
ð7Þ
whereP(w)is the probability of firing a spike as a function of stimulus phase.E0gives the entropy of the probability distribution andEmaxis
the maximum entropy possible and is that of a uniform distribution. The PLI thus ranges between 0 and 1. As phase locking is a nonlinear phenomenon, we supplement this measure with the use of an additional more intuitive measure we refer to as a nonlinearity index (NI). This is done by taking the Fourier transform of the of the firing rate,R(t), in response to sinusoidal stimulation. We then take the ratio of the magnitudes of the Fourier coefficient squared (jFCj2) at three times the stimulus frequency divided by that at the stimulus frequency. We thus define NI as:
NI~jFCj23f
stim=jFCj 2
fstim: ð8Þ
If the firing rate is a linear function of the sinusoidal stimulus, then it can only contain power at the stimulus’ frequency. If there is phase
locking, however, then the magnitude squared of the Fourier coefficients at higher harmonics of the stimulus frequency will be non-zero.
Linearized model
In the subthreshold regime with spiking sodium and rectifying potassium conductances set to zero, our nonlinear neuron model reduces to the following:
_ V
V ~FV(V,C,x,p)
_ C
C ~FC(V,C,x)
_ x
x ~Fx(V,x)
_ p
p ~Fp(V,p),
ð9Þ
where FV(V,C,x,p)~½Iinput{(ICazIK½CazINaPzILeak)=Cm, FC(V,C,x)~Kp({ICa){RcC, and Fx(V,x)~½x?(V){x=
tx(V), andFp(V,p)~½p?(V){p=tp(V). The steady state values
of all dynamical variables,V,C,x,andp, can then be found numerically by solving the four equationsFi~0, fori[fV,C,x,pg. The system can then be linearized in the neighbourhood of these fixed points by Taylor expanding the four functionsFiand keeping only first order terms in the expansions [88]. Redefining the four system variables in terms of their deviation from steady state,
d~yy~~yy{~yy with the vector of dynamical variables defined as
~yy~½V,C,x,p’,~yy~½V,C,x,p’, and0denotes vector transposi-tion, the linearized system can then be described by the system of equations:
d~~yyyy_~Md~yy ð10Þ
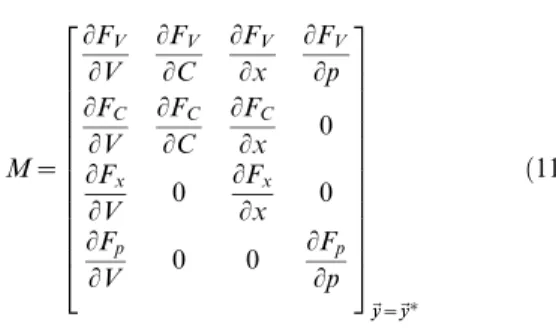
whereMis the Jacobian, which is given by:
M~ LFV LV LFV LC LFV Lx LFV Lp LFC LV LFC LC LFC
Lx 0
LFx
LV 0
LFx
Lx 0
LFp
LV 0 0
LFp Lp 2 6 6 6 6 6 6 6 6 6 6 6 6 4 3 7 7 7 7 7 7 7 7 7 7 7 7 5
~yy~~yy
ð11Þ
Finally, the Matlab function eigs is used to find the four eigenvalues,Eifori[f1,2,3,4g, of the matrixMordered by their magnitudes. All four eigengalues have a negative real part implying that the fixed point is stable. However, the last two eigenvalues were complex conjugates of each other, which implies the existence of oscillatory dynamics in the time course of the perturbations as they decay to zero. The frequency of such oscillations is given by the imaginary part of the third or fourth eigenvalues divided by2p. In order to assess the strength of these oscillations, the linearized model was simulated for step current inputs and the same oscillation index previously used for step current responses was calculated.
Supporting Information
Figure S1 Effects of increased persistent sodium
con-ductance on membrane potential oscillations. The model’s membrane potential response to step current input was characterized for physiologically plausible ranges of bias current
and persistent sodium conductance values. A–C) Example responses and the normalized squared magnitude of their Fourier transforms. These correspond to parameter values as follows: A)
Ibias~{0:125nA, ggNaP~0:02mS=cm2, B) Ibias~0:3625nA,
g
gNaP~0:098mS=cm2, and C) Ibias~0:8nA, ggNaP~0:168mS=
cm2. D) Oscillation index as a function of I
bias and ggNaP. E)
Oscillation frequency as a function of Ibias and ggNaP. The
parameter values corresponding to panels A,B,C are also shown. Other parameter values were ggCa~0:25mS=cm2, ggKCa~1mS=
cm2,gg
leak~0:3mS=cm2, ands~0nA.
(TIF)
Figure S2 The linearized models response to step input
agrees quantitatively with that of the full model. A) (left) Oscillation index and (right) oscillation frequency as a function ofIbias
andggCafor the linearized model. B) (left) Oscillation index and (right)
oscillation frequency as a function ofIbiasandggleakfor the linearized
model. C) (left) Oscillation index and (right) oscillation frequency as a function ofIbiasandggNaPfor the linearized model. In each case, other
parameter values were the same as those used for the full model shown in Figures 2,3, and S1, respectively.
(TIF)
Figure S3 A nonlinearity index (NI) gives qualitatively
similar results to those obtained with the PLI measure.A) NI as a function of the bias current Ibias and stimulus frequency
without noise. B) Example PSTH responses corresponding to
Ibias~0:1nAandfstim~12Hz. C) The squared magnitude of the
Fourier transform of the PSTH response. D) NI as a function of the bias currentIbiasand stimulus frequency with low intensity noise. E)
Example PSTH responses corresponding to Ibias~0:1nA and
fstim~12Hz. F) The squared magnitude of the Fourier transform
of the PSTH response. G) NI as a function of the bias currentIbias
and stimulus frequency with high intensity noise. H) Example PSTH responses corresponding toIbias~0:1nAandfstim~12Hz. I) The
squared magnitude of the Fourier transform of the PSTH response. (TIF)
Figure S4 Synchronization to sinusoidal conductance
input and the effects of noise.A) VAF as a function of the bias currentIbiasand stimulus frequency without noise. B) PLI as a
function of the bias currentIbias and stimulus frequency without
noise. C) NI as a function of the bias currentIbias and stimulus
frequency without noise. D) VAF as a function of the bias current
Ibiasand stimulus frequency with low intensity noise. E) PLI as a
function of the bias currentIbiasand stimulus frequency with low
intensity noise. F) NI as a function of the bias currentIbias and
stimulus frequency with low intensity noise. G) VAF as a function of the bias currentIbiasand stimulus frequency with high intensity
noise. H) PLI as a function of the bias currentIbias and stimulus
frequency with high noise. I) NI as a function of the bias current
Ibias and stimulus frequency with high intensity noise. All other
parameters values were the same as those used in the equivalent simulations shown in Figures 6, 8, and 9 for current input, with the additional excitatory synaptic conductanceggex~0:075mS=cm2.
(TIF)
Acknowledgments
We thank two anonymous reviewers for their useful comments.
Author Contributions
Conceived and designed the experiments: KEC MJC. Performed the experiments: ADS. Analyzed the data: ADS. Wrote the paper: ADS KEC MJC.