Abstract—Numerous biomedical devices include a light source component and a stable light source is totally vital for the precision of these devices. Therefore, the aim of this study is to design an automatic optical power control (AOPC) circuit to drive light source, like LED, for biomedical applications. Results show that the AOPC circuit is able to maintain a constant optical power output of LEDs between -20C and 70C. Also, the efficiency of the AOPC circuit to maintain a constant optical power output of LEDs is much better (3-fold) than a general VCCS circuit alone.
Keywords—Automatic optical power control, biomedical, LED
I. INTRODUCTION
ANY biomedical devices include a light source component, such as colorimeter, oximeter, optical blood glucose biosensor, and etc. A stable light source is absolutely essential for the accuracy of these devices. However, most of the light sources, like Light-Emitting Diode (LED), are very sensitive to temperature. In this study, LED is used as an example. As a LED is running, its temperature will rise and this will definitely influence its optical power output. Therefore, temperature compensation is necessary in order to achieve a constant optical power output of a LED. The conventional approaches to attain a constant optical power output of a LED include a photodiode for power detection and a driving circuit for the adjustment of the driving current to the LED based on the result detected by the photodiode [1-3]. However, such approaches can only monitor the LED surrounding temperature, but not the LED temperature itself. If the LED temperature can be monitored directly, temperature compensation can be achieved efficiently and therefore a stable optical power output of LED can be attained efficiently as well. Since the forward voltage
Manuscript received March 12, 2014. This work was supported by the National Science Council, Taiwan, R.O.C. under Grant 102-2221-E-260-004- and 102-2221-E-260-031-. This work was also partially supported by a grant (TCVGH-NCNU1027901 and TCVGH-NCNU1037904) from the Taichung Veterans General Hospital and National Chi Nan University, Taiwan, R.O.C.
Congo Tak Shing Ching is with the Department of Electrical Engineering, National Chi Nan University, Taiwan, R.O.C. (Corresponding author; Phone: +886-492910960ext4774; fax: +886-492917810; e-mail: [email protected])
Mu Fan Hsu is with the Department of Electrical Engineering, National Chi Nan University, Taiwan, R.O.C. (e-mail: [email protected])
Tai Ping Sun is with the Department of Electronics Engineering, Nan Kai University of Technology, Taiwan, R.O.C., on leave from the Department of Electrical Engineering, National Chi Nan University, Taiwan, R.O.C. (e-mail: [email protected]).
Hsiu Li Shieh is with the Department of Electrical Engineering, National Chi Nan University, Taiwan, R.O.C. (e-mail: [email protected])
of a LED has a good relationship with its operating temperature, LED can be used as a temperature sensor to monitor its temperature change. Therefore, the aim of this study is to design an automatic optical power control (AOPC) circuit to drive LED for biomedical applications.
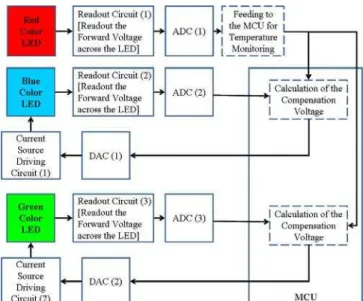
Fig. 1. Block diagram of the AOPC circuit.
Fig. 2. The NICHIA full color LED. (a) Schematic diagram. (b) Photograph of the LED.
II. MATERIALS AND METHODS
A. Equipments
A constant temperature oven (-20–100C) is used to provide a testing environment at different temperatures. An integrating sphere is used to measure the total optical power output of a light source (LED in this study).
B. Circuit Design
The block diagram of the AOPC circuit is shown in Fig. 1. It consists of a 3-color (i.e. Red, Green and Blue colors) LED (NICHIA full color LED, NSSM016AT, Fig. 2), readout circuits, current source driving circuits (it is actually a voltage controlled current source, VCCS, circuit), analog-to-digital converter (ADC), digital-to-analog
Design of an Automatic Optical Power Control
Circuit for Biomedical Applications
Congo Tak Shing Ching, Mu Fan Hsu, Tai Ping Sun, and Hsiu Li Shieh
M
(a) (b)
Proceedings of the World Congress on Engineering 2014 Vol I, WCE 2014, July 2 - 4, 2014, London, U.K.
ISBN: 978-988-19252-7-5
ISSN: 2078-0958 (Print); ISSN: 2078-0966 (Online)
converter (DAC), and a microcontroller (MCU).
In this study, the red-color LED is used for the monitoring of LED temperature. In fact, both blue- and green-color LED can be used for LED temperature monitoring as well. A readout circuit (1), with a component of an instrumentation amplifier, is used to measure the forward voltage across the red-color LED. Then, the measured voltage is converted into digital signal by ADC (1) and fed into the MCU for the calculation of the LED temperature.
In order to maintain a constant optical power output of the blue-color LED without the influence of its temperature changes, a readout circuit (2) is used to measure the forward voltage across the blue-color LED. The same, the measured voltage is converted into digital signal by ADC (2) and fed into the MCU. By the use of the signals from ADC (1) and ADC (2), the necessary compensation voltage (CV) can be calculated by the MCU. The required CV is then fed into DAC (1) in order to convert itself into analog CV. Then, the analog CV is used to drive the current source driving circuit (1), which is used to drive the blue-color LED in order to maintain a constant optical power output.
The working mechanism for the maintenance of a constant optical power output of the green-color LED without the influence of its temperature changes is identical to the that of the blue-color LED.
C. Circuit Evaluations
The AOPC circuit was used to drive a NICHIA 3-color LED while the LED itself was placed inside the integrating sphere for total optical power output measurement. Then, the whole setup was placed inside the constant temperature oven for evaluation.
III. RESULTS AND DISCUSSION
Fig. 3 shows the relationship between the forward voltage across the red-color LED and temperature. This helps to find out the LED temperature by just simply measuring the forward voltage across the red-color LED.
Fig. 4 shows the relationship between the optical power output of the blue-color LED and temperature. Based on this finding, a CV versus temperature graph (Fig. 5) can be generated in order to maintain a constant optical power output of the blue-color LED.
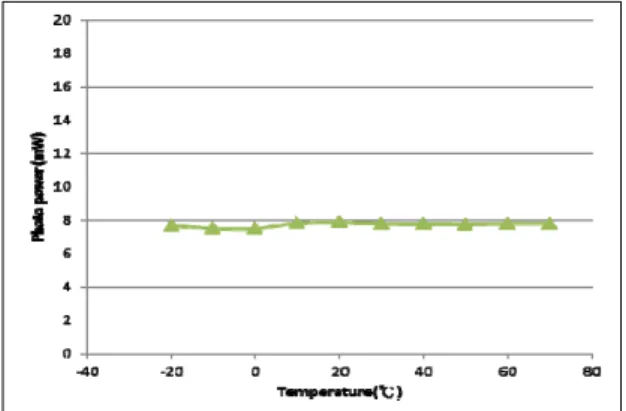
Fig. 6 shows the optical power output of the blue-color LED after using the AOPC circuit. It was found that the optical power output of the blue-color LED can be maintained constantly by the use of the AOPC circuit.
Moreover, the efficiency of the AOPC circuit to maintain a constant optical power output of the blue-color LED is much better (3-fold) than a general VCCS circuit alone (Table 1).
Fig. 7 shows the relationship between the optical power output of the green-color LED and temperature. Based on this finding, a CV versus temperature graph (Fig. 8) can be generated in order to maintain a constant optical power output of the green-color LED.
Fig. 9 shows the optical power output of the green-color LED after using the AOPC circuit. It was found that the optical power output of the green-color LED can be maintained constantly by the use of the AOPC circuit.
Fig. 3. The relationship between the forward voltage across the red-color LED and temperature. This graph can be used for LED temperature monitoring.
Fig. 4. The relationship between the optical power output of the blue-color LED and temperature. The LED is driven by a VCCS circuit. This graph tells us how much optical power compensation is required for the blue-color LED.
= +
R =
Te e a e C
C
e
a
i
V
a
ge
V
Fig. 5. Illustration of CV versus temperature. This graph tells us how much CV is required for the blue-color LED in order to maintain a constant optical power output of it by installing the regression line into the MCU.
Table 1. Evaluation of the efficiency of the AOPC circuit and VCCS circuit to maintain a constant optical power output of a LED.
Variation of Optical Power Output (mW/C)
VCCS Circuit AOPC circuit
Blue-color LED 0.012994 0.004264 Green-color LED 0.009350 0.003356 Proceedings of the World Congress on Engineering 2014 Vol I,
WCE 2014, July 2 - 4, 2014, London, U.K.
ISBN: 978-988-19252-7-5
ISSN: 2078-0958 (Print); ISSN: 2078-0966 (Online)
Besides, as shown in Table 1, the efficiency of the AOPC circuit to maintain a constant optical power output of the green-color LED is much better (3-fold) than a general VCCS circuit alone.
One of the advantages of the AOPC circuit is that it is very easy to adjust in order to adopt other light sources as everything is controlled by the MCU. In general, most of the necessary information can be obtained from the datasheet of the light sources, such as optical power output of a light source versus temperature and etc. Based on such information, a calibration curve of CV versus temperature can then be generated and the equation of the regression line can be installed into the MCU in order to maintain a constant optical power output of the light source.
IV. CONCLUSION
An AOPC circuit has been designed and evaluated. The AOPC circuit is able to maintain a constant optical power output of LEDs between -20C and 70C. Also, the efficiency of the AOPC circuit to maintain a constant optical power output of LEDs is much better (3-fold) than a general VCCS circuit alone.
Fig. 6. Illustration of the optical power output of the blue-color LED after using the AOPC circuit versus temperature. The optical power output is almost constant between -20C and 70C.
Fig. 7. The relationship between the optical power output of the green-color LED and temperature. The LED is driven by a VCCS circuit. This graph tells us how much optical power compensation is required for the green-color LED.
= +
R =
Te e a e C
C
e
a
i
V
ag
e
V
Fig. 8. Illustration of CV versus temperature. This graph tells us how much CV is required for the green-color LED in order to maintain a constant optical power output of it by installing the regression line into the MCU.
Fig. 9. Illustration of the optical power output of the green-color LED after using the AOPC circuit versus temperature. The optical power output is almost constant between -20C and 70C.
REFERENCES
[1] S. Muthu, F. Schuurmans, and M. Pashley, “Red, Green and Blue LEDs for White Light Illumination,” IEEE Quantum Electronics, vol. 8, pp.333, 2002.
[2] H. Lischka, H. Henschel, W. Lennartz, and K.U. Schmidt, ”Radiation Sensitivity of Light Emitting Diodes (LED), Laser Diodes (LD) and Photodiodes (PD),” IEEE Transactions on Nuclear Science, vol. 39, pp.423-427, 1992.
[3] F.C. Wang, C.W. Tang, and B.J. Huang, “Multivariable Robust Control for a Red-Green-Blue-LED Lighting System,” IEEE Transactions on Power Electronics, vol. 25, pp. 417-428, 2010. Proceedings of the World Congress on Engineering 2014 Vol I,
WCE 2014, July 2 - 4, 2014, London, U.K.
ISBN: 978-988-19252-7-5
ISSN: 2078-0958 (Print); ISSN: 2078-0966 (Online)