ISSN 1546-9239
© 2005 Science Publications
Corresponding Author: Ibrahiem M. M. El Emary, Amman Al Ahliyya University, Amman, Jordan
An Advance Approach to Evaluate the Performance of the TCP Networks
1
Ibrahiem M.M. El Emary and
2Farouq Al Taweel
1
1Amman Al Ahliyya University, Amman, Jordan
2
Al Balqa Applied University, Al Salt, Jordan
Abstract: In this study, we present a new approach for estimating the performance of the TCP network depending on a mathematical formula which converts the conceptual performance parameter to a valuable one. With respect to TCP network performance, we consider the Random Early Detection (RED) and RED-Based algorithms where both RED and RED-Based follow the Active Queue Management (AQM) approach in TCP networks. Mainly, we make a comprehensive understanding of various network parameters that continually affect the network performance. The main parameters that are used given by: network throughput, link utilization, network average delay, and packet loss rate. Also in this study, we estimate a new parameter reflecting the network performance called Network Quality Parameter (NQP).
Key words: RED, SRED, ARED, AQM, NQP, TCP
INTRODUCTION
There are some problems affecting the network performance like congestion phenomenon in TCP networks[1]. Researchers tried to design new strategies in effort of increasing the network performance and quality. Active Queue Management (AQM) is one of the most popular approaches that are followed to handle the congestion of TCP networks[2]. RED is an algorithm follows the AQM approach of congestion handling[3]. Many RED based algorithms have been proposed since the RED algorithm was presented in 1993 [1]. Some of these algorithms are: Adaptive RED (ARED), Blue RED and Stabilized RED (SRED). The performance of these various REDs has been evaluated[1, 2].
Researchers tried to evaluate the network performance by many ways. The core parameters for performance evaluation were: network throughput, link utilization, average network delay and packet loss rate. Each parameter was evaluated and plotted in a single figure against the network run time. In[2], M. Li and H. Wang depicts some examples of network performance evaluation.
It is a main step to represent each performance parameter in an independent plot for the purpose of monitoring each parameter during the simulation time. This independent representation allows the researchers to sense their modification effects on network performance. However, we still need a general parameter reflecting the entire network performance during the run or the simulation time of the network since evaluating the network performance by each parameter in a single plot will never reflect the entire network operation. So that, through this study, we will introduce a new methodology to evaluate the performance parameter based on a mathematical treatment. Description, analysis, evaluation and
enhancement of the presented approach are handled in this study.
Active queue management (AQM) and RED variants: Congestion is a problem that occurs in shared networks when multiple users contend for access to the same resource (bandwidth, buffers and queues). Network resorts to packets dropping for the purpose of congestion handling. Dropping packets is inefficient since if a host is bursting and congestion occurs, a lot of packets will be lost. Therefore, it is useful to detect impeding congestion conditions and activities manage congestion before it gets out of hand. Active queue management is a technique in which routers actively drop packets from queues by sending a signal to senders in order to slow down its transmission rate. Random Early Detection (RED) is an active queue management scheme that provides a mechanism for congestion avoidance. Unlike traditional congestion control schemes that drop packets at the end of full queues, RED uses statistical methods to drop packets in a probabilistic way before queues overflow. Dropping packets in this way slows a source down enough to keep the queue steady and reduces the number of packets that would be lost when a queue overflow and a host is transmitted at a high rate.
dropped. RED gateways keep the average queue size low while allowing occasional bursts of packets in the queue.
During congestion, the probability that the gateway notifies a particular connection to reduce its window is roughly proportional to that connection's share of the bandwidth through the gateway. RED gateways designed to accompany a transport-layer congestion control protocol such as TCP. The RED gateway has no bias against burst traffic and avoids the global synchronization of the many connections decreasing their window at the same time.
The RED congestion control mechanisms monitor the average queue size for each output queue, and using randomization, choose the connections to notify of that congestion. Transient congestion accommodated by a temporary increase in the queue. Longer-lived congestion reflected by an increase in the computed average queue size, and results in randomized feedback to some of the connections to decrease their windows. The probability that a connection notified of congestion is proportional to that connection's share of the throughput through the gateway.
RED gateways can mark a packet by dropping it at the gateway or by setting a bit in the packet header, depending on the transport protocol. When the average queue size exceeds a maximum threshold, the RED gateway marks every packet that arrives at the gateway. If RED gateways mark packets by dropping them, rather than by setting a bit in the packet header (when the average queue size exceeds the maximum thresholds), then the RED gateway controls the average queue size even in the absence of a cooperating transport protocol.
RED drops packet when congestion occurs using the marking probability in Esq. 1 & 2, where Eq. 1 represents the immediately marking probability of the packet. Eq. 2 is the accumulative marking probability used to mark or drop a packet:
th b
th th avg min P max .P
max min
−
=
−
(1)
a b
b 1
P P
1 count * P
=
−
(2)
An adaptive RED (ARED) mechanism cognizant of the number of active connections can provide significant benefits in terms of decreasing packet loss and increasing network utilization. Since early detection algorithms become more effective as round trip times increase, it is expected that the performance improvement will become even more significant as the network grows. ARED will differ from RED in setting maxp which is a dynamic value depends on traffic load. Other parameters are the same in the two mechanisms.
Fig.1: The simulator network topology
Average length of RED fluctuates considerably as it follows the fluctuations of the instantaneous queue length, because of this; the marking probability of RED fluctuates considerably as well. In contrast, the marking probability of BLUE converges to a value that results in a rate of congestion notification that prevents packet loss and keeps link utilization high. In fact, the only situation where BLUE cannot prevent sustained packet loss is when every packet marked, but the offered load still overwhelms the bottleneck link.
A simple way of comparing an arriving packet with a recent other packet is to compare it with a packet still in the buffer. This makes it impossible to compare packets more than one buffer drain time apart. To give the system longer memory, the Stabilized RED (SRED) designer augments the information in the buffer with a "Zombie list", where this list represents a list of M recently seen flows, with the following extra information for each flow in the list: a "count" and a "time stamp".
The zombie list starts out empty. As a packet arrives, as long as the first list is not full, for every arriving packet, the packet flow identifier (source address, destination address, etc.) Added to the list, the count of the zombie set to zero, and its timestamp is set to the arrival time of the packet. Once the zombie list is full, it works as follows: whenever a packet arrives, it is compared with a randomly chosen zombie in the zombie list. For more details refer to[5-8].
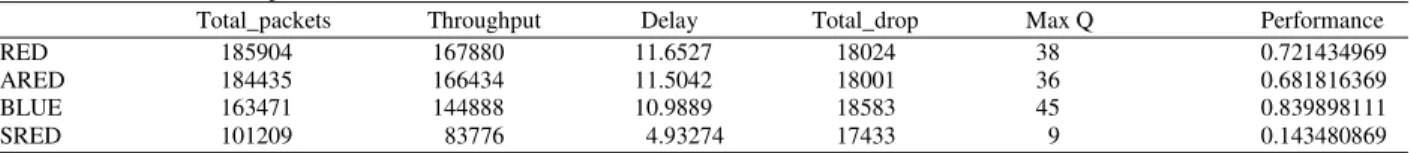
New approach for estimating the network performance: The network topology which has been used in our analysis and evaluation of network performance is shown in Fig. 1. Our network simulator was implemented for four strategies of congestion handling in TCP network, these strategies are: RED, ARED, BLUE-RED and SRED. Table 1 depicts the final snapshot of the simulator. The simulator is built using the C++ programming language.
Table 1: Final simulator snapshot
Total_packets Throughput Delay Total_drop Max Q Performance
RED 185904 167880 11.6527 18024 38 0.721434969
ARED 184435 166434 11.5042 18001 36 0.681816369
BLUE 163471 144888 10.9889 18583 45 0.839898111
SRED 101209 83776 4.93274 17433 9 0.143480869
A connection between each node and the gateway has 2ms delay time, the gateway has 1ms delay time, and the bottleneck link between the gateway and sink has 45ms delay time for delivering the packet to the sink. Node 1 starts propagation at a time roughly equal to 0, node 2 at time 0.1Sec., node 3 at time 0.2sec. And node 4 starts its propagation at time 0.3Sec.
The performance of the above network can be evaluated by our proposed formula given in Eq. 3, where the investigation process of this formula comes after the formula:
(
) (
)
(
)
th * q de * dop P
to * buf −
= (3)
Where:
P : The network performance th : Instantaneous throughput buf : Buffer size
de : Instantaneous average delay dop : Current total packets dropped to : Total generated packets q : Actual queue size
In order to derive as well as proven the formula given in Eq. 3, we say that basically the following criteria should be satisfied:
P ∞ th (4)
P ∞ ut (5)
P ∞ 1
de (6)
P ∞ 1
loss (7)
From relations (4) to (7), we see that the performance is linearly proportional with both throughput and link utilization. On the other hand, performance is inversely proportional with the average delay and loss rate.
Another set of relations relative to the network delay is given below:
gde ≤ de ≤ buf * gde (8)
0 ≤ th ≤ to (9)
0 ≤ ut ≤ buf (10)
0 ≤ loss ≤ to (11)
From the above inequalities given in relations (8 to 11), we see that the delay ranged from gde (gateway delay time) to (buf * gde), where de is the required time for a packet to be processed in the gateway. Delay equals gde in the best cases where the packet needs to enter the queue and waits for handling in the gateway, and it is equal to (buf * gde) in the worst case when q becomes full and equal to the buffer size.
The second important parameter evaluated in our study called the throughput. This parameter ranged from "0" when there are not packets departures from the gateway to "t0" when all packets generated successfully departure from the gateway.
The third parameter evaluated in this study is called link utilization which equals to "0" when the buffer enters the idle period and equal to the "buff" in the best cases when queue length equals to the buffer size (buffer is full).
The fourth parameter evaluated in this study is called loss packets, where loss packets counter equal to "0" when no packets dropped from the gateway due to buffer overload or other drop condition occurred. In the worst case, all propagated packets are dropped, hence, counter equal to the total packets propagated from sources. So, performance product can be estimated from Eq. 12 where pp is the performance product:
Pp = (th * q) - (loss * de) (12)
Performance product will be in the best case when throughput equal to the total generated packet counter, q equal to the buffer size, loss which is a counter value equal to "0", and delay product equal to the buffer delay time. Therefore, Eq. 12 will look like Eq. 13 given by:
Pp = (to * buf) (13)
Performance product will be in the worst case when throughput equals to zero (no packet departure from the gateway), delay equals to (buf*gde), link utilization equals zero (no propagated packet arrives in the queue), and loss packets equal to the total number of packets counter. When all arrived packets dropped due to buffer overflow, Eq. 13 will be looking like Eq. 14 give in:
Pp = - (to * de) (14)
increasing with time until the limit of simulation, unless the system starts to functioning well and some packet departure from the gateway.
Performance evaluation of the proposed approach:
TCP congestion avoidance techniques each of which has its own performance percentage. When we look at the final snapshot of our simulator shown in Table 1, we can take the estimated performance for each strategy. Here, we take the maximum queue length as an indicator of link utilization.
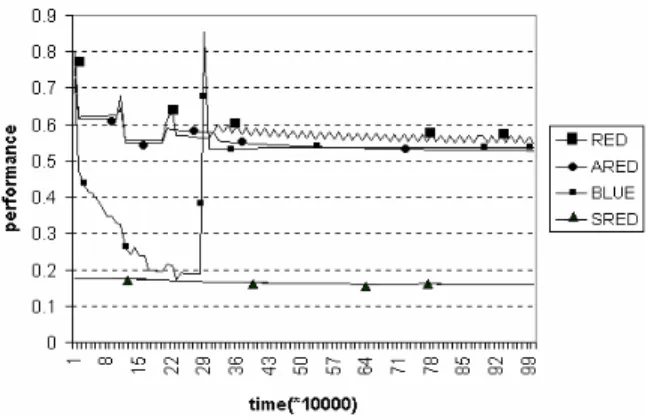
Figure 2 depicts the performance for each strategy. From this figure, we see that SRED has the lowest performance within the total simulation time. SRED performance will never exceed 0.17. BLUE performance frequented from 0.17 to 0.85 and it has a smooth performance over time equal to 0.29Sec. Therefore, BLUE takes the third order with respect to the performance. RED and SRED still behave in the same manner and they give a better performance than the other strategies with more pretty to RED.
An enhancement technique for TCP network quality: Equation that governs the AQM performance can be written as:
(
th * q)
NQPen
= (15)
Think of a network with no delay time and no packet lost, the network becomes stable and the network throughput equals to the total propagated packets. Therefore, the link utilization in this case will be in the best case and given by Eq. 15. Since there is no delay time, we do not need a larger buffer; just we need a buffer with size equal to 1, which is to hold temporally the arrived packet to the gateway. Therefore, de and dop factors become equal to 0 in Eq. 3.
A new factor generated from the fraction of Eq. 3 is denoted by the network energy (en). When a network continues in stable state till the end of operation time, the en parameter equals to the product of parameter t0 which is calculated in Eq. 16 by buf which is the buffer size. Despite of the small buffer that is equal to 1 in the stable network, we must multiply the two parameters in the proposed topology by the available buffer size not by 1 because it is the indicator used to represent the link utilization. In our topology, the buffer size equal to 46 packets:
1 i
o w1 wi
1 i
n wn
n
time time
t max * ... max *
RTT RTT
time ... max *
RTT
= + +
+ + (16)
Where: i=1, 2, 3… n
Fig. 2: Network performance diagram
Table 2: Network Quality parameter
Strategy NQP
RED 0.0979
ARED 0.0920
BLUE 0.1000
SRED 0.0116
maxwi: The maximum available window size of node i timei : The period of time that node I authorized to
propagate a packet
RTTi : The round trip time of node i n : The number of available nodes
Table 2 depicts the NQP for each of the four strategies with respect to the network topology shown in Fig. 1, where to factor equals 1.41×10⁶.
From Table 2, we found that BLUE strategy has the highest Network Quality Parameter (NQP) with a value of 10%. SRED gives the lowest AQP. RED and ARED behave in the same manner and RED still the best.
CONCLUSION AND FUTURE WORK
Our study aimed to introduce a new approach for estimating the TCP network performance. There are four parameters used in evaluating the performance of the network: link utilization, network throughput, average network delay and the loss rate. We build a simulator to generate the observation about the network behavior using four strategies follow the AQM approach of congestion handling in TCP networks. These four strategies are: RED, SRED, ARED and BLUE RED. After that, we estimate the performance for each strategy using the new approach of performance estimation. Another important step that we introduce is the concept of Network Quality Parameter (NQP), and consequently implements it over the four AQM strategies. Through the O/P of the presented work, we conclude the following:
the network that implement one of each congestion handling strategy.
* SRED has the lowest performance during the simulation time. SRED performance will never exceed 0.17. BLUE performance frequented from 0.17 to 0.85 and it has a smooth performance over time of 0.29Sec. Therefore, BLUE takes the third order with respect to the performance. RED and SRED still behave in the same manner and they give a better performance than other strategies with more pretty to RED.
* BLUE strategy has the highest Network Quality Performance (NQP) with 10% value. SRED gives the lowest AQP. RED and ARED behave in the same manner and RED still the best.
As a future work, we recommend using some type of intelligent techniques as AI or Fuzzy Logic or expert system to make the comparison between the various RED with respect to the network performance parameter and decide which one of REDs is the optimum.
REFERENCES
1. Ryu, S. et a1., 2003. Advances in Internet Congestion Control. IEEE.
2. Li, M. and H. Wang, 2002. Study of Active Queue Management Algorithms. CSE952, UNL.
3. Floyed, S. and V. Jacobson, 1993. Random Early Detection Gateways for Congestion Avoidance. IEEE/ACM Trans. Net.
4. Feng, W. et al., 1999. A Self-Configuration RED Gateway. University of Michigan.
5. Feng, W. et al., 1999. BLUE: a New Class of Active Queue Management Algorithms. University of Michigan.
6. Ott, T.J. et al., 1999. SRED: Stabilized RED. Bellcore.
7. William Stallings, 2004. Data and Computer Communications. Fourth Edn. Prentice-Hall, Inc. 8. Behrouz, A.F., 2003. Data Communications and