www.ocean-sci.net/12/1237/2016/ doi:10.5194/os-12-1237-2016
© Author(s) 2016. CC Attribution 3.0 License.
High-resolution monitoring of marine protists based on an
observation strategy integrating automated on-board
filtration and molecular analyses
Katja Metfies1, Friedhelm Schroeder2, Johanna Hessel1, Jochen Wollschläger2, Sebastian Micheller1, Christian Wolf1, Estelle Kilias1, Pim Sprong1, Stefan Neuhaus3, Stephan Frickenhaus3, and Wilhelm Petersen2
1Helmholtz Young Investigators Group PLANKTOSENS, Alfred Wegener Institute Helmholtz Centre for Polar and Marine Research, 27570 Bremerhaven, Germany
2In-situ Measuring Systems, Helmholtz Zentrum Geesthacht Centre for Materials and Coastal Research, 21502 Geesthacht, Germany
3Scientific Computing, Alfred Wegener Institute Helmholtz Centre for Polar and Marine Research, Bremerhaven, 27570 Bremerhaven, Germany
Correspondence to:Katja Metfies (katja.metfies@awi.de)
Received: 30 April 2016 – Published in Ocean Sci. Discuss.: 23 May 2016
Revised: 30 August 2016 – Accepted: 12 September 2016 – Published: 22 November 2016
Abstract. Information on recent biomass distribution and biogeography of photosynthetic marine protists with ade-quate temporal and spatial resolution is urgently needed to better understand the consequences of environmental change for marine ecosystems. Here we introduce and review a molecular-based observation strategy for high-resolution as-sessment of these protists in space and time. It is the re-sult of extensive technology developments, adaptations and evaluations which are documented in a number of different publications, and the results of the recently completed field testing which are introduced in this paper. The observation strategy is organized at four different levels. At level 1, sam-ples are collected at high spatiotemporal resolution using the remotely controlled automated filtration system AUTOFIM. Resulting samples can either be preserved for later labora-tory analyses, or directly subjected to molecular surveillance of key species aboard the ship via an automated biosensor system or quantitative polymerase chain reaction (level 2). Preserved samples are analyzed at the next observational lev-els in the laboratory (levlev-els 3 and 4). At level 3 this involves molecular fingerprinting methods for a quick and reliable overview of differences in protist community composition. Finally, selected samples can be used to generate a detailed analysis of taxonomic protist composition via the latest next generation sequencing technology (NGS) at level 4. An
over-all integrated dataset of the results based on the different analyses provides comprehensive information on the diver-sity and biogeography of protists, including all related size classes. At the same time the cost of the observation is opti-mized with respect to analysis effort and time.
1 Introduction
productivity (NPP) (Field et al., 1998) and is fundamental for any marine ecosystem function or service. As a con-sequence, changes in phytoplankton community structures and biogeography as a response to climate change are cur-rently topical issues in marine ecology. Moreover, marine phytoplankton is very well suited to serve as an indicator of climate change (Nehring, 1998), because its dynamics are closely coupled to environmental conditions (Acevedo-Trejos et al., 2014). Despite the necessity and advantage of using marine phytoplankton to assess consequences of cli-mate change, the task is also challenging in various ways. Marine phytoplankton distribution displays high spatial het-erogeneity, or “patchiness” (Mackas et al., 1985), and a pro-nounced seasonality as a consequence of physical and chem-ical oceanographic processes (Boersma et al., 2016; Bresnan et al., 2015). Furthermore, there are difficulties with the tax-onomic surveillance of species in the pico- or nano-fraction, related to their cell size and insufficient morphological fea-tures (e.g., Caron et al., 1999). As a consequence it is very challenging to provide information on composition, occur-rence, and dynamics of phytoplankton with adequate spatial and temporal resolution. Together with the difficulties of fi-nancially supporting and maintaining long-term series, these challenges might account for the relatively small number of marine phytoplankton long-term time series worldwide. Among them, one long-lasting time series, the Helgoland Roads time series, is maintained by the Alfred Wegener In-stitute Helmholtz Centre for Polar and Marine Research at the island Helgoland in the German Bight (North Sea). The dataset comprises information on abundance of phytoplank-ton on a daily basis since 1962 (Kraberg et al., 2015; Wilt-shire et al., 2009). However, it does not provide information on the abundance of the smallest phytoplankton species and is restricted to one sampling point. The latter restriction is overcome by a second major long-term marine observation programme that is operated by the Sir Alistair Hardy Foun-dation for Ocean Science in Plymouth, UK: the Continuous Plankton Recorder (CPR) survey’s marine observation pro-gramme (McQuatters-Gollop et al., 2015). Together with its sister surveys it has provided large-scale information on ma-rine plankton distribution, mainly in the North Atlantic and the North Sea, since the first surveys in 1931. Unfortunately, the CPR approach is restricted to zooplankton and larger phy-toplankton (e.g., diatoms). Again, the ecologically relevant pico-phytoplankton fraction is omitted. However, the smaller phytoplankton is to a certain degree included in the sur-veys of the FerryBox project implemented by the Helmholtz Centre Geesthacht in the North Sea. A FerryBox is an au-tonomous device located on “ships of opportunity” that has the capability to autonomously generate information on the plankton composition, and a number of other parameters, of the North Sea (Petersen, 2014). Here, phytoplankton is char-acterized on the basis of the pigment composition present, which is estimated via multi-channel fluorescence measure-ments. All phytoplankton groups and size fractions are
in-cluded in this analysis, but this approach is only suited for the identification of larger taxonomic algal groups. Furthermore, spectrally similar groups (e.g., diatoms and dinoflagellates) cannot be distinguished by this method. Thus the FerryBox project lacks information on species composition of phyto-plankton.
fingerprint-ing method automated ribosomal intergenic spacer analysis (ARISA) is a quick, cost-effective, and meaningful method of determining overall variability in phytoplankton commu-nity composition (Kilias et al., 2015) that is independent of the size or morphology of target organisms. In contrast, NGS of ribosomal genes allows high-resolution, taxon-specific as-sessments of protist communities, including their smallest size fractions and the rare biosphere (de Vargas et al., 2015; Kilias, 2014b, c).
Here, we introduce a combined molecular-based observa-tion strategy that allows observaobserva-tion of current phytoplank-ton composition, distribution, and dynamics at adequate spa-tial and temporal scales. The resulting datasets can be used to estimate possible alterations related to climate or environ-mental change. Our strategy is the result of technical de-velopments and the integration of the latest sampling and molecular tools in an advanced molecular-based observation approach that will optimize marine microbial observation in general, while phytoplankton was the focus of our develop-ments. In the future our molecular observation strategy is intended to cut down surveillance costs and provide infor-mation on marine microbial biodiversity with unprecedented resolution. It is a development of the Helmholtz Young Inves-tigators Group PLANKTOSENS (Assessing Climate Related Variability and Change of Planktonic Foodwebs in Polar Re-gions and the North Sea), carried out within the framework of COSYNA (Coastal Observing System for Northern and Arc-tic Seas). Here, we review major published results that lead to the development of the molecular observation strategy and demonstrate the applicability of newly developed sampling technology within the observation strategy. Special empha-sis was put on observation of Arctic pico-phytoplankton that constitutes a major contribution to pelagic Chl a biomass
during summer (Metfies et al., 2016).
2 Material and methods 2.1 Sampling
Water samples analyzed in this study were collected during expeditions PS85 (June 2014) and PS96 (May/June 2015) of RVPolarsternto the Arctic Ocean. Samples from deeper wa-ter layers containing the deep chlorophyll maximum (DCM) were taken with a rosette sampler equipped with 24 Niskin bottles (12 L per bottle) and sensors for Chlafluorescence,
temperature, and salinity (CTD). Samples collected via CTD were taken during the up-casts at the vertical maximum of Chl a fluorescence determined during the down-casts. The
sampling depths varied between 10 and 50 m. Two liters of water subsamples were taken in PVC bottles from the Niskins. Particulate organic matter for molecular analyses was collected by sequential filtration of one water sample through three different mesh sizes (10, 3, 0.4 µm) on 45 mm diameter Isopore Membrane Filters at 200 mbar using a
Mil-lipore Sterifil filtration system (MilMil-lipore, USA). Subsequent to sampling, the filters were stored at−20◦C until further
analyses.
Additional samples were collected from a depth of∼10 m with the automated filtration device for marine microorgan-isms (AUTOFIM), which is coupled to the ship’s pump sys-tem. Fitting and programming of the device does not require special expertise if it is done according to the manufacturer’s protocol. All steps related to the filtration process, including application of Lysis Buffer RLT (Qiagen, Germany), were carried out automatically by AUTOFIM. In this study, two liters of sea water were collected and filtrated on a filter with 0.4 µm pore size at 200 mbar. Subsequent to filtration, par-ticulate organic matter on the filter was re-suspended with 600 µL Lysis Buffer RLT (Qiagen, Germany) and stored at −80◦C until further processing in the laboratory. The
filtra-tion device was cleaned after each filtrafiltra-tion step by rinsing the device with fresh water.
2.2 Environmental parameters
Standard oceanographic parameters (salinity, temperature, Chl a fluorescence, turbidity, chromophoric dissolved
or-ganic matter, dissolved oxygen, pH, nutrients) were mea-sured at the sampling sites by the FerryBox System (Pe-tersen, 2014) deployed on board RV Polarstern. The mea-surement interval was 1 min, and the water intake of the sys-tem was identical to the water supply of AUTOFIM. To pre-vent biofouling of the sensors, the FerryBox performed a cleaning cycle including an acid wash and freshwater rins-ing once per day.
2.3 DNA isolation
Isolation of genomic DNA from the field samples was car-ried out using the E.Z.N.A TM SP Plant DNA Kit Dry Spec-imen Protocol (Omega Bio-Tek, USA), following the manu-facturer’s protocol. The resulting DNA-extracts were stored at−20◦C.
2.4 DNA quality
The integrity of the genomic DNA isolated from water sam-ples collected with AUTOFIM was assessed using the Agi-lent DNA 7500 kit (AgiAgi-lent Technologies, USA) according to the manufacturer’s protocol. A volume of 1 µL DNA was applied to the flow cell.
2.5 ARISA
tran-scribed spacer 1 (ITS1), amplified via a specific primer set from genomic DNA extracted from field samples.
2.6 454 pyrosequencing
Sequencing of protist communities via 454 pyrosequencing was based, in all studies reviewed in this paper, on amplifi-cation of a∼670 bp fragment of the 18S rDNA containing the hypervariable V4 region. Sequence library preparation and data analysis were described previously in the studies contributing to the development of the molecular observa-tion strategy (Kilias et al., 2013; Metfies et al., 2016). Thus, for more detailed information, the reader is referred to these publications.
2.7 Quantitative PCR assay
The quantitative PCR was carried out in a nested two-step approach. We used this nested approach because it mini-mized the variability between technical replicates of qPCR data obtained from analyses of field samples. The applicabil-ity of the nested approach was evaluated by a comparison of qPCR data with manual counts ofPhaeocystis pouchetiiin field samples (data not shown). In the first step total eukary-otic 18S rDNA was amplified from a positive control (ge-nomic DNA Phaeocystis pouchetii), a negative control (no template), and genomic DNA isolated from field samples using the universal primer set 1F-(5′
-AAC TGG TTG ATC CTG CCA GT-3′
)/1528R-(5′
-TGA TCC TTC TGC AGG TTC ACC TAC-3′) (modified after Medlin et al., 1988).
PCR amplifications were performed in a 20 µL volume in a thermal cycler (Eppendorf, Germany) using 1×HotMaster Taq buffer containing Mg2+
, 2.5 mM (5′
Prime), 0.5 U Hot-Master Taq polymerase (5′
Prime, Germany), 0.4 mg mL−1 BSA; 0.8 mM (each) dNTP (Eppendorf, Germany), 0.2 µM of each primer (10 pmol µL−1), and 1 µL of template DNA (20 ng µL−1). The amplification was based on 35 cycles, con-sisting of 94◦
C for 1 min, 54◦
C for 2 min, and 72◦
C for 2 min, followed by 1 min denaturation at 94◦
C and final-ized by a final extension of 10 min at 72◦
C. Subsequently PCR products were purified using the QIAquick PCR purifi-cation kit (Qiagen, Hilden, Germany). In the second step a qPCR-assay was carried out using a species-specific primer set 82F-(5′
-GTG AAA CTG CGA ATG GCT CAT-3′
)/P1np-(5′-CGG GCG GAC CCG AGA TGG TT-3′) for Phaeocys-tis pouchetii. The quantitative PCR assays were performed in triplicate in a 20 µL volume in a 7500 Fast Real-Time PCR System (Life Technologies Corporation; Applied Biosys-tems, USA) using 1×SYBR Select Mastermix (Life Tech-nologies, USA), 0.2 µM of each primer (10 pmol µL−1), and 2 µL of the purified 18S rDNA PCR fragment. The amplifica-tion was based on 40 cycles, consisting of 95◦
C for 10 min, 95◦
C for 15 s, and 66◦
C for 1 min. The quantitative PCR assay was calibrated with a dilution series of a laboratory culture ofPhaeocystis pouchetii(Fig. 4). Based on this
cal-ibration CT values were transformed into cell numbers us-ing the followus-ing equation: CT= −2.123 ln (cell numbers) +38.788.
3 Results and discussion
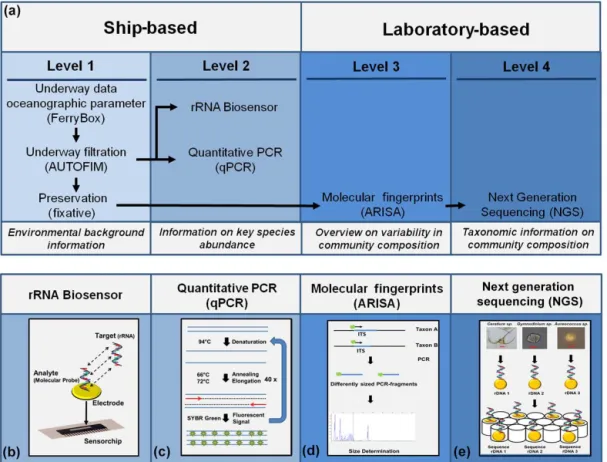
3.1 Overview of molecular-based observation strategy The molecular-based observation strategy that we present here is organized into 4 different levels (Fig. 1). At level 1, samples are collected in high spatiotemporal resolution us-ing AUTOFIM (Fig. 2). The samplus-ing system can either be deployed on a fixed monitoring platform or aboard a ship (research vessel or ship of opportunity) without the need for a highly trained person. Samples can be preserved with a preservation buffer (e.g., DNAgard, Biomatrica, USA) for later laboratory analyses, or directly subjected to molecular surveillance of key species aboard the ship via an automated biosensor system or quantitative polymerase chain reaction (level 2). Direct analyses aboard ships provide near-real-time information on abundance and distribution of ton key species, which can be used to optimize phytoplank-ton sampling for detailed high-resolution analyses of over-all phytoplankton composition during an ongoing sampling campaign. The resulting preserved samples will be analyzed at the next observational levels in the laboratory (levels 3 and 4). At level 3 this involves molecular fingerprinting methods that provide a quick and reliable overview of differences in protist community composition of the samples in a given ob-servation area or time period. Furthermore, this information can be used to select representative samples for detailed anal-ysis of taxonomic protist composition via the latest next gen-eration sequencing at level 4. An overall integrated dataset of the results based on the different analyses provides com-prehensive information on the diversity and biogeography of protists, including all related size classes. At the same time, the cost of the observation is optimized with respect to anal-ysis effort and time. Sampling based on the autonomous fil-tration device is more cost efficient because labor costs and the requirement of ship space and time are reduced.
Figure 1. (a) Overview of the smart observation strategy which is organized into four different levels: level 1: samples are collected in transit or at monitoring sites using the remotely controlled automated filtration system AUTOFIM; level 2: direct molecular surveillance of key species aboard the ship via an automated biosensor system or quantitative polymerase chain reaction; level 3: preserved samples are analyzed via molecular fingerprinting methods (e.g., ARISA) that provide a quick and reliable overview of differences in protist community composition of the samples in a given observation area or time period; level 4: detailed analysis of taxonomic protist composition in selected samples via the latest next generation sequencing.(b–e)Schematic diagrams illustrating the analyses used in the smart observation strategy.
by the Alfred Wegener Institute for Polar and Marine Re-search to carry out regular observations of the ecosystem in the eastern Fram Strait (Soltwedel, 2005). In the following, the different parts of the observation strategy are presented in detail.
3.1.1 Automated remotely controlled filtration system
The remotely controlled automated filtration system for ma-rine microbes (AUTOFIM) is the core of the observation strategy. The filtration system (Fig. 2) can be operated au-tonomously aboard research vessels or ships of opportunity. AUTOFIM allows filtration of a sampling volume up to five liters from the upper water column. In total, 12 filters can be taken and stored in a sealed sample archive. Prior to stor-age, a preservative such as Lysis Buffer RLT (Qiagen, Ger-many) is applied to the filters, preventing degradation of the sample material, which can be used for molecular or bio-chemical analyses. Exchanging the sample archive is a quick and easy task, which makes it feasible for lay persons from the ships’ staff to take care of the automated filtration. This
Figure 2. (a)AUTOFIM installed on board RVPolarstern(1: Sam-ple reservoir; 2: Filtration; 3: Archive for preserved filters).
(b)Filtration-module (1: Filter stacker; 2: Filtration cap).
3.1.2 Automated ribosomal intergenic spacer analysis (ARISA)
ARISA provides information on variability in protist com-munity structure in larger sample sets at reasonable costs and effort. In an ARISA the community is characterized by its community profile, which is based on the composi-tion (presence/absence) of differently sized DNA fragments. The DNA fragments are a result of the amplification of the internal transcribed spacer region of the ribosomal operon, which displays a high degree of taxon-related variability in its length. ARISA profiles reflect taxon-specific differences observed in NGS datasets (Kilias et al., 2015). In the devel-opmental phase of the molecular observation strategy, this method was used in a number of different studies to bet-ter understand variability of Arctic marine protist commu-nities in relation to environmental conditions and ocean cur-rents. Based on ARISAs, we identified large-scale patterns of protist biogeography that were tightly connected to ambient water masses, ocean currents, and sea-ice coverage (Kilias et al., 2014a; Metfies et al., 2016; Wolf et al., 2014b). We
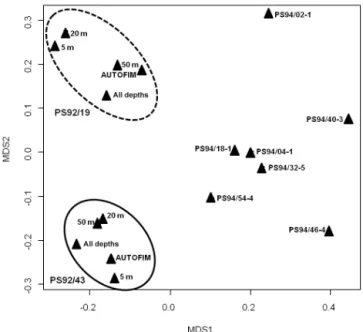
suggest using ARISA as part of the molecular observation strategy to identify biogeographic or biodiversity patterns in large sample sets, e.g., those collected via AUTOFIM. Identification of patterns in phytoplankton biogeography or biodiversity requires analyses of large sample sets, because spatial heterogeneity of marine phytoplankton is consider-able, while the vertical dimension is of particular importance, since differences in vertical abundance and composition of phytoplankton impact primary production, export processes, and energy transfer to higher trophic levels (Leibold, 1990). Vertical distribution of marine protists is determined by op-posing resource gradients and mixing conditions (Mellard et al., 2011). With respect to this it was necessary to evaluate how representative samples from 10 m depth might be of the photic zone in the underlying water column. This is impor-tant in case AUTOFIM is applied to study large-scale bio-geographic patterns of marine protists. Acknowledging the potential of ARISA to quickly generate meaningful infor-mation on variability between protist samples, we used this methodology in this study to assess the similarity of phyto-plankton community composition in samples from the upper water column collected with AUTOFIM and in samples col-lected in deeper water layers via CTD at the same location. The ARISA patterns obtained from deeper water layers (20, 50 m) are highly similar to those obtained from the samples collected with AUTOFIM. The samples collected with AUT-OFIM at stations PS92/19 and PS92/43 clustered together with the individual samples collected at other depths at the same location (5, 20, 50 m) and with the integrated signal from the CTD sampling (all three depths) at this location (Fig. 3). This result suggests that qualitative information on phytoplankton community composition, based on sampling with AUTOFIM, can be considered as representative of the photic layer of the water column. This might be attributed to the observation that geography and ambient water masses have a major impact on qualitative composition of marine plankton communities on a larger scale, with plankton com-munities being partially structured according to the basin of origin (de Vargas et al., 2015; Metfies et al., 2016).
3.1.3 Next generation sequencing (454 pyrosequencing; Illumina)
Figure 3. MetaMDS plot (non-metric multidimensional scaling plot) of ARISA fingerprints generated from samples collected via Niskin bottles coupled to a CTD rosette and AUTOFIM. The closer the samples are located to each other in the metaMDS plot, the more similar the ARISA profiles of the samples are. The label of the samples gives information on the cruise leg (PSXX) and the station (/XX). Samples were collected during expeditions PS92 and PS94 of RV Polarsternto the Arctic Ocean during summer 2015. The samples collected during PS94 serve as an outgroup in this analy-sis.
more organisms, even rare species from large-scale biodiver-sity surveys (Sunagawa et al., 2015). We assessed the validity of 454 pyrosequencing by evaluating the sequence datasets with results obtained via other methods, such as 18S clone libraries, HPLC, and microscopic counts. The samples an-alyzed in the course of this evaluation originated from the same Niskin bottle of a respective CTD cast. In our datasets pyrosequencing data were in good agreement with informa-tion on community composiinforma-tion generated by high-pressure liquid chromatography (HPLC) or clone libraries (Kilias et al., 2013; Wolf et al., 2013). During the past six years, we used 454 pyrosequencing to determine the variability of pro-tist community structure in the Fram Strait, in the area of the deep-sea long-term observatory Hausgarten, and the central Arctic Ocean (Kilias et al., 2014a; Metfies et al., 2016). Over-all, our data revealed thatPhaeocystis pouchetiiis an impor-tant contributor to Arctic protist communities, particularly to the pico-eukaryote community composition. In 2009 the species constituted up to 29.6 % of the sequence assemblage retrieved from pico-eukaryote samples in that area (Kilias et al., 2014b). A larger survey of Arctic protist community composition in 2012, including the Fram Strait and larger parts of the central Arctic Ocean, confirmed these observa-tions and identifiedPhaecystis pouchetiionce again as an im-portant contributor to Arctic pico-eukaryote Chla biomass.
The latter constituted between 60 and 90 % of Chlabiomass
during summer 2012 in the Arctic Ocean (Metfies et al., 2016). This comprehensive sequence-based information on phytoplankton community composition was very well suited to serve as a basis for the development of molecular probes that can be used for molecular surveillance with molecular sensors or qPCR.
3.1.4 Development and evaluation of
molecular-probe-based methods: molecular sensors or qPCR
abun-Figure 4.Assessment ofPhaeocystis pouchetiiin the Fram Strait.(a)Calibration ofPhaeocystis pouchetii-specific qPCR assay with a dilu-tion series of laboratory cultures. The CT value is significantly correlated with cell numbers.(b)Abundance ofPhaeocystis pouchetiiin the Fram Strait. The dots and the associated numbers represent sampling sites and associated station numbers of expedition ARKXXVIII(PS85) of RVPolarsternin summer 2014, while cell numbers/liter are reflected by different colors.(c)Principal component analysis including en-vironmental parameters (temperature, salinity, Chlabiomass, and sea-ice coverage) and abundance ofPhaeocystis pouchetii. Triangles and associated numbers represent sampling sites and associated station numbers of expedition ARKXXVIII (PS85) of RVPolarsternin summer 2014. HG4 indicates the central station of the deep-sea long-term observatory Hausgarten in the Fram Strait. The eigenvalues indicate the proportion of variance explained by different dimensions in the diagram. The black bars in the histogram reflect thexaxis and theyaxis. Here∼80 % of variance is explained in this two-dimensional diagram of the PCA (xaxis: 50.29 %;yaxis: 30.08 %).
dance ofPhaeocystis pouchetiiin Arctic waters using a spe-cific primer set for qPCR. The qPCR values were calibrated against defined numbers of laboratory cultures (Fig. 4) to al-low quantification ofPhaeocystis pouchetiivia this method. During expedition PS85 of RVPolarsternin June 2014, we used qPCR on board to determine the abundance of Phaeo-cystis pouchetii on a transect through the Fram Strait at ∼79◦N (Fig. 4). The results of our survey suggest that abun-dance of Phaeocystis pouchetiiin the Fram Strait is deter-mined by water mass properties such as salinity, ice cover-age, and water temperature. Salinity is positively correlated with abundance ofPhaeocystis pouchetii. The abundance of Phaeocystis pouchetiiwas higher in Atlantic waters, which are characterized by higher salinities in the range of 33– 34 PSU, than in polar waters of the Fram Strait, which are characterized by salinities around 31 PSU. In Atlantic Wa-ters the average cell number of Phaeocystis pouchetiiwas ∼3.5 times higher than the average cell number in polar wa-ters of the Fram Strait. Furthermore, Chlabiomass appears
to be correlated with abundance of Phaeocystis pouchetii. Our findings are in agreement with previous studies that reported blooms ofPhaeocystis pouchetii in waters around Svalbard with cell abundances in a similar range as observed in this study (Wassmann et al., 2005). In 2012, we carried out a large-scale study to survey the biogeography of marine
protists in the Arctic. This survey included a comprehen-sive NGS-based analysis of community composition along 79◦
N in the Fram Strait in June and later in the season in the Nansen Basin and Amundsen Basin. Overall, the find-ings of 2014, suggesting a positive correlation of Atlantic water properties (e.g., higher salinity and lower ice coverage with high abundance ofPhaeocystis pouchetii), are in agree-ment with the previous study of 2012. This study also found a positive correlation in agreement with the findings of 2014, even though sequence abundance of Phaeocystis pouchetii was more evenly distributed in the Fram Strait in 2012 (Met-fies et al., 2016). This might be attributed to the complex cur-rent system in the area. Overall, qPCR carried out on board provided a near-real-time overview of the distribution of a protist key species during expedition PS85.
4 Conclusions
ship-based automated filtration, online measurements of oceano-graphic parameters, and different molecular analyses. On the one hand, our approach provides near-real-time information on phytoplankton key species abundance in relation to envi-ronmental conditions already on board. On the other hand, it provides detailed information on variability in the total phytoplankton community composition based on compre-hensive, laboratory-based molecular analyses such as molec-ular fingerprinting methods and NGS. This information can be subsequently correlated with information on the physical and chemical marine environment and has excellent poten-tial to complement other hierarchically organized observa-tion strategies as described, for example, for the detecobserva-tion of marine hazardous substances and organisms (Zielinski et al., 2009). In summary, our molecular observation strategy is a significant contribution to refining regular assessment of consequences of ongoing environmental change for marine phytoplankton communities with respect to adequate spatial, temporal, and taxonomic resolution.
5 Data availability
Raw data of the molecular assessments presented in this pub-lication were not deposited in public repositories, because there is no repository that archives raw data of molecular fin-gerprinting analyses or quantitative PCR.
Acknowledgements. This work was supported by the Coastal Observing System for Northern and Arctic Seas (COSYNA), institutional funds of the Alfred Wegener Institute for Polar and Marine Research, Bremerhaven, and funds of the Helmholtz Zentrum Geesthacht Centre for Materials and Coastal Research. The Initiative and Networking Fund of the Helmholtz Association financed the Helmholtz University Young Investigators Group PLANKTOSENS (VH-NG-500). We thank the crew of RV Po-larsternfor excellent support during the work at sea. Furthermore we thank Kerstin Oetjen, Swantje Rogge and Christiane Lorenzen for great technical assistance. Annegret Müller and Uwe John are acknowledged for excellent technical support of the fragment analysis.
The article processing charges for this open-access publication were covered by a Research
Centre of the Helmholtz Association.
Edited by: O. Zielinski
Reviewed by: two anonymous referees
References
Acevedo-Trejos, E., Brandt, G., Steinacher, M., and Merico, A.: A glimpse into the future composition of marine phytoplankton communities, Front. Mar. Sci., 1, doi:10.1146/annurev-marine-041911-111611, 2014.
Boersma, M., Gruner, N., Signorelli, N. T., Gonzalez, P. E. M., Peck, M. A., and Wiltshire, K. H.: Projecting effects of climate change on marine systems: is the mean all that matters?, P. R. Soc. B, 283, doi:10.1098/rspb.2015.2274, 2016.
Bowers, H. A., Brutemark, A., Carvalho, W. F., and Graneli, E.: Combining Flow Cytometry and Real-Time PCR Method-ology to demonstrate consumption by Prymnesium parvum, J. Am. Water Resour. As., 46, 133–143, doi:10.1111/j.1752-1688.2009.00397.x, 2010.
Bresnan, E., Cook, K. B., Hughes, S. L., Hay, S. J., Smith, K., Wal-sham, P., and Webster, L.: Seasonality of the plankton commu-nity at an east and west coast monitoring site in Scottish waters, J. Sea Res., 105, 16–29, doi:10.1016/j.seares.2015.06.009, 2015. Caron, D. A., Peele, E. R., Lim, E. L., and Dennett, M. R.: Pi-coplankton and nanoplankton and their trophic coupling in the surface waters of the Sargasso Sea south of Bermuda, Limnol. Oceanogr., 44, 259–272, doi:10.4319/lo.1999.44.2.0259, 1999. Comeau, A. M., Li, W. K. W., Tremblay, J. E., Carmack, E. C.,
and Lovejoy, C.: Arctic Ocean Microbial Community Structure before and after the 2007 Record Sea Ice Minimum, Plos One, 604, 6, doi:10.1038/srep00604, 2011.
de Vargas, C., Audic, S. Henry, N., Decelle, J., Mahe, F., Logares, R., Lara, E., Berney, C., Le Bescot, N., Probert, I., Carmichael, M., Poulain, J., Romac, S., Colin, S., Aury, J.-M., Bittner, L., Chaffron, S., Dunthorn, M., Engelen, S., Flegontova, O., Guidi, L., Horak, A., Jaillon, O., Lima-Mendez, G., Lukes J., Malviya, S., Morard, R., Mulot, M., Scalco, E., Siano, R., Vincent, F., Zin-gone, A., Dimier, C., Picheral, M., Searson, S., Kandels-Lewis, S., Acinas, S. G., Bork, P., Bowler, C., Gorsky, G., Grimsley, P., Hingamp, D., Iudicone, F., Not, H., Ogata, S., Pesant, J., Raes, M. E., Sieracki, S., Speich, N., Stemmann, L., Sunagawa, S., Weissenbach, J., Wincker, P., and Karsenti, E.: Eukaryotic plankton diversity in the sunlit ocean, Science, 348, 1261605, doi:10.1126/science.1261605, 2015.
Diercks, S., Metfies, K., and Medlin, L.K.: Development and adap-tation of a multiprobe biosensor for the use in a semi-automated device for the detection of toxic algae, Biosens. Bioelectron, 23, 1527–1533, doi:10.1016/j.bios.2008.01.010, 2008a.
Diercks, S., Medlin, L. K., and Metfies, K.: Colorimetric detection of the toxic dinoflagellate Alexandrium minutum using sandwich hybridization in a microtiter plate assay, Harmful Algae, 7, 137– 145, doi:10.1016/j.hal.2007.06.005, 2008b.
Doney, S. C., Ruckelshaus, M., Duffy, J. E., Barry, J. P., Chan, F., English, C. A., Galindo, H. M., Grebmeier, J. M., Hol-lowed, A. B., Knowlton, N., Polovina, J., Rabalais, N. N., Syde-man, W. J., and Talley, L. D.: Climate Change Impacts on Ma-rine Ecosystems, Annual Review of MaMa-rine Science, 4, 11–37, doi:10.1146/annurev-marine-041911-111611, 2012.
Field, C. B., Behrenfeld, M. J., Randerson, J. T., and Falkowski, P.: Primary production of the biosphere: Integrating ter-restrial and oceanic components, Science, 281, 237–240, doi:10.1126/science.281.5374.237, 1998.
Hugenholtz, P.: Exploring prokaryotic diversity in the genomic era, Genome Biology, 3, doi:10.1186/gb-2002-3-2-reviews0003, 2002.
Kilias, E., Kattner, G., Wolf, C., Frickenhaus, S., and Metfies, K.: A molecular survey of protist diversity through the central Arctic Ocean, Polar Biol., 61, 569–579, doi:10.1007/s00300-014-1519-5, 2014a.
Kilias, E. S., Noethig, E.-M., Wolf, C., and Metfies, K.: Pi-coeukaryote Plankton Composition off West Spitsbergen at the Entrance to the Arctic Ocean, J. Eukaryot. Microbiol., 33, 23466, doi:10.1111/jeu.12134, 2014b.
Kilias, E. S., Peeken, I., and Metfies, K.: Protist diversity in Arctic Sea Ice and Melt pond aggregates obtained by pyrosequencing – a short insight, Polar Res., 13, 74–80, doi:10.3402/polar.v33.23466, 2014c.
Kilias, E. S., Wolf, C., and Metfies, K.: Characterizing vari-ability in marine protist communities via ARISA fingerprints – a method evaluation, Limnol. Oceanogr.-Meth., 13, 74–80, doi:10.1002/lom3.10008, 2015.
Kraberg, A. C., Rodriguez, N., and Salewski, C. R.: Histori-cal phytoplankton data from Helgoland Roads: Can they be linked to modern time series data?, J. Sea Res., 101, 51–58, doi:10.1016/j.seares.2015.03.004, 2015.
Leibold, M. A.: Resources and predators can affect the vertical distributions of zooplankton, Limnol. Oceanogr., 35, 938–344, doi:10.4319/lo.1990.35.4.0938, 1990.
Mackas, D. L., Denman, K. L., and Abbott, M. R.: Plankton Patchiness-Biology in the physical vernacular, B. Mar. Sci., 37, 652–674, 1985.
McQuatters-Gollop, A., Edwards, M., Helaouet, P., Johns, D. G., Owens, N. J. P., Raitsos, D. E., Schroeder, D., Skinner, J., and Stern, R. F.: The Continuous Plankton Recorder survey: How can long-term phytoplankton datasets contribute to the assessment of Good Environmental Status?, Estuar. Coast. Mar. Sci., 162, 88– 97, doi:10.1016/j.ecss.2015.05.010, 2015.
Mellard, J. P., Yoshiyama, K., Litchman, E., and Klaus-meier, C. A.: The vertical distribution of phytoplankton in stratified water columns, J. Theor. Biol., 269, 16–30, doi:10.1016/j.jtbi.2010.09.041, 2011.
Medlin, L., Elwood, H. J., Stickel, S., and Sogin, M.L.: The characterization of enzymatically amplified eukaroytic 16S-like rRNA coding regions, Gene, 71, 491–499, doi:10.1016/0378-1119(88)90066-2, 1988.
Metfies, K. and Medlin, L. K.: Refining cryptophyte identifica-tion with DNA-microarrays, J. Plankton Res., 29, 1071–1075, doi:10.1093/plankt/fbm080, 2007.
Metfies, K., Gescher, C., Frickenhaus, S., Niestroy, R., Wichels, A., Gerdts, G., Knefelkamp, B., Wiltshire, K., and Medlin, L.: Contribution of the class Cryptophyceae to phytoplank-ton structure in the German Bight, J. Phycol., 46, 1152–1160, doi:10.1111/j.1529-8817.2010.00902.x, 2010.
Metfies, K., von Appen, W. J., Kilias, E., Nicolaus, A., and Noethig, E. M.: Biogeography and photosynthetic biomass of arctic marine pico-eukaroytes during summer of the record sea ice minimum 2012, Plos One, 11, e0148512, doi:10.1371/journal.pone.0148512, 2016.
Nehring, S.: Establishment of thermophilic phytoplankton species in the North Sea: biological indicators of climatic changes?, ICES J. Mar. Sci., 55, 818–823, doi:10.1006/jmsc.1998.0389, 1998.
Petersen, W.: FerryBox systems: State-of-the-art in Eu-rope and future development, J. Marine Syst., 140, 4–12, doi:10.1016/j.jmarsys.2014.07.003, 2014.
Quast, C., Pruesse, E., Yilmaz, P., Gerken, J., Schweer, T., Yarza, P., Peplies, J., and Gloeckner, F. O.: The SILVA ri-bosomal RNA gene database project: improved data process-ing and web-based tools, Nucleic Acids Res., 41, D590–D596, doi:10.1093/nar/gks1219, 2013.
Soltwedel, T.: HAUSGARTEN: multidisciplinary investigations at a deep-sea, long-term observatory in the Arctic Ocean, Oceanog-raphy, 18, 15, doi:10.5670/oceanog.2005.24, 2005.
Sunagawa, S., Coelho, L. P., Chaffron, S., Kultima, J. R., Labadie, K., Salazar, G., Djahanschiri, B., Zeller, G., Mende, D. R., Al-berti, A., Cornejo-Castillo, F. M., Costea, P. I., Cruaud, C., d’Ovidio, F., Engelen, S., Ferrera, I., Gasol, J. M., Guidi, L., Hildebrand, F., Kokoszka, F., Lepoivre, C., Lima-Mendez, G., Poulain, J., Poulos, B. T., Royo-Llonch, M., Sarmento, H., Vieira-Silva, S., Dimier, C., Picheral, M., Searson, S., Kandels-Lewis, S., Bowler, C., de Vargas, C., Gorsky, G., Grimsley, N., Hingamp, P., Iudicone, D., Jaillon, O., Not, F., Ogata, H., Pesant, S., Speich, S., Stemmann, L., Sullivan, M. B., Weissenbach, J., Wincker, P., Karsenti, E., Raes, J., Acinas, S. G., and Bork, P.: Structure and function of the global ocean microbiome, Science, 348, 6237, doi:10.1126/science.1261359, 2015.
Thiele, S., Wolf, C., Schulz, I. K., Assmy, P., Metfies, K., and Fuchs, B. M.: Stable Composition of the Nano-and Picoplankton Community during the Ocean Iron Fer-tilization Experiment LOHAFEX, Plos One, 9, 0113244, doi:10.1371/journal.pone.0113244, 2014.
Toebe, K., Alpermann, T. J., Tillmann, U., Krock, B., Cembella, A., and John, U.: Molecular discrimination of toxic and non-toxic Alexandrium species (Dinophyta) in natural phytoplankton as-semblages from the Scottish coast of the North Sea, Eur. J. Phy-col., 48, 12–26, doi:10.1080/09670262.2012.752870, 2013. Turnbaugh, P. J., Hamady, M., Yatsunenko, T., Cantarel, B. L.,
Dun-can, A., Ley, R. E., Sogin, M. L., Jones, W. J., Roe, B. A., Af-fourtit, J. P., Egholm, M., Henrissat, B., Heath, A. C., Knight, R., and Gordon J. I.: A core gut microbiome in obese and lean twins, Nature, 457, 480–484, doi:10.1038/nature07540, 2009. Ussler, W., Preston, C., Tavormina, P., Pargett, D., Jensen, S.,
Ro-man, B., Marin, R., Shah, S. R., Girguis, P. R., Birch, J. M., Or-phan, V., and Scholin C.: Autonomous Application of Quantita-tive PCR in the Deep Sea: In Situ Surveys of Aerobic Methan-otrophs Using the Deep-Sea Environmental Sample Processor, Environ. Sci. Technol., 47, 9339–9346, doi:10.1021/es4023199, 2013.
Wassmann, P., Ratkova, T., and Reigstad, M.: The contribution of single and colonial cells ofPhaeocystis pouchetiito spring and summer blooms in the north-eastern North Atlantic, Harmful Al-gae, 4, 823–840, doi:10.1016/j.hal.2004.12.009, 2005.
Wiltshire, K. H., Kraberg, A., Bartsch, I., Boersma, M., Franke, H.-D., Freund, J., Gebuehr, C., Gerdts, G., Stockmann, K., and Wichels, A.: Helgoland Roads, North Sea: 45 Years of Change, Estuar. Coasts, 33, 295–310, doi:10.1007/s12237-009-9228-y, 2009.
Woese, C. R.: Bacterial Evolution, Microbiol. Rev., 51, 221–271, 1987.
commu-nities in the Amundsen Sea, Antarct. Sci., 25, 741–751, doi:10.1017/S0954102013000229, 2013.
Wolf, C., Kilias, E. S., and Metfies, K.: Evaluating the potential of 18S rDNA clone libraries to complement pyrosequencing data of marine protists with near full-length sequence information, Mar. Biol. Res., 10, 771–780, doi:10.1080/17451000.2013.852685, 2014a.
Wolf, C., Frickenhaus, S., Kilias, E. S., Peeken, I., and Metfies, K.: Protist community composition in the Pacific sector of the South-ern Ocean during austral summer 2010, Polar Biol., 37, 375–389, doi:10.1007/s00300-013-1438-x, 2014b.
Wollschläger, J., Nicolaus, A., Wiltshire, K. H., and Metfies, K.: Assessment of North Sea phytoplankton via molecular sensing: a method evaluation, J. Plankton Res., 36, 695–708, doi:10.1093/plankt/fbu003, 2014.
Wollschläger, J., Wiltshire, K. H., Petersen, W., and Metfies, K.: Analysis of phytoplankton distribution and community structure in the German Bight with respect to the different size classes, J. Sea Res., 99, 83–96, doi:10.1016/j.seares.2015.02.005, 2015. Zhu, F., Massana, R., Not, F., Marie, D., and Vaulot, D.:
Map-ping of picoeucaryotes in marine ecosystems with quantitative PCR of the 18S rRNA gene, FEMS Microbiol. Ecol., 52, 79–92, doi:10.1016/j.protis.2012.11.006, 2005.