ISSN: 1809-4430 (on-line) www.engenhariaagricola.org.br
2 Universidade Federal do Vale do São Francisco - UNIVASF/ Juazeiro - BA, Brasil. Doi: Doi:http://dx.doi.org/10.1590/1809-4430-Eng.Agric.v38n3p300-308/2018
SPATIAL VARIABILITY OF THE MICROCLIMATE IN DIFFERENT SMALL RUMINANT
HOUSE LOCATED IN THE SEMIARID OF PERNAMBUCO, BRAZIL
Indira C. M. Gonçalves
1*, Sílvia H. N. Turco
2, Mário de M. Vilas Boas R. Leitão
2,
Leane N. Oliveira
2, Danielle M. Amorim
31*Corresponding author. Instituto Federal de Educação, Ciência e Tecnologia Baiano - IF Baiano/ Alagoinhas - BA, Brasil. E-mail: [email protected]
KEYWORDS
environment, animal
production, welfare.
ABSTRACT
The spatial variability in meteorological conditions was evaluated in two small ruminant
house with different constructive aspects, based on the variables of dry bulb temperature,
relative humidity, wind speed and temperature humidity index (THI), through the
generation of maps using the Kriging interpolation method. The experiment was
conducted in two seasons, winter and summer, and the small ruminant house were
denominated as: FNRG (facility at ground level with no ridge vent) and FWRG (facility at
ground level and with ridge vent). The studied parameters were recorded by portable
digital sensors, thermo-anemometers and thermo-hygrometers, with data collections at 9
am and 3 pm. With the analysis of the spatial variability of the data, it was observed that
the pens positioned in the central region of the two facilities had the least stressful places
to animals in two seasons and two times, where the FWRG presented larger areas with
lower temperatures, within the comfort zone, compared to the FNRG due to the presence
of the ridge vents, were the least stressful places for the animals in the two seasons and at
the two data collection times. At 9 am, in the winter and summer, both facilities presented
comfortable conditions for the rearing of goats and sheep in the morning that were not
observed at 3 pm.
INTRODUCTION
The creation of goats and sheep is one of the oldest farming practices in Brazil, whose origin dates back to the times of the Portuguese coloization. This activity has been going through many transformations over the years, with a significant growth in the market and achieving significant positions in agribusiness, contributing positively to the country's economy, with emphasis in northeastern Brazil (Lima & Filho, 2013).
Although many breeds of goats and sheep raised in the northeastern part of the country are considered to be resistant to the climatic conditions of the area, the productivity rates are not very satisfactory because the adopted feeding and health management practices are not the most appropriate, which contributes to low production efficiency. The low productivity rates can also be attributed to the direct and indirect effects of the tropical climate, which may compromise the animals’ welfare (Oliveira et al., 2013).
The variables that have the greatest effects on animal welfare and consequently on their productivity are air temperature, relative humidity, solar radiation and wind speed, which are constituents of the thermal environment (Baêta & Souza, 2010). Furthermore, these authors also state that the internal environment of a rearing facility generally results from the local external conditions, the construction characteristics and the materials used in construction.
Thus, a broad range of strategies for the management of the microclimate inside animal production facilities has been implemented in the search for the appropriate thermal comfort of the animal’s house due to the influence of meteorological elements that favor or hinder their performance. This management includes strategies used to reduce the adverse effects of stressing agents in the animal-environment relationship (Silva et al., 2012).
Studies on the microclimate of animal production facilities are of great importance as they contribute to increased animal productivity. The aim of this study was to evaluate the spatial variability of different meteorological variables as well as the thermal comfort index in two small ruminant house with different construction characteristics located in the semiarid Brazilian’s condition.
MATERIAL AND METHODS
The study was conducted at Agrarian Sciences Campus of the Federal University of the São Francisco Valley, which is located in the experimental area for animal production facilities of the university in Petrolina-PE, Brazil (09º09'South and 40º22'West, altitude of 365 m), tropical semiarid climate is of type BshW according to the Köppen-Geiger climate classification.
The experiment was conducted during the winter (July 2014) and summer (February 2015). During the experiment, data were collected twice a day (9 am and 3 pm) in two small ruminant houses with different construction characteristics.
Facility at ground level with no ridge vent, FNRG: east-west orientation, cement floor, the roof have a steel structure and ceramic tile with a slope of 25%, ceiling height of 3.0 m plus 0.39 m of structural steel and individual pens measuring 2.05 x 1.0 m. The walls of the pens are masonry and 1.30 m high. The facility is completely fenced by a low masonry wall with a height of 1.30 m, which is 1.50 m from the lateral pens of the facility and 2.15 m from the edges and forms an internal passage around the entire sheepfold. The width of the facility is 9.9 m, the length is 28.9 m, and the total area is 286.1 m2.
Facility at ground level and with ridge vent, FWRG: east-west orientation, cement floor, covered with a steel structure and ceramic tiles with a slope of 25%, ridge vents measuring 1.0 m wide, ceiling height of 3.00 m and collective pens of 3.90 m x 3.88 m, pen walls of masonry measuring 1.20 m high. The facility is 11.8 m wide, 24.1 m long and has a total area of 284.4 m2. This facility has a
solarium for each collective stall that have an area of approximately 15 m2.
Air temperature (°C), relative humidity (%) and wind speed (ms-1) were recorded and used to calculate the
temperature humidity index (THI). The temperature and relative humidity were recorded using a portable digital psychrometer (Politerm, model POL-31D), which has a recording range of temperature between -30 to 100°C and relative humidity between 0 to 100% , and the wind speed was recorded using a portable thermo-anemometer (Instruterm, model TAD 500), which has a measurement range between 0 to 45 m s-1.
The THI was calculated using to the equation proposed by Thom (1958):
(1) Where,
Temperature Humidity index;
= Air temperature (°C); and
= Dew point temperature (°C).
To examine the parameters under study, the temperature, relative humidity and wind speed were plotted in cartesian space. The small ruminant house’s
floor was marked at 2 m intervals, which resulted in a 2 x 2 m regular grid, totaling 90 points in each facility. It was spent 30 minutes to perform the measurement of the parameters studied at all points in each installation. Data were collected simultaneously in the small ruminant house. Using the grid, the spatial variability in the small ruminant house thermal conditions was examined to verify which of the facilities provides the most favorable microclimate for housing animals.
The spatial dependence was analyzed by adjusting theoretical models via the calculation of semivariograms, according to the following equation (Vieira, 2000):
( )
( )
N
( )h
( ) (
−
)
i=
h
+
xi
Z
xi
Z
h
=
h
γ
1
2
2N
1
(2)
Where,
( )
h
N
is the number of experimental observation pairs, and( )
xi
Z
andZ
(
xi
+
h
)
are separated by a distanceh
.Semivariograms are represented by a graph of versus . By fitting a mathematical model to the calculated values of , the theoretical model coefficients were estimated for the semivariogram (the nugget effect, C0, plateau, C0 + C1, and the scope, a). The
selection of the best model was based on the smallest residual sum of squares (RSS) and the multiple coefficient of determination (R2).
The semivariogram models were adjusted using the GS+ 7.0 software which is used for the estimation of parameters that are analyzed in areas not sampled by the interpolation method (ordinary Kriging). From this, maps were generated using the Surfer 8.0 software.
RESULTS AND DISCUSSION
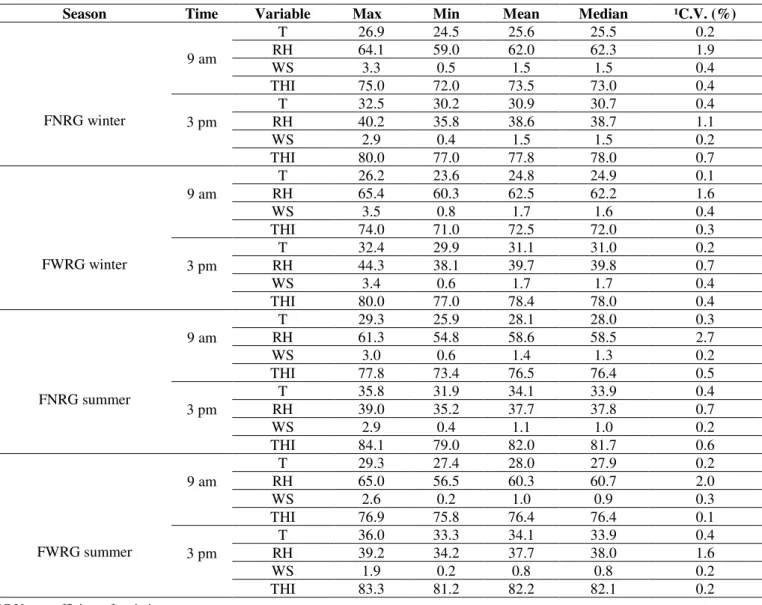
TABLE 1. Statistical analysis of the air temperature (°C), relative humidity (%) and wind speed (m s-1) and THI at 9 am and 3
pm for FNRG (facility at ground level with no ridge vent) and FWRG (facility at ground level and with ridge vent) during the winter and summer seasons.
Season Time Variable Max Min Mean Median ¹C.V. (%)
FNRG winter
9 am
T 26.9 24.5 25.6 25.5 0.2
RH 64.1 59.0 62.0 62.3 1.9
WS 3.3 0.5 1.5 1.5 0.4
THI 75.0 72.0 73.5 73.0 0.4
3 pm
T 32.5 30.2 30.9 30.7 0.4
RH 40.2 35.8 38.6 38.7 1.1
WS 2.9 0.4 1.5 1.5 0.2
THI 80.0 77.0 77.8 78.0 0.7
FWRG winter
9 am
T 26.2 23.6 24.8 24.9 0.1
RH 65.4 60.3 62.5 62.2 1.6
WS 3.5 0.8 1.7 1.6 0.4
THI 74.0 71.0 72.5 72.0 0.3
3 pm
T 32.4 29.9 31.1 31.0 0.2
RH 44.3 38.1 39.7 39.8 0.7
WS 3.4 0.6 1.7 1.7 0.4
THI 80.0 77.0 78.4 78.0 0.4
FNRG summer
9 am
T 29.3 25.9 28.1 28.0 0.3
RH 61.3 54.8 58.6 58.5 2.7
WS 3.0 0.6 1.4 1.3 0.2
THI 77.8 73.4 76.5 76.4 0.5
3 pm
T 35.8 31.9 34.1 33.9 0.4
RH 39.0 35.2 37.7 37.8 0.7
WS 2.9 0.4 1.1 1.0 0.2
THI 84.1 79.0 82.0 81.7 0.6
FWRG summer
9 am
T 29.3 27.4 28.0 27.9 0.2
RH 65.0 56.5 60.3 60.7 2.0
WS 2.6 0.2 1.0 0.9 0.3
THI 76.9 75.8 76.4 76.4 0.1
3 pm
T 36.0 33.3 34.1 33.9 0.4
RH 39.2 34.2 37.7 38.0 1.6
WS 1.9 0.2 0.8 0.8 0.2
THI 83.3 81.2 82.2 82.1 0.2
¹C.V. = coefficient of variation.
Table 1 shows that the average values of the air temperature at 9 am in the winter varied from 24.8°C to 25.6°C. FWRG had the lowest value, and FNRG had the highest value. The average values are within the thermal comfort zone (TCZ) recommended for goats and sheep by Baêta & Souza (2010), which ranges from 20 to 30°C. In the afternoon (3 pm), the average temperatures ranged from 30.7°C in FNRG to 31.1°C in FWRG. These temperatures are above the TCZ recommended for these animals but are below the critical temperature of 35°C, according to Leite et. al. (2012).
In the summer, the average temperatures ranged from 28.0 to 28.1°C at 9 am, and the mean values of the temperatures at the two facilities were 34.1°C at 3 pm. At 9 am during the experimental period, the average temperatures of both sheepfolds were within the TCZ, according to Baêta & Souza (2010); however, at 3 pm, they exceeded the TCZ and also close to the critical temperature limit specified by Leite et al. (2012).
Confirming the recommendations established by Baêta & Souza (2010), Eustáquio Filho et al. (2011), in a study conducted in southwestern Bahia, Brazil, established the thermal comfort zone for Santa Inês sheep at temperatures of 10, 15, 20 and 25°C. However, at temperatures above 30°C, the physiological strain on the animals increased to maintain homeothermy. Thus, the data indicate that the facilities studied in the present work provided comfortable temperatures for animals at 9 am in winter and summer conditions, although at 3 pm during both seasons, the air temperatures were above the maximum recommended for these animals.
In the winter, the average relative humidity ranged from 62.0 to 62.5% at 9 am for FNRG and FWRG, respectively, and at 3 pm, the average relative humidity ranged from 38.6% and 39.7% for FNRG and FWRG, respectively. At 9 am in the summer, the average relative humidity varied from 58.6% to 60.3% for FNRG and FWRG, respectively. At 3 pm, the average relative humidity at FNRG and FWRG were 37.7%. At 9 am in two seasons, humidity at both facilities was within the thermal comfort zone for domestic animals, which, according to Baêta & Souza (2010), must be between 50 and 70%. However, at 3 pm in two seasons, the humidity was lower than that recommended by these authors.
Similar results were found by Roberto (2012), who evaluated the physiological responses and thermal gradients of Saanen goats and crossbred ¼ Saanen + ¾ Bôer goats that were raised in confinement in a semi-open facility covered with cement fiber tiles in the semiarid region of Paraiba, Brazil. In that study, the relative humidity 60.1% at 9 am and 42.6% at 3 pm from November to February.
The average wind speeds during the winter at 9 am ranged from 1.5 m s-1 for FNRG to 1.7 m s-1 for FWRG.
The average wind speeds during the winter at 3 pm ranged from 1.5 m s-1 to 1.7 m s-1 for FNRG and FWRG,
respectively. At 9 am in the summer, the average wind speeds were 1.4 m s-1 at both facilities, and at 3 pm, the
average wind speeds ranged from 0.8 m s-1 to 1.1 m s-1 at
FWRG and FNRG, respectively. According to McDowell (1989), wind speeds of 1.3 to 1.9 m s-1 are ideal for raising
domestic animals but cause concern above 8.0 m s-1.
Concerning this recommendation, the observed wind speeds were below the recommendation only during the summer at 3 pm.
Table 1 shows that the average wintertime THI were 72.5 at FWRG and 73.5 at FNRG at 9 am and 77.8 at FNRG and 78.4 at FNRG at 3 pm. At 9 am in the summer, the averages were 76.5 and 76.6 at FNRG and FWRG, respectively, and at 3 pm they were 81.9 and 82.0 at FWRG and FNRG, respectively. There is not yet a precise classification of the THI for goats and sheep, however, Silanikove & Koluman (2015) determined that for dairy goats THI below 80 indicate normal conditions, i.e., there is no effect on milk production, 80 to 85 are alert values, which can cause a modest effect on milk production, 85 and 90 indicate danger, which produce serious effects on
milk production and values above 90 indicate an extreme situation, which can result in animal death. According to this classification, the environment presented normal condition for animals in the winter at both times and in the summer at 9 am, but at 3 pm in the summer, the situation should be considered alarming.
In studies performed with goats of the Canindé and Moxotó breeds raised in a climatic chamber located at the Federal University of Campina Grande, Lucena et al. (2013), found that a THI greater than 81.3 can be considered stressful for animals of these breeds. The results obtained in the present study indicate that in the summer at 3 pm, the two facilities presented THI conditions that should be considered uncomfortable for goats of the Caninde and Moxotó breeds.
The mean and median values listed in Table 1 for both small ruminant houses are similar, which indicates that the data are not markedly asymmetrical. When the mean, median and mode values are similar, the data has or approaches a normal distribution. This may be an indication that the measures of central tendency are not dominated by outliers in the distribution (Cambardella et al., 1994).
Elevated values of the coefficient of variation (CV) can be considered to be the first indicators of the existence of heterogeneous data. When considering the classification criteria of Warrick & Nielsen (1980), in which low variability is indicated by C.V. < 12%, average variability by 12% < C.V. < 62% and high variability by C.V. > 62%, it was observed that all of the evaluated parameters showed low variability (C.V. < 12%) for the different times and treatments.
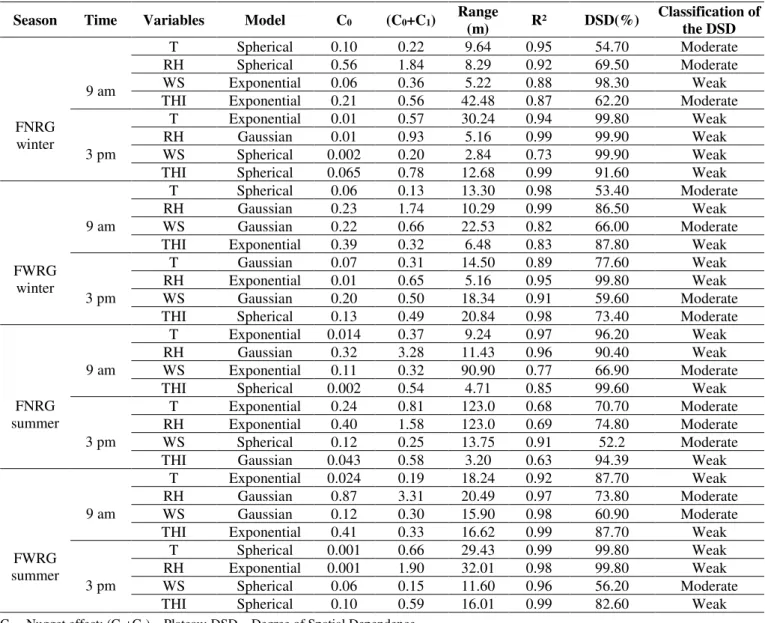
The parameters of the geostatistical analysis (adjusted semivariogram model, nugget effect, plateau, scope and degree of spatial dependence) are presented in Table 2.
TABLE 2. Parameters of the experimental semivariograms for air temperature, relative humidity and wind speed at 9:00 am and 3:00 pm for FNRG (facility at ground level with no ridge vent) and FWRG (facility at ground level and with ridge vent) during the winter and summer seasons.
Season Time Variables Model C0 (C0+C1) Range
(m) R² DSD(%)
Classification of the DSD
FNRG winter
9 am
T Spherical 0.10 0.22 9.64 0.95 54.70 Moderate
RH Spherical 0.56 1.84 8.29 0.92 69.50 Moderate
WS Exponential 0.06 0.36 5.22 0.88 98.30 Weak
THI Exponential 0.21 0.56 42.48 0.87 62.20 Moderate
3 pm
T Exponential 0.01 0.57 30.24 0.94 99.80 Weak
RH Gaussian 0.01 0.93 5.16 0.99 99.90 Weak
WS Spherical 0.002 0.20 2.84 0.73 99.90 Weak
THI Spherical 0.065 0.78 12.68 0.99 91.60 Weak
FWRG winter
9 am
T Spherical 0.06 0.13 13.30 0.98 53.40 Moderate
RH Gaussian 0.23 1.74 10.29 0.99 86.50 Weak
WS Gaussian 0.22 0.66 22.53 0.82 66.00 Moderate
THI Exponential 0.39 0.32 6.48 0.83 87.80 Weak
3 pm
T Gaussian 0.07 0.31 14.50 0.89 77.60 Weak
RH Exponential 0.01 0.65 5.16 0.95 99.80 Weak
WS Gaussian 0.20 0.50 18.34 0.91 59.60 Moderate
THI Spherical 0.13 0.49 20.84 0.98 73.40 Moderate
FNRG summer
9 am
T Exponential 0.014 0.37 9.24 0.97 96.20 Weak
RH Gaussian 0.32 3.28 11.43 0.96 90.40 Weak
WS Exponential 0.11 0.32 90.90 0.77 66.90 Moderate
THI Spherical 0.002 0.54 4.71 0.85 99.60 Weak
3 pm
T Exponential 0.24 0.81 123.0 0.68 70.70 Moderate
RH Exponential 0.40 1.58 123.0 0.69 74.80 Moderate
WS Spherical 0.12 0.25 13.75 0.91 52.2 Moderate
THI Gaussian 0.043 0.58 3.20 0.63 94.39 Weak
FWRG summer
9 am
T Exponential 0.024 0.19 18.24 0.92 87.70 Weak
RH Gaussian 0.87 3.31 20.49 0.97 73.80 Moderate
WS Gaussian 0.12 0.30 15.90 0.98 60.90 Moderate
THI Exponential 0.41 0.33 16.62 0.99 87.70 Weak
3 pm
T Spherical 0.001 0.66 29.43 0.99 99.80 Weak
RH Exponential 0.001 1.90 32.01 0.98 99.80 Weak
WS Spherical 0.06 0.15 11.60 0.96 56.20 Moderate
THI Spherical 0.10 0.59 16.01 0.99 82.60 Weak
C0 – Nugget effect; (C0+C1) – Plateau; DSD – Degree of Spatial Dependence
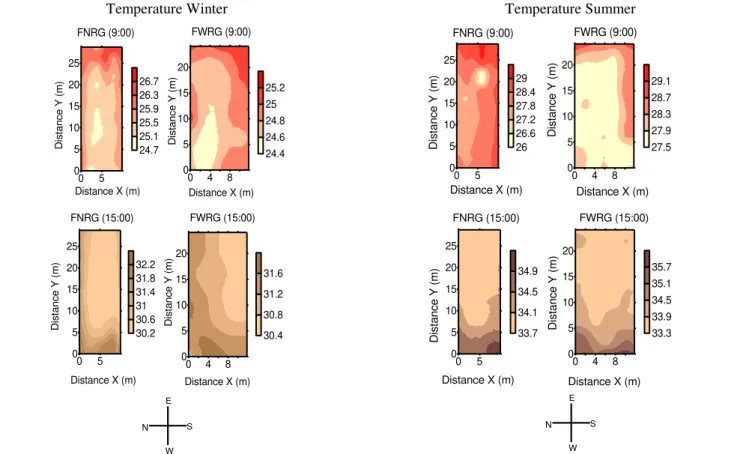
The contour maps for the winter and summer, which were estimated using Kriging, for the air temperature, relative humidity and wind speed are shown in Figures 1, 2 and 3, respectively, and are grouped into color-coded classes.
The wintertime air temperatures at FNRG presented higher spatial variability than those at FWRG, and the amplitude of the variation was 2° providing different conditions of thermal comfort for the animals and can cause not uniform in production rates within the same lot.
FNRG also had the highest temperatures in some parts of the facility. This may be related to the construction of the facility, which lacks ridge vents. The lowest temperatures at FNRG were observed in the center of the
facility, which did not receive direct sunlight when those temperatures were recorded.
The lowest temperatures at FWRG were recorded at 9 am at the central and north side of the installation, which is consistent with ridge vent and the east/west orientation. At 3 pm, the spatial distributions in the two facilities were similar, with milder temperatures along the east and south sides.
Temperature Winter Temperature Summer 0 5 0 5 10 15 20 25 24.7 25.1 25.5 25.9 26.3 26.7
0 4 8 0 5 10 15 20 24.4 24.6 24.8 25 25.2 0 5 0 5 10 15 20 25 30.2 30.6 31 31.4 31.8 32.2
0 4 8 0 5 10 15 20 30.4 30.8 31.2 31.6
FNRG (9:00) FWRG (9:00)
FNRG (15:00) FWRG (15:00)
D is ta n c e Y ( m )
Distance X (m)
D is ta n c e Y ( m ) D is ta n c e Y ( m ) D is ta n c e Y ( m )
Distance X (m) Distance X (m) Distance X (m)
N S E W 0 5 0 5 10 15 20 25 0 5 0 5 10 15 20 25 33.7 34.1 34.5 34.9
0 4 8 0 5 10 15 20 27.5 27.9 28.3 28.7 29.1
0 4 8 0 5 10 15 20 33.3 33.9 34.5 35.1 35.7 26 26.6 27.2 27.8 28.4 29 D is ta n c e Y ( m ) D is ta n c e Y ( m ) D is ta n c e Y ( m ) D is ta n c e Y ( m )
Distance X (m) Distance X (m)
Distance X (m) Distance X (m)
FNRG (9:00) FWRG (9:00)
FNRG (15:00) FWRG (15:00)
N S
E
W
FIGURE 1. Spatial distribution of the air temperature (°C) for FNRG (facility at ground level with no ridge vent) and FWRG (facility at ground level and with ridge vent) at 9 am and 3 pm in the summer and winter.
Figure 2 shows that in the winter the relative humidity varied inversely with temperature. The relative humidity at FNRG at 9 am and 3 pm was highest in the center of the facility. The relative humidity at FWRG at 9 am and 3 pm was highest in the northwestern part of the facility, but the relative humidity was more spatially homogenous at 3 pm.
RH Winter RH Summer
0 5 0 5 10 15 20 25 59.6 60.6 61.6 62.6 63.6
0 4 8
0 5 10 15 20 60.4 61.6 62.8 64 65.2 0 5 0 5 10 15 20 25 35.4 36.4 37.4 38.4 39.4
0 4 8
0 5 10 15 20 38 39.2 40.4 41.6 42.8 44 D is ta n c e Y ( m ) D is ta n c e Y ( m ) D is ta n c e Y ( m ) D is ta n c e Y ( m )
Distance X (m) Distance X (m)
Distance X (m) Distance X (m)
FNRG (9:00) FWRG (9:00)
FNRG (15:00) FWRG (15:00)
N S E W 0 5 0 5 10 15 20 25 55.6 56.6 57.6 58.6 59.6 60.6 0 5 0 5 10 15 20 25 36.5 37 37.5 38
0 2 4 6 8 10
0 5 10 15 20 57.6 58.6 59.6 60.6 61.6
0 4 8
0 5 10 15 20 34.2 35.2 36.2 37.2 38.2 39.2 D is ta n ce Y ( m ) D is ta n ce Y ( m ) D is ta n ce Y ( m ) D is ta n ce Y ( m )
Distance X (m) Distance X (m)
Distance X (m) Distance X (m)
FNRG (9:00) FWRG (9:00)
FNRG (15:00) FWRG (15:00)
N S
E
W
In the summer, higher humidity values were observed. At FNRG at 9 am, the highest values were recorded along the north side of the facility and the lowest values were recorded on the southeast side of the facility. The southeast side receives direct sunlight, which contributes to a decrease in humidity. At 3 pm, the relative humidity at FNRG was highest in the northeastern part of the facility and lowest along the west side, which receives direct sunlight at that time. The course of FWRG was similar to that of FNRG; the highest relative humidity occurred on the north and west sides at 9 am and in the center and on the east side at 3 pm.
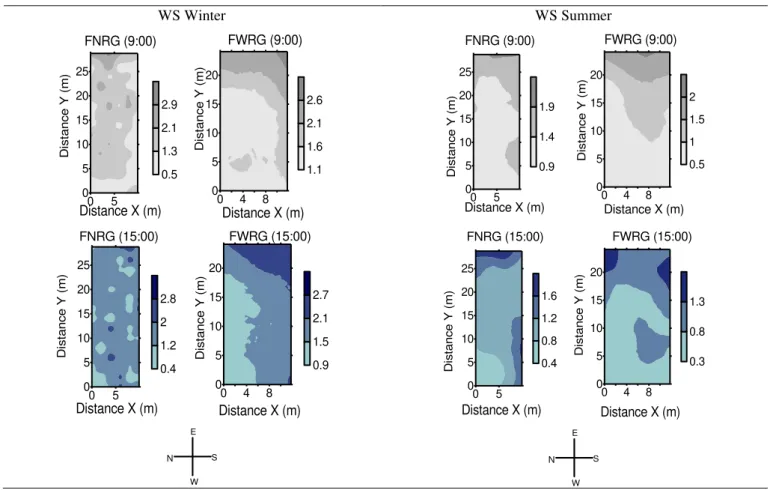
Figure 3 illustrates the spatial distribution of the wind speed in the installation. Note that the FNRG, in winter, in both study times, presented a similar behavior to the same extent this parameter, indicating heterogeneity of
the data in this facility. This same station, one realizes that the FWRG in both studied zones, wind speed behavior was similar, with the highest values in the South and Southeast. The variability of the data, possibly due to the fact that wind is characterized by a parameter change magnitude and direction steadily, reaching variations of up to 100% (Medeiros et al., 2014).
In the summer, the two folds presented values of lower wind speed to those found in the winter period, and one can also notice that the facilities had a similar behavior in both study times, with the highest wind speed values on the east side the premises.
In both the winter and summer at no time showed the facilities wind speed values considered concern for animals according McDowell (1989).
WS Winter WS Summer
0 5 0 5 10 15 20 25 0.5 1.3 2.1 2.9
0 4 8
0 5 10 15 20 1.1 1.6 2.1 2.6 0 5 0 5 10 15 20 25 0.4 1.2 2 2.8
0 4 8
0 5 10 15 20 0.9 1.5 2.1 2.7 D is ta n c e Y ( m ) D is ta n c e Y ( m ) D is ta n c e Y ( m ) D is ta n c e Y ( m )
Distance X (m) Distance X (m)
Distance X (m) Distance X (m)
FNRG (9:00) FWRG (9:00)
FNRG (15:00) FWRG (15:00)
N S E W 0 5 0 5 10 15 20 25 0.9 1.4 1.9 0 5 0 5 10 15 20 25 0.4 0.8 1.2 1.6
0 4 8
0 5 10 15 20 0.5 1 1.5 2
0 4 8
0 5 10 15 20 0.3 0.8 1.3
Distance X (m) Distance X (m)
Distance X (m) Distance X (m)
D is ta n c e Y ( m ) D is ta n c e Y ( m ) D is ta n c e Y ( m ) D is ta n c e Y ( m )
FNRG (9:00) FWRG (9:00)
FNRG (15:00) FWRG (15:00)
N S
E
W
FIGURE 3. Spatial distribution of the wind speed (m s-1) at FNRG (facility at ground level with no ridge vent) and FWRG
(facility at ground level and with ridge vent) at 9 am and 3 pm in the summer and winter.
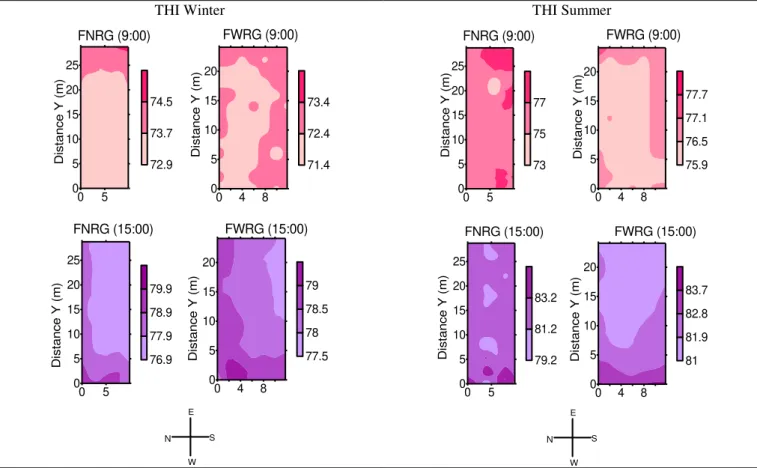
Figure 4 shows that in the winter, the spatial distribution of THI was similar to that of the temperature. At 9 am, the highest values were measured on the east side of the facility, and at 3 pm, the highest values were measured on the west side. At 9 am, the THI was more spatially homogeneous at FNRG, and the highest value was recorded on the southeast side.
THI Winter THI Summer 0 5 0 5 10 15 20 25 72.9 73.7 74.5 0 5 0 5 10 15 20 25 76.9 77.9 78.9 79.9
0 4 8
0 5 10 15 20 71.4 72.4 73.4
0 4 8
0 5 10 15 20 77.5 78 78.5 79 D is ta n c e Y ( m ) D is ta n c e Y ( m ) D is ta n c e Y ( m ) D is ta n c e Y ( m )
FNRG (9:00) FWRG (9:00)
FNRG (15:00) FWRG (15:00)
N S E W 0 5 0 5 10 15 20 25 73 75 77 0 5 0 5 10 15 20 25 79.2 81.2 83.2
0 4 8
0 5 10 15 20 75.9 76.5 77.1 77.7
0 4 8
0 5 10 15 20 81 81.9 82.8 83.7 D is ta n c e Y ( m ) D is ta n c e Y ( m ) D is ta n c e Y ( m ) D is ta n c e Y ( m )
FNRG (9:00) FWRG (9:00)
FNRG (15:00) FWRG (15:00)
N S
E
W
FIGURE 4. Spatial distribution of the THI at FNRG (facility at ground level with no ridge vent) and FWRG (facility at ground level and with ridge vent) at 9 am and 3 pm during the summer and winter.
CONCLUSIONS
1. The ridge vent had little effect on the animal thermal environment characteristics.
2. Regarding temperature and relative humidity, the two facilities were thermally comfortable for animals at 9 am, but at 3 pm, the facilities had unfavorable conditions for the comfort of the animals in both seasons analyzed.
3. The wind speeds in the measurement times and seasons were not of concern for rearing goats and sheep.
4. The THI conditions at both facilities in the winter at both times were adequate for the rearing of dairy goats, but at 9 am in the summer, the conditions were not normal.
REFERENCES
Baêta FC, Souza CF (2010) Ambiência em edificações rurais - conforto animal. Viçosa, UFV, 2 ed. 269p. Cambardella CA, Moorman TB, Novak JM, Parkin TB, Karlen DL, Turco RF, Konopka AE (1994) Field scale variability of soil properties in Central Iowa soils. Soil Science Society of America Journal 58(5):1501-1511. Eustáquio Filho A, Teodoro SM, Chaves MA, Santos PEF dos, Silva MWR, Murta RM, Carvalho GP de, Souza LEB (2011) Zona de conforto térmico de ovinos da raça Santa Inês com base nas respostas fisiológicas. Revista Brasileira de Zootecnia 40:1807-1814.
Leite JRS, Furtado DA, Leal AF, Souza BB, Silva AS (2012) Influência de fatores bioclimáticos nos índices produtivos e fisiológicos de caprinos nativos confinados. Revista Brasileira de Engenharia Agrícola e Ambiental 16(4):443-448.
Lima LR, Filho JADB (2013) Impact of pre-slaughter management on the welfare of goats and sheep. Journal Animal Behavior Biometeorol 1(2):52-60.
Linhares ASF, Soares DL, Oliveira NC, Souza BB, Dantas NLB (2015) Respostas fisiológicas e manejo adequado de ruminantes em ambientes quentes. Agropecuária Científica no Semiárido 11(2):27-33.
Lucena LFA, Furtado DA, Nascimento JWB, Medeiros NA, Souza BB (2013) Respostas fisiológicas de caprinos nativos mantidos em temperatura termoneutra e em estresse térmico. Revista Brasileira de Engenharia Agrícola e Ambiental 17(6):672-679.
Pereira GM, Souza BB de, Silva AM de A, Roberto JVB, Silva CMB de A (2011) Avaliação do comportamento fisiológico de caprinos da raça saanen no semiárido paraibano. Revista Verde de Agrotecnologia e Desenvolvimento Sustentável 6(1):83-88.
Roberto JVB (2012) Efeito do ambiente térmico e uso da termografia de infravermelho em caprinos Saanen e seus mestiços com boer no semiárido brasileiro. Dissertação Mestrado. Centro de Saúde e Tecnologia Rural, Universidade Federal de Campina Grande.
Silanikove N, Koluman D (2015) Impact of climate change on the dairy industry in temperate zones: Predications on the overall negative impact and on the positive role of dairy goats in adaptation to earth warming. Elsevier, Small Ruminant Research 123:27-34.
Silva IM, Pandorfi H, Almeida GLP, Guiselini C, Caldas AM, Jacob AL (2012) Análise espacial das condições térmicas do ambiente pré-ordenha de bovinos leiteiros sob regimes de climatização. Revista Brasileira de Engenharia Agrícola e Ambiental 16(8):903-909.
Thom EC (1958) The discomfort index. Weatherwise 12(1):57-60.
Vieira SR (2000) Geoestatística em estudos de
variabilidade espacial do solo. In: Novais RF et al. (eds). Tópicos em ciência do solo. Viçosa, Sociedade Brasileira de Ciência do Solo 1:1-53.
Warrick AW, Nielsen DR (1980) Spatial variability of soil physical properties in the field. In: Hillel D (ed).