Submitted17 May 2016
Accepted 22 June 2016
Published21 July 2016
Corresponding author
Stefan Kuhle, stefan.kuhle@dal.ca
Academic editor
Laura Guidetti
Additional Information and Declarations can be found on page 17
DOI10.7717/peerj.2247
Copyright
2016 Kuhle et al.
Distributed under
Creative Commons CC-BY 4.0
OPEN ACCESS
Percentile curves for skinfold thickness
for Canadian children and youth
Stefan Kuhle1, Jillian Ashley-Martin1, Bryan Maguire2and David C. Hamilton2
1Departments of Pediatrics and Obstetrics & Gynaecology, Dalhousie University, Halifax, NS, Canada
2Department of Mathematics & Statistics, Dalhousie University, Halifax, NS, Canada
ABSTRACT
Background.Skinfold thickness (SFT) measurements are a reliable and feasible method for assessing body fat in children but their use and interpretation is hindered by the scarcity of reference values in representative populations of children. The objective of the present study was to develop age- and sex-specific percentile curves for five SFT measures (biceps, triceps, subscapular, suprailiac, medial calf) in a representative population of Canadian children and youth.
Methods.We analyzed data from 3,938 children and adolescents between 6 and 19 years of age who participated in the Canadian Health Measures Survey cycles 1 (2007/2009) and 2 (2009/2011). Standardized procedures were used to measure SFT. Age- and sex-specific centiles for SFT were calculated using the GAMLSS method.
Results.Percentile curves were materially different in absolute value and shape for boys and girls. Percentile girls in girls steadily increased with age whereas percentile curves in boys were characterized by a pubertal centered peak.
Conclusions.The current study has presented for the first time percentile curves for five SFT measures in a representative sample of Canadian children and youth.
SubjectsEpidemiology, Nutrition, Pediatrics, Public Health, Statistics Keywords Children, Skinfolds, Obesity, Growth, Percentile curves
INTRODUCTION
al., 2005;Petkeviciene et al., 2015) and metabolic syndrome (Laurson, Eisenmann & Welk, 2011). Interpretation and uptake of SFT measurement as a method for the assessment of body fat is hindered by the lack of reference data. While there are health-related cutoffs for BMI (Cole et al., 2000;De Onis et al., 2007), waist circumference (World Health Organization, 2008), and waist-to-height ratio (McCarthy & Ashwell, 2006), there is no comparable definition based on SFT for either children or adults. Percentile curves have been developed for US (Laurson, Eisenmann & Welk, 2011;Addo & Himes, 2010) and European (Moreno et al., 2007;Heude et al., 2006;Haas, Liepold & Schwandt, 2011; Brannsether et al., 2013;Kromeyer-Hauschild, Glässer & Zellner, 2012;Jaworski et al., 2012; Wohlfahrt-Veje et al., 2014;Nagy et al., 2014) children. The applicability of these values to the Canadian population is limited due to differences in childhood overweight and obesity prevalence. Moreover, previous SFT references have either been developed with a limited number of skinfolds (Laurson, Eisenmann & Welk, 2011;Addo & Himes, 2010;Brannsether et al., 2013;Kromeyer-Hauschild, Glässer & Zellner, 2012) or were based on a narrower age range (Moreno et al., 2007;Haas, Liepold & Schwandt, 2011;Klimek-Piotrowska et al., 2015). Therefore, the objective of the present study was to develop age- and sex-specific percentile curves for five SFT measures (biceps, triceps, subscapular, suprailiac, medial calf) in a representative population of Canadian children and youth.
METHODS
The present study used data from the Canadian Health Measures Survey (CHMS) cycles 1 and 2. The CMHS is a representative, cross-sectional survey that assesses indicators of health and wellness in Canadians between 3 and 79 years (Statistics Canada, 2011;Statistics Canada, 2012). The survey consists of a household interview to obtain sociodemographic and health information, and a visit to a mobile examination centre to perform a number of physical measurements and tests. The sampling frame of the Canadian Labour Force Survey was used to identify the collection sites for the mobile examination centres. Within each collection site, households were selected using the 2006 Census as the sampling frame. Interviews and examinations for the CHMS Cycle 1 and 2 were performed between 2007 and 2009, and 2009 and 2011, respectively. The overall response rate in the two cycles was 51.7% and 55.7%, respectively. Data from the two cycles was combined as per Statistics Canada guidelines (Statistics Canada, 2013) and weighted to account for the design effect and non-response bias (Statistics Canada, 2013). A total of 11,999 persons participated in the physical examination part of the survey. The present analysis uses data from 3,938 children and adolescents (1,996 males and 1,942 females) between the ages of 6 and 19 years.
Anthropometric measures
All SFT measurements were performed by trained health professionals at the mobile examination centres using a Harpenden skinfold caliper to the nearest 0.2 mm. Each SFT was measured three times and the average of the three measurements was used. Triceps SFT was measured on the midline of the back of the arm at the mid-point level between the acromium process and the tip of the olecranon process. Biceps SFT was measured over the biceps at the same level as the midpoint for the triceps. Subscapular SFT was measured below the inferior angle of the scapula at an angle of 45 degrees to the spine. Suprailiac SFT was measured in the mid-axillary line above the crest of the ilium. Medial calf SFT was measured at the medial side of the calf at the point of the largest circumference. SFT measurements were not done on individuals with a BMI≥30 kg/m2.
Statistical analysis
The data were split by sex and modeled using a four parameter (µ,σ ,ν,τ) Box–Cox power exponential distribution (Rigby & Stasinopoulos, 2004). The GAMLSS method is an extension of the LMS method (Cole & Green, 1992) and assumes that when the data (Y) is transformed using the transformation:
z= y/µ
ν
−1
νσ ν6=0
z=loge y/µ
σ ν=0.
Z follows a standard power exponential distribution with power parameterτ.
The age-specific distribution expresses the mean, coefficient of variation, skewness, and kurtosis as parameters that change smoothly as a function of age by modeling them as cubic splines. These functions can be plotted as smooth curves in terms of age and are referred to as theµ(mean),σ (variance),ν(skewness), andτ (kurtosis) curves. Centiles for a particular age are computed by using the values of the four parameters for the corresponding age. The 3rd, 10th, 25th, 50th, 75th, 90th, and 97th centile curves were computed for biceps, triceps, subscapular, suprailiac, and medial calf SFT.
To avoid unusual behaviours of the spline functions near the end of the age range, data from respondents up to age 30 years were used to fit the models. This modification produced smoother curves that more accurately reflect the population characteristics. Residual quantile plots (‘‘worm plots’’) (Van Buuren & Fredriks, 2001) were used to assess the goodness of fit of each component of the models.
The statistical software package R (R Core Team, 2016) with thegamlsspackage (Rigby & Stasinopoulos, 2006) was used to perform the statistical analyses.
Ethics
All processes used for cycles 1 and 2 of the CHMS were reviewed and approved by the Health Canada Research Ethics Board to ensure that internationally recognized ethical standards for human research were met and maintained. Written informed consent was obtained from all participants aged 14 years and older; parents or guardians gave consent on behalf of children aged 6–13 years, while the child provided his or her assent to participate (Statistics Canada, 2011;Statistics Canada, 2012). The current project was approved by the IWK Health Centre Research Ethics Board, Halifax, NS, Canada (File #1014413).
RESULTS
Characteristics of the sample are shown inTable 1. The median and interquartile range for the five SFT measurements by age and sex are shown inTable 2. The parameter values (µ,σ ,ν,τ) as well as the 3rd, 10th, 25th, 50th, 75th, 90th, and 97th percentiles for the SFT curves are presented by age and sex (Tables 3–7). Model diagnostics showed an adaequate fit for all models.
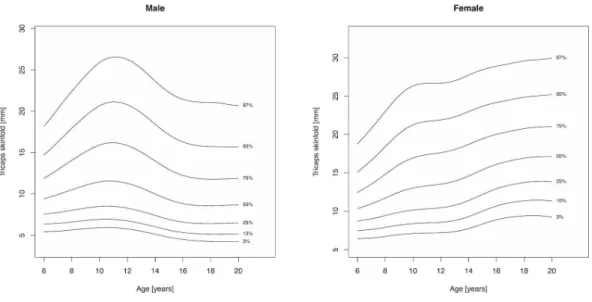
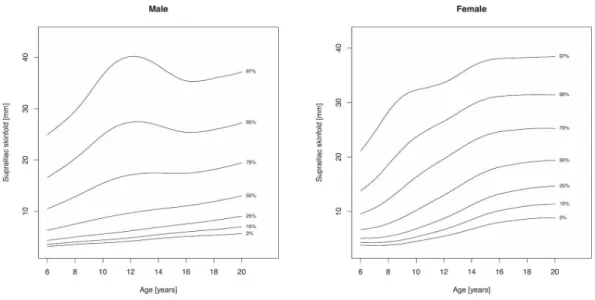
Percentile curves are materially different in both absolute values and shape for boys and girls (Figs. 1–5). Girls have higher median skinfold thickness than boys at all measurement sites (Table 2). All skinfold thickness measurements among girls are characterized by a relatively steady increase from childhood through adolescence despite differing absolute percentile values and rates of yearly change. Lower body (medial calf, suprailiac) skinfold thickness measurements steadily rise until adolescence at which point the rate of yearly increase diminishes. Among upper body measurements, the biceps percentile curve plateaus in early adolescence, whereas the triceps and subscapular curves steadily increase from age 6 to 19. No substantial differences in truncal (subscapular, suprailiac) and peripheral (triceps, biceps, calf) percentile curves among girls were observed.
Skinfold thickness curves in boys are characterized by a peak around age 12 years. The magnitude of this pubertal centered peak was most notable in the percentiles exceeding the median. Subsequent to the post-pubertal peak, skinfold thickness decreased in the peripheral measures (biceps, calf, triceps) and moderately increased in the truncal measures. There were no apparent distinguishing characteristics between the upper and lower body percentile curves in boys.
DISCUSSION
The current study has presented for the first time percentile curves for five SFT measures based on a representative sample of Canadian children and youth aged 6–19 years. The percentile curves presented are meant to be descriptive rather than prescriptive as associations with cardiovascular disease markers or outcomes were not assessed. The data may be used by researchers as reference data for future studies.
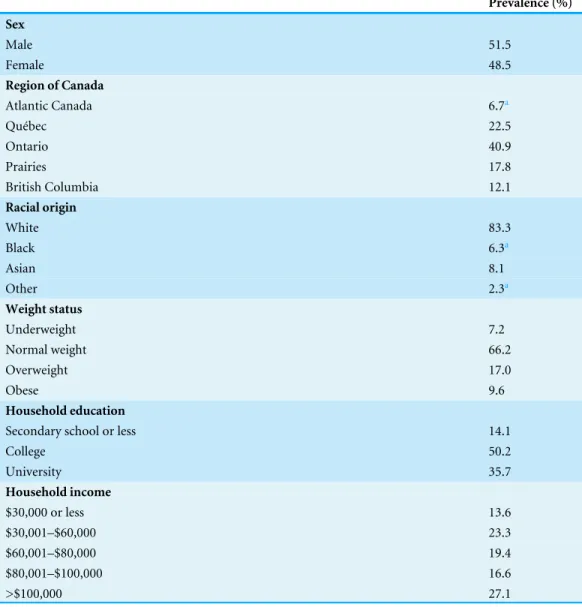
Table 1 Characteristics of 4,115 Canadian children and youth aged 6–19 years in the Canadian Health Measures Survey cycles 1 and 2.
Prevalence (%)
Sex
Male 51.5
Female 48.5
Region of Canada
Atlantic Canada 6.7a
Québec 22.5
Ontario 40.9
Prairies 17.8
British Columbia 12.1
Racial origin
White 83.3
Black 6.3a
Asian 8.1
Other 2.3a
Weight status
Underweight 7.2
Normal weight 66.2
Overweight 17.0
Obese 9.6
Household education
Secondary school or less 14.1
College 50.2
University 35.7
Household income
$30,000 or less 13.6
$30,001–$60,000 23.3
$60,001–$80,000 19.4
$80,001–$100,000 16.6
>$100,000 27.1
Notes.
aCoefficient of variation between 16.6% and 33.3%; interpret with caution as per Statistics Canada sampling variability
reporting guidelines.
Table 2 Sample size, median, and interquartile range for biceps, triceps, subscapular, suprailiac, and medial calf skinfold thickness (mm) for Canadian children and youth aged 6–19 years.
Sex Age (years) n Biceps Triceps Subscapular Suprailiac Medial calf
Median IQR Median IQR Median IQR Median IQR Median IQR
Female 6 154 5.0 1.6 10.5 3.1 5.4 2.3 5.9 2.7 8.7 3.3 7 140 5.1 2.9 11.0 5.0 5.6 2.7 6.8 5.1 10.0 4.3 8 164 6.4 4.3 11.9 6.8 6.6 6.0 8.1 7.7 10.5 7.0 9 174 7.3 4.4 13.1 7.7 8.1 8.4 11.2 11.0 12.1 7.3 10 193 6.9 3.4 13.1 6.4 8.3 6.4 10.6 10.0 12.7 7.3 11 209 7.2 4.1 12.4 6.3 8.5 4.9 11.9 10.3 13.2 7.0 12 127 7.5 4.1 13.9 6.4 8.9 7.7 13.6 11.9 12.7 9.4 13 131 7.3 3.1 14.0 7.9 9.1 8.3 16.1 14.7 13.6 10.0 14 116 7.8 4.1 16.1 8.8 12.0 7.4 17.3 12.3 15.9 9.4 15 118 7.4 4.3 16.3 8.0 11.1 8.5 17.7 14.4 15.0 9.5 16 109 7.0 1.8 17.0 4.5 10.6 5.4 18.9 8.9 15.9 7.1 17 111 7.5 3.5 16.8 6.1 12.9 7.7 21.1 12.3 17.0 8.7 18 104 7.4 2.7 17.3 5.1 11.8 8.3 19.4 10.4 14.8 7.0 19 92 7.2 4.2 17.5 7.9 11.8 6.0 19.8 11.2 16.9 8.1
Male 6 152 4.3 2.6 9.0 3.6 5.0 2.4 5.3 3.4 7.7 4.2
7 163 5.0 3.6 10.2 7.0 5.3 5.3 5.6 8.1 9.1 7.0
8 167 5.2 3.6 10.4 5.9 6.1 3.8 7.2 8.5 8.2 5.6
9 164 6.0 4.8 11.1 7.5 6.2 5.3 7.0 10.3 9.8 9.1 10 204 6.8 5.8 12.8 8.8 7.5 9.4 9.6 15.2 12.4 11.5 11 185 5.5 4.5 11.1 8.8 6.8 4.8 9.9 9.6 10.3 9.1 12 148 5.7 4.4 12.1 8.4 6.8 5.0 7.9 13.4 10.6 9.3 13 141 5.3 4.6 10.8 8.3 7.0 5.7 9.7 10.4 10.5 9.8
14 136 4.4 2.3 9.0 3.1 7.3 2.4 9.8 5.5 9.5 5.7
15 119 4.4 2.2 8.1 5.0 7.2 2.3 9.2 5.2 7.9 5.7
16 130 4.0 1.8 8.2 4.9 7.8 2.9 10.2 6.7 7.9 5.5 17 114 3.9 1.9 8.4 4.6 8.5 3.8 10.2 11.5 8.4 5.3 18 91 4.2 3.3 8.8 5.7 9.4 4.6 13.2 12.9 7.4 8.5
Notes.
IQR, Interquartile range.
Table 3 Parameter values (µ,σ,ν,τ) and percentiles of biceps skinfold thickness (mm) by age and sex for Canadian children and youth aged
6–19 years.
Sex Age (years) µ σ ν τ 3rd 10th 25th 50th 75th 90th 97th
Female 6 5.0119 0.3284 −0.4418 1.8070 2.89 3.42 4.08 5.01 6.28 7.94 10.40 6.5 5.2250 0.3435 −0.4262 1.9030 2.94 3.50 4.20 5.22 6.64 8.49 11.18 7 5.4445 0.3591 −0.4114 2.0020 3.00 3.57 4.32 5.44 7.03 9.07 12.01 7.5 5.6746 0.3742 −0.3977 2.1006 3.06 3.65 4.45 5.67 7.44 9.69 12.89 8 5.9118 0.3874 −0.3847 2.1941 3.13 3.74 4.58 5.91 7.85 10.31 13.76 8.5 6.1425 0.3979 −0.3716 2.2785 3.20 3.83 4.71 6.14 8.25 10.89 14.55 9 6.3538 0.4052 −0.3583 2.3518 3.27 3.92 4.84 6.35 8.60 11.39 15.20 9.5 6.5358 0.4087 −0.3444 2.4148 3.34 4.01 4.95 6.54 8.88 11.76 15.64 10 6.6843 0.4085 −0.3318 2.4636 3.42 4.09 5.06 6.68 9.09 12.01 15.87 10.5 6.8017 0.4061 −0.3223 2.4902 3.48 4.17 5.15 6.80 9.24 12.16 15.97 11 6.8887 0.4035 −0.3159 2.4912 3.54 4.23 5.22 6.89 9.33 12.25 16.03 11.5 6.9462 0.4021 −0.3131 2.4669 3.57 4.28 5.27 6.95 9.39 12.31 16.11 12 6.9848 0.4016 −0.3135 2.4202 3.59 4.30 5.31 6.98 9.43 12.36 16.22 12.5 7.0172 0.4014 −0.3167 2.3565 3.60 4.33 5.35 7.02 9.45 12.41 16.35 13 7.0502 0.4005 −0.3224 2.2830 3.62 4.36 5.39 7.05 9.46 12.44 16.48 13.5 7.0857 0.3986 −0.3305 2.2067 3.65 4.40 5.44 7.09 9.47 12.47 16.60 14 7.1271 0.3956 −0.3402 2.1308 3.69 4.45 5.49 7.13 9.48 12.48 16.69 14.5 7.1747 0.3910 −0.3507 2.0577 3.74 4.52 5.56 7.17 9.49 12.47 16.75 15 7.2244 0.3855 −0.3612 1.9904 3.79 4.59 5.64 7.22 9.49 12.45 16.76 15.5 7.2719 0.3802 −0.3707 1.9315 3.85 4.65 5.71 7.27 9.49 12.42 16.75 16 7.3094 0.3760 −0.3782 1.8827 3.89 4.71 5.76 7.31 9.49 12.40 16.75 16.5 7.3323 0.3737 −0.3836 1.8459 3.92 4.74 5.80 7.33 9.49 12.39 16.77 17 7.3447 0.3733 −0.3873 1.8256 3.93 4.75 5.82 7.34 9.49 12.40 16.82 17.5 7.3491 0.3747 −0.3893 1.8254 3.92 4.75 5.81 7.35 9.51 12.44 16.91 18 7.3424 0.3774 −0.3895 1.8451 3.90 4.73 5.80 7.34 9.53 12.49 16.99 18.5 7.3213 0.3812 −0.3886 1.8817 3.88 4.69 5.76 7.32 9.55 12.54 17.08 19 7.2844 0.3863 −0.3872 1.9314 3.83 4.64 5.70 7.28 9.56 12.59 17.16 19.5 7.2355 0.3926 −0.3849 1.9906 3.78 4.57 5.62 7.24 9.56 12.65 17.26 Male 6 4.6047 0.4244 −0.4739 3.4627 2.42 2.79 3.40 4.60 6.56 8.87 11.71 6.5 4.7687 0.4305 −0.4661 3.5181 2.48 2.87 3.50 4.77 6.84 9.27 12.27 7 4.9358 0.4363 −0.4586 3.5741 2.55 2.95 3.61 4.94 7.12 9.69 12.83 7.5 5.1030 0.4417 −0.4516 3.6290 2.61 3.03 3.71 5.10 7.40 10.10 13.39 8 5.2617 0.4471 −0.4447 3.6814 2.67 3.10 3.81 5.26 7.67 10.50 13.93 8.5 5.4051 0.4527 −0.4387 3.7288 2.72 3.17 3.90 5.41 7.92 10.89 14.47 9 5.5233 0.4601 −0.4341 3.7636 2.76 3.21 3.96 5.52 8.16 11.26 15.03 9.5 5.6104 0.4689 −0.4318 3.7813 2.77 3.23 4.00 5.61 8.35 11.62 15.61 10 5.6625 0.4775 −0.4333 3.7815 2.76 3.23 4.01 5.66 8.50 11.92 16.15 10.5 5.6775 0.4843 −0.4396 3.7661 2.75 3.22 4.00 5.68 8.58 12.13 16.58 11 5.6570 0.4881 −0.4520 3.7424 2.73 3.20 3.98 5.66 8.58 12.21 16.85 11.5 5.6073 0.4872 −0.4719 3.7241 2.72 3.18 3.96 5.61 8.51 12.16 16.91
Table 3(continued)
Sex Age (years) µ σ ν τ 3rd 10th 25th 50th 75th 90th 97th 12 5.5336 0.4807 −0.5000 3.7181 2.73 3.18 3.93 5.53 8.37 11.97 16.71 12.5 5.4364 0.4702 −0.5358 3.7237 2.73 3.17 3.89 5.44 8.17 11.66 16.31 13 5.3165 0.4566 −0.5778 3.7347 2.74 3.16 3.85 5.32 7.91 11.24 15.74 13.5 5.1723 0.4417 −0.6236 3.7404 2.74 3.13 3.79 5.17 7.62 10.76 15.05 14 5.0096 0.4270 −0.6718 3.7345 2.72 3.09 3.71 5.01 7.30 10.25 14.33 14.5 4.8405 0.4130 −0.7220 3.7191 2.69 3.05 3.63 4.84 6.98 9.76 13.64 15 4.6786 0.4001 −0.7736 3.6995 2.66 3.00 3.54 4.68 6.68 9.30 13.02 15.5 4.5328 0.3883 −0.8253 3.6730 2.63 2.95 3.46 4.53 6.41 8.89 12.49 16 4.4054 0.3778 −0.8752 3.6340 2.60 2.90 3.39 4.41 6.18 8.54 12.04 16.5 4.2974 0.3687 −0.9217 3.5769 2.58 2.87 3.34 4.30 5.98 8.25 11.68 17 4.2135 0.3604 −0.9645 3.5010 2.56 2.84 3.29 4.21 5.82 8.01 11.40 17.5 4.1592 0.3521 −1.0039 3.4112 2.56 2.84 3.28 4.16 5.70 7.81 11.17 18 4.1304 0.3435 −1.0395 3.3156 2.57 2.85 3.28 4.13 5.61 7.65 10.95 18.5 4.1142 0.3347 −1.0703 3.2195 2.59 2.86 3.29 4.11 5.53 7.49 10.70 19 4.0987 0.3261 −1.0957 3.1256 2.61 2.88 3.30 4.10 5.46 7.34 10.43
Figure 1 Percentile curves for biceps skinfold thickness for male and female Canadian children and youth aged 6–19 years.
these differences reflect the higher rate of obesity in the US compared to Canada (Ng et al., 2014) or the use of a broader age category and the influence of increasing SFT in early adulthood.
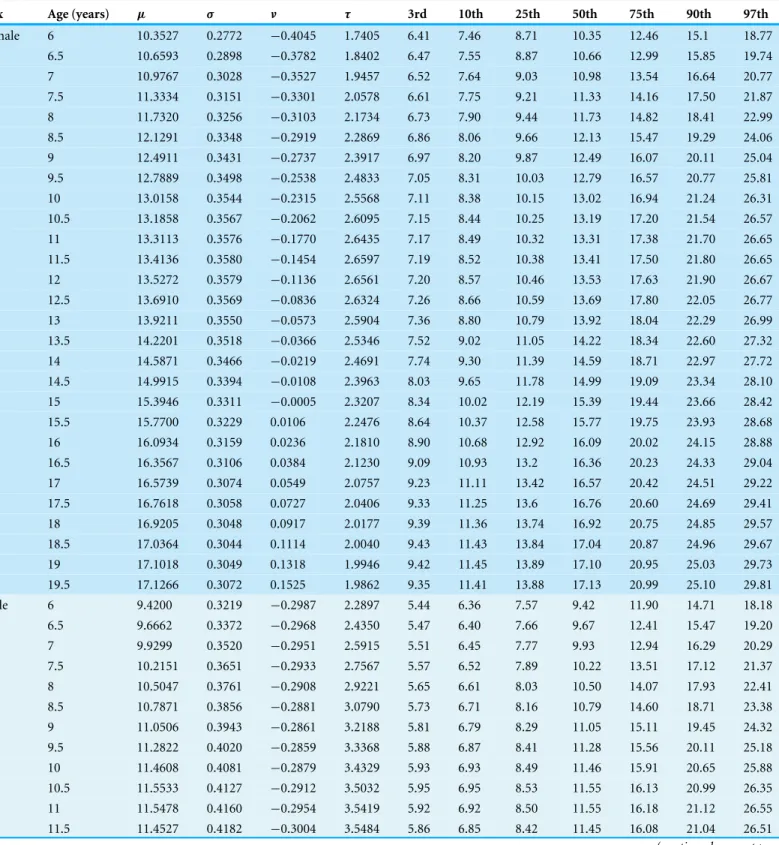
Table 4 Parameter values (µ,σ,ν,τ) and percentiles of triceps skinfold thickness (mm) by age and sex for Canadian children and youth aged
6–19 years.
Sex Age (years) µ σ ν τ 3rd 10th 25th 50th 75th 90th 97th
Female 6 10.3527 0.2772 −0.4045 1.7405 6.41 7.46 8.71 10.35 12.46 15.1 18.77 6.5 10.6593 0.2898 −0.3782 1.8402 6.47 7.55 8.87 10.66 12.99 15.85 19.74 7 10.9767 0.3028 −0.3527 1.9457 6.52 7.64 9.03 10.98 13.54 16.64 20.77 7.5 11.3334 0.3151 −0.3301 2.0578 6.61 7.75 9.21 11.33 14.16 17.50 21.87 8 11.7320 0.3256 −0.3103 2.1734 6.73 7.90 9.44 11.73 14.82 18.41 22.99 8.5 12.1291 0.3348 −0.2919 2.2869 6.86 8.06 9.66 12.13 15.47 19.29 24.06 9 12.4911 0.3431 −0.2737 2.3917 6.97 8.20 9.87 12.49 16.07 20.11 25.04 9.5 12.7889 0.3498 −0.2538 2.4833 7.05 8.31 10.03 12.79 16.57 20.77 25.81 10 13.0158 0.3544 −0.2315 2.5568 7.11 8.38 10.15 13.02 16.94 21.24 26.31 10.5 13.1858 0.3567 −0.2062 2.6095 7.15 8.44 10.25 13.19 17.20 21.54 26.57 11 13.3113 0.3576 −0.1770 2.6435 7.17 8.49 10.32 13.31 17.38 21.70 26.65 11.5 13.4136 0.3580 −0.1454 2.6597 7.19 8.52 10.38 13.41 17.50 21.80 26.65 12 13.5272 0.3579 −0.1136 2.6561 7.20 8.57 10.46 13.53 17.63 21.90 26.67 12.5 13.6910 0.3569 −0.0836 2.6324 7.26 8.66 10.59 13.69 17.80 22.05 26.77 13 13.9211 0.3550 −0.0573 2.5904 7.36 8.80 10.79 13.92 18.04 22.29 26.99 13.5 14.2201 0.3518 −0.0366 2.5346 7.52 9.02 11.05 14.22 18.34 22.60 27.32 14 14.5871 0.3466 −0.0219 2.4691 7.74 9.30 11.39 14.59 18.71 22.97 27.72 14.5 14.9915 0.3394 −0.0108 2.3963 8.03 9.65 11.78 14.99 19.09 23.34 28.10 15 15.3946 0.3311 −0.0005 2.3207 8.34 10.02 12.19 15.39 19.44 23.66 28.42 15.5 15.7700 0.3229 0.0106 2.2476 8.64 10.37 12.58 15.77 19.75 23.93 28.68 16 16.0934 0.3159 0.0236 2.1810 8.90 10.68 12.92 16.09 20.02 24.15 28.88 16.5 16.3567 0.3106 0.0384 2.1230 9.09 10.93 13.2 16.36 20.23 24.33 29.04 17 16.5739 0.3074 0.0549 2.0757 9.23 11.11 13.42 16.57 20.42 24.51 29.22 17.5 16.7618 0.3058 0.0727 2.0406 9.33 11.25 13.6 16.76 20.60 24.69 29.41 18 16.9205 0.3048 0.0917 2.0177 9.39 11.36 13.74 16.92 20.75 24.85 29.57 18.5 17.0364 0.3044 0.1114 2.0040 9.43 11.43 13.84 17.04 20.87 24.96 29.67 19 17.1018 0.3049 0.1318 1.9946 9.42 11.45 13.89 17.10 20.95 25.03 29.73 19.5 17.1266 0.3072 0.1525 1.9862 9.35 11.41 13.88 17.13 20.99 25.10 29.81 Male 6 9.4200 0.3219 −0.2987 2.2897 5.44 6.36 7.57 9.42 11.90 14.71 18.18 6.5 9.6662 0.3372 −0.2968 2.4350 5.47 6.40 7.66 9.67 12.41 15.47 19.20 7 9.9299 0.3520 −0.2951 2.5915 5.51 6.45 7.77 9.93 12.94 16.29 20.29 7.5 10.2151 0.3651 −0.2933 2.7567 5.57 6.52 7.89 10.22 13.51 17.12 21.37 8 10.5047 0.3761 −0.2908 2.9221 5.65 6.61 8.03 10.50 14.07 17.93 22.41 8.5 10.7871 0.3856 −0.2881 3.0790 5.73 6.71 8.16 10.79 14.60 18.71 23.38 9 11.0506 0.3943 −0.2861 3.2188 5.81 6.79 8.29 11.05 15.11 19.45 24.32 9.5 11.2822 0.4020 −0.2859 3.3368 5.88 6.87 8.41 11.28 15.56 20.11 25.18 10 11.4608 0.4081 −0.2879 3.4329 5.93 6.93 8.49 11.46 15.91 20.65 25.88 10.5 11.5533 0.4127 −0.2912 3.5032 5.95 6.95 8.53 11.55 16.13 20.99 26.35 11 11.5478 0.4160 −0.2954 3.5419 5.92 6.92 8.50 11.55 16.18 21.12 26.55 11.5 11.4527 0.4182 −0.3004 3.5484 5.86 6.85 8.42 11.45 16.08 21.04 26.51
Table 4(continued)
Sex Age (years) µ σ ν τ 3rd 10th 25th 50th 75th 90th 97th 12 11.2775 0.4193 −0.3065 3.5262 5.77 6.74 8.29 11.28 15.85 20.77 26.25 12.5 11.0300 0.4197 −0.3135 3.4821 5.64 6.60 8.11 11.03 15.50 20.35 25.79 13 10.7229 0.4191 −0.3213 3.4194 5.49 6.43 7.90 10.72 15.05 19.79 25.16 13.5 10.3697 0.4183 −0.3293 3.3374 5.32 6.23 7.65 10.37 14.53 19.13 24.42 14 9.9979 0.4173 −0.3373 3.2383 5.14 6.02 7.40 10.00 13.98 18.43 23.64 14.5 9.6331 0.4169 −0.3444 3.1272 4.95 5.82 7.15 9.63 13.44 17.75 22.89 15 9.3037 0.4173 −0.3498 3.0095 4.77 5.62 6.92 9.30 12.95 17.15 22.27 15.5 9.0358 0.4179 −0.3528 2.8902 4.62 5.47 6.73 9.04 12.55 16.66 21.78 16 8.8355 0.4189 −0.3524 2.7730 4.50 5.34 6.59 8.84 12.24 16.28 21.44 16.5 8.6954 0.4204 −0.3477 2.6613 4.40 5.25 6.50 8.70 12.02 16.02 21.23 17 8.6080 0.4222 −0.3389 2.5605 4.33 5.19 6.44 8.61 11.88 15.86 21.12 17.5 8.5657 0.4241 −0.3264 2.4764 4.28 5.15 6.41 8.57 11.80 15.76 21.07 18 8.5609 0.4257 −0.3112 2.4147 4.24 5.13 6.41 8.56 11.77 15.73 21.05 18.5 8.5809 0.4262 −0.2939 2.3794 4.23 5.14 6.42 8.58 11.78 15.71 21.00 19 8.6121 0.4256 −0.2749 2.3676 4.23 5.15 6.45 8.61 11.80 15.69 20.89
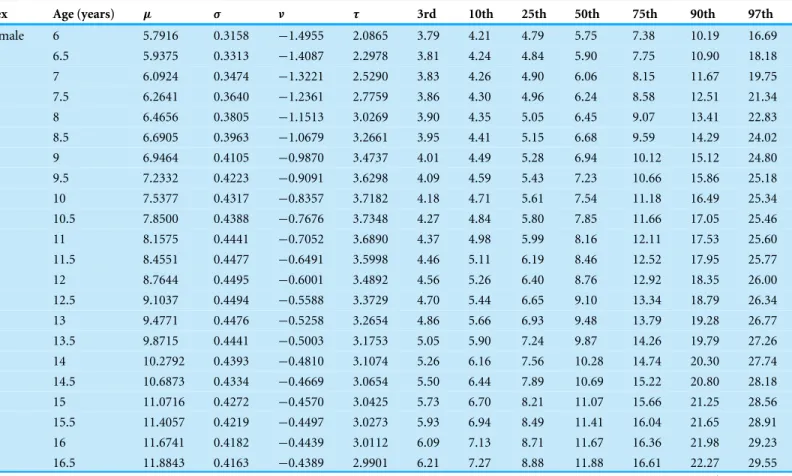
Table 5 Parameter values (µ,σ,ν,τ) and percentiles of subscapular skinfold thickness (mm) by age and sex for Canadian children and youth
aged 6–19 years.
Sex Age (years) µ σ ν τ 3rd 10th 25th 50th 75th 90th 97th
Female 6 5.7916 0.3158 −1.4955 2.0865 3.79 4.21 4.79 5.75 7.38 10.19 16.69 6.5 5.9375 0.3313 −1.4087 2.2978 3.81 4.24 4.84 5.90 7.75 10.90 18.18 7 6.0924 0.3474 −1.3221 2.5290 3.83 4.26 4.90 6.06 8.15 11.67 19.75 7.5 6.2641 0.3640 −1.2361 2.7759 3.86 4.30 4.96 6.24 8.58 12.51 21.34 8 6.4656 0.3805 −1.1513 3.0269 3.90 4.35 5.05 6.45 9.07 13.41 22.83 8.5 6.6905 0.3963 −1.0679 3.2661 3.95 4.41 5.15 6.68 9.59 14.29 24.02 9 6.9464 0.4105 −0.9870 3.4737 4.01 4.49 5.28 6.94 10.12 15.12 24.80 9.5 7.2332 0.4223 −0.9091 3.6298 4.09 4.59 5.43 7.23 10.66 15.86 25.18 10 7.5377 0.4317 −0.8357 3.7182 4.18 4.71 5.61 7.54 11.18 16.49 25.34 10.5 7.8500 0.4388 −0.7676 3.7348 4.27 4.84 5.80 7.85 11.66 17.05 25.46 11 8.1575 0.4441 −0.7052 3.6890 4.37 4.98 5.99 8.16 12.11 17.53 25.60 11.5 8.4551 0.4477 −0.6491 3.5998 4.46 5.11 6.19 8.46 12.52 17.95 25.77 12 8.7644 0.4495 −0.6001 3.4892 4.56 5.26 6.40 8.76 12.92 18.35 26.00 12.5 9.1037 0.4494 −0.5588 3.3729 4.70 5.44 6.65 9.10 13.34 18.79 26.34 13 9.4771 0.4476 −0.5258 3.2654 4.86 5.66 6.93 9.48 13.79 19.28 26.77 13.5 9.8715 0.4441 −0.5003 3.1753 5.05 5.90 7.24 9.87 14.26 19.79 27.26 14 10.2792 0.4393 −0.4810 3.1074 5.26 6.16 7.56 10.28 14.74 20.30 27.74 14.5 10.6873 0.4334 −0.4669 3.0654 5.50 6.44 7.89 10.69 15.22 20.80 28.18 15 11.0716 0.4272 −0.4570 3.0425 5.73 6.70 8.21 11.07 15.66 21.25 28.56 15.5 11.4057 0.4219 −0.4497 3.0273 5.93 6.94 8.49 11.41 16.04 21.65 28.91 16 11.6741 0.4182 −0.4439 3.0112 6.09 7.13 8.71 11.67 16.36 21.98 29.23 16.5 11.8843 0.4163 −0.4389 2.9901 6.21 7.27 8.88 11.88 16.61 22.27 29.55
Table 5(continued)
Sex Age (years) µ σ ν τ 3rd 10th 25th 50th 75th 90th 97th 17 12.0601 0.4156 −0.4342 2.9646 6.30 7.38 9.01 12.06 16.83 22.54 29.90 17.5 12.2198 0.4158 −0.4289 2.9386 6.37 7.47 9.14 12.22 17.04 22.81 30.26 18 12.3746 0.4158 −0.4219 2.9175 6.44 7.56 9.25 12.37 17.24 23.06 30.56 18.5 12.5249 0.4154 −0.4125 2.9008 6.51 7.65 9.37 12.52 17.42 23.28 30.79 19 12.6650 0.4149 −0.4006 2.8872 6.57 7.73 9.47 12.67 17.59 23.45 30.94 19.5 12.7914 0.4146 −0.3862 2.8775 6.62 7.80 9.57 12.79 17.75 23.60 31.04 Male 6 5.2871 0.3836 −1.0960 4.8016 3.21 3.51 4.05 5.29 7.70 11.28 17.20 6.5 5.5388 0.3904 −1.0977 5.0401 3.35 3.66 4.22 5.54 8.16 12.09 18.69 7 5.8079 0.3965 −1.0994 5.2828 3.49 3.82 4.41 5.81 8.64 12.96 20.26 7.5 6.0797 0.4021 −1.1001 5.5045 3.64 3.97 4.59 6.08 9.13 13.84 21.88 8 6.3370 0.4077 −1.0994 5.6729 3.78 4.12 4.77 6.33 9.60 14.71 23.55 8.5 6.5751 0.4133 −1.0974 5.7598 3.90 4.25 4.93 6.57 10.03 15.54 25.25 9 6.7747 0.4203 −1.0946 5.7440 3.99 4.36 5.06 6.77 10.42 16.36 27.21 9.5 6.9283 0.4281 −1.0916 5.6129 4.05 4.43 5.15 6.92 10.74 17.12 29.36 10 7.0323 0.4352 −1.0889 5.3693 4.07 4.47 5.21 7.02 10.96 17.69 31.32 10.5 7.0859 0.4402 −1.0870 5.0319 4.07 4.48 5.24 7.07 11.04 17.99 32.76 11 7.1096 0.4423 −1.0872 4.6343 4.07 4.49 5.26 7.08 11.03 18.00 33.47 11.5 7.1329 0.4406 −1.0906 4.2149 4.08 4.52 5.30 7.10 10.94 17.78 33.43 12 7.1737 0.4348 −1.0971 3.8024 4.11 4.58 5.37 7.14 10.83 17.39 32.71 12.5 7.2268 0.4254 −1.1057 3.4165 4.17 4.66 5.46 7.19 10.69 16.88 31.45 13 7.2915 0.4130 −1.1155 3.0718 4.24 4.76 5.57 7.26 10.54 16.30 29.85 13.5 7.3647 0.3986 −1.1256 2.7784 4.33 4.88 5.70 7.33 10.40 15.71 28.13 14 7.4489 0.3831 −1.1352 2.5417 4.44 5.01 5.85 7.42 10.28 15.16 26.46 14.5 7.5468 0.3677 −1.1438 2.3642 4.56 5.15 6.00 7.52 10.20 14.71 24.97 15 7.6669 0.3533 −1.1508 2.2436 4.70 5.31 6.16 7.65 10.18 14.39 23.76 15.5 7.8138 0.3410 −1.1553 2.1705 4.85 5.47 6.34 7.80 10.24 14.23 22.92 16 7.9923 0.3316 −1.1565 2.1345 5.01 5.64 6.52 7.98 10.37 14.24 22.45 16.5 8.2078 0.3247 −1.1538 2.1262 5.18 5.83 6.73 8.20 10.59 14.39 22.30 17 8.4528 0.3197 −1.1467 2.1359 5.36 6.03 6.94 8.44 10.86 14.65 22.35 17.5 8.7139 0.3161 −1.1350 2.1547 5.55 6.23 7.17 8.71 11.17 14.98 22.53 18 8.9755 0.3145 −1.1183 2.1759 5.72 6.42 7.38 8.97 11.50 15.35 22.83 18.5 9.2212 0.3145 −1.0964 2.1938 5.87 6.59 7.58 9.22 11.82 15.73 23.20 19 9.4349 0.3157 −1.0691 2.2048 5.98 6.72 7.75 9.43 12.10 16.08 23.54
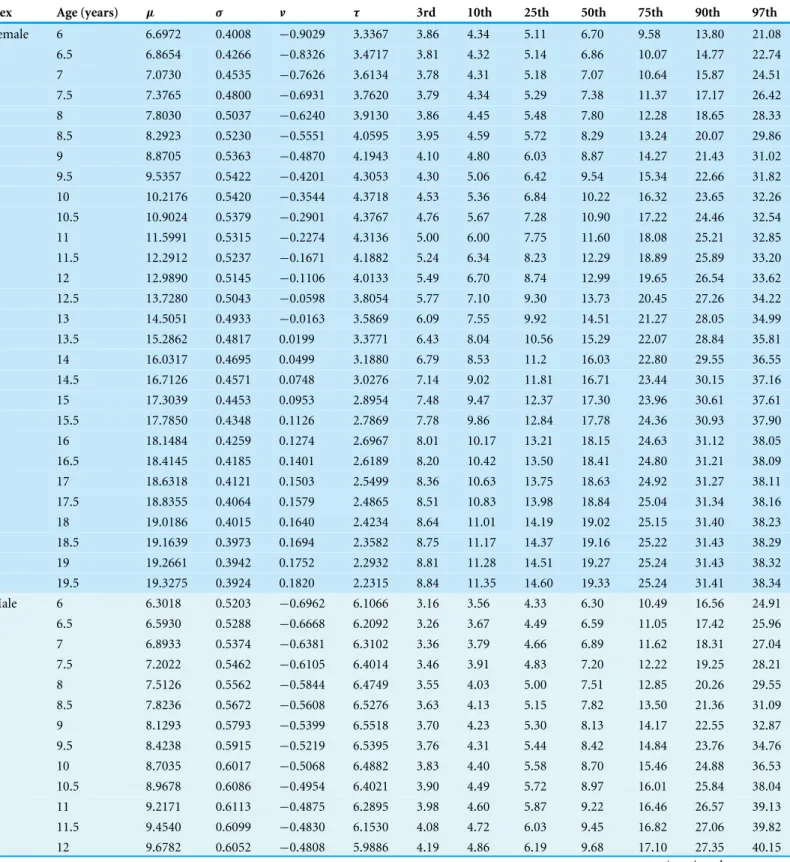
Table 6 Parameter values (µ,σ,ν,τ) and percentiles of suprailiac skinfold thickness (mm) by age and sex for Canadian children and youth
aged 6–19 years.
Sex Age (years) µ σ ν τ 3rd 10th 25th 50th 75th 90th 97th
Female 6 6.6972 0.4008 −0.9029 3.3367 3.86 4.34 5.11 6.70 9.58 13.80 21.08 6.5 6.8654 0.4266 −0.8326 3.4717 3.81 4.32 5.14 6.86 10.07 14.77 22.74 7 7.0730 0.4535 −0.7626 3.6134 3.78 4.31 5.18 7.07 10.64 15.87 24.51 7.5 7.3765 0.4800 −0.6931 3.7620 3.79 4.34 5.29 7.38 11.37 17.17 26.42 8 7.8030 0.5037 −0.6240 3.9130 3.86 4.45 5.48 7.80 12.28 18.65 28.33 8.5 8.2923 0.5230 −0.5551 4.0595 3.95 4.59 5.72 8.29 13.24 20.07 29.86 9 8.8705 0.5363 −0.4870 4.1943 4.10 4.80 6.03 8.87 14.27 21.43 31.02 9.5 9.5357 0.5422 −0.4201 4.3053 4.30 5.06 6.42 9.54 15.34 22.66 31.82 10 10.2176 0.5420 −0.3544 4.3718 4.53 5.36 6.84 10.22 16.32 23.65 32.26 10.5 10.9024 0.5379 −0.2901 4.3767 4.76 5.67 7.28 10.90 17.22 24.46 32.54 11 11.5991 0.5315 −0.2274 4.3136 5.00 6.00 7.75 11.60 18.08 25.21 32.85 11.5 12.2912 0.5237 −0.1671 4.1882 5.24 6.34 8.23 12.29 18.89 25.89 33.20 12 12.9890 0.5145 −0.1106 4.0133 5.49 6.70 8.74 12.99 19.65 26.54 33.62 12.5 13.7280 0.5043 −0.0598 3.8054 5.77 7.10 9.30 13.73 20.45 27.26 34.22 13 14.5051 0.4933 −0.0163 3.5869 6.09 7.55 9.92 14.51 21.27 28.05 34.99 13.5 15.2862 0.4817 0.0199 3.3771 6.43 8.04 10.56 15.29 22.07 28.84 35.81 14 16.0317 0.4695 0.0499 3.1880 6.79 8.53 11.2 16.03 22.80 29.55 36.55 14.5 16.7126 0.4571 0.0748 3.0276 7.14 9.02 11.81 16.71 23.44 30.15 37.16 15 17.3039 0.4453 0.0953 2.8954 7.48 9.47 12.37 17.30 23.96 30.61 37.61 15.5 17.7850 0.4348 0.1126 2.7869 7.78 9.86 12.84 17.78 24.36 30.93 37.90 16 18.1484 0.4259 0.1274 2.6967 8.01 10.17 13.21 18.15 24.63 31.12 38.05 16.5 18.4145 0.4185 0.1401 2.6189 8.20 10.42 13.50 18.41 24.80 31.21 38.09 17 18.6318 0.4121 0.1503 2.5499 8.36 10.63 13.75 18.63 24.92 31.27 38.11 17.5 18.8355 0.4064 0.1579 2.4865 8.51 10.83 13.98 18.84 25.04 31.34 38.16 18 19.0186 0.4015 0.1640 2.4234 8.64 11.01 14.19 19.02 25.15 31.40 38.23 18.5 19.1639 0.3973 0.1694 2.3582 8.75 11.17 14.37 19.16 25.22 31.43 38.29 19 19.2661 0.3942 0.1752 2.2932 8.81 11.28 14.51 19.27 25.24 31.43 38.32 19.5 19.3275 0.3924 0.1820 2.2315 8.84 11.35 14.60 19.33 25.24 31.41 38.34 Male 6 6.3018 0.5203 −0.6962 6.1066 3.16 3.56 4.33 6.30 10.49 16.56 24.91 6.5 6.5930 0.5288 −0.6668 6.2092 3.26 3.67 4.49 6.59 11.05 17.42 25.96 7 6.8933 0.5374 −0.6381 6.3102 3.36 3.79 4.66 6.89 11.62 18.31 27.04 7.5 7.2022 0.5462 −0.6105 6.4014 3.46 3.91 4.83 7.20 12.22 19.25 28.21 8 7.5126 0.5562 −0.5844 6.4749 3.55 4.03 5.00 7.51 12.85 20.26 29.55 8.5 7.8236 0.5672 −0.5608 6.5276 3.63 4.13 5.15 7.82 13.50 21.36 31.09 9 8.1293 0.5793 −0.5399 6.5518 3.70 4.23 5.30 8.13 14.17 22.55 32.87 9.5 8.4238 0.5915 −0.5219 6.5395 3.76 4.31 5.44 8.42 14.84 23.76 34.76 10 8.7035 0.6017 −0.5068 6.4882 3.83 4.40 5.58 8.70 15.46 24.88 36.53 10.5 8.9678 0.6086 −0.4954 6.4021 3.90 4.49 5.72 8.97 16.01 25.84 38.04 11 9.2171 0.6113 −0.4875 6.2895 3.98 4.60 5.87 9.22 16.46 26.57 39.13 11.5 9.4540 0.6099 −0.4830 6.1530 4.08 4.72 6.03 9.45 16.82 27.06 39.82 12 9.6782 0.6052 −0.4808 5.9886 4.19 4.86 6.19 9.68 17.10 27.35 40.15
Table 6(continued)
Sex Age (years) µ σ ν τ 3rd 10th 25th 50th 75th 90th 97th 12.5 9.8876 0.5978 −0.4800 5.7993 4.31 5.00 6.36 9.89 17.30 27.44 40.13 13 10.0850 0.5877 −0.4799 5.5886 4.44 5.15 6.54 10.09 17.42 27.35 39.77 13.5 10.2667 0.5761 −0.4790 5.3571 4.57 5.31 6.72 10.27 17.47 27.10 39.16 14 10.4305 0.5638 −0.4759 5.1099 4.70 5.46 6.90 10.43 17.46 26.73 38.33 14.5 10.5803 0.5516 −0.4696 4.8578 4.81 5.60 7.06 10.58 17.42 26.31 37.43 15 10.7272 0.5403 −0.4599 4.6105 4.92 5.74 7.23 10.73 17.39 25.91 36.56 15.5 10.8808 0.5305 −0.4468 4.3691 5.02 5.87 7.39 10.88 17.37 25.58 35.84 16 11.0471 0.5234 −0.4305 4.1337 5.10 5.99 7.55 11.05 17.42 25.40 35.41 16.5 11.2298 0.5191 −0.4113 3.9077 5.17 6.11 7.71 11.23 17.53 25.37 35.28 17 11.4314 0.5170 −0.3898 3.6947 5.23 6.21 7.87 11.43 17.69 25.47 35.38 17.5 11.6547 0.5158 −0.3666 3.4997 5.29 6.32 8.04 11.65 17.90 25.65 35.59 18 11.8974 0.5153 −0.3423 3.3301 5.35 6.44 8.23 11.90 18.15 25.90 35.90 18.5 12.1575 0.5147 −0.3177 3.1943 5.41 6.56 8.42 12.16 18.43 26.19 36.21 19 12.4347 0.5131 −0.2935 3.0962 5.50 6.70 8.62 12.43 18.74 26.47 36.45
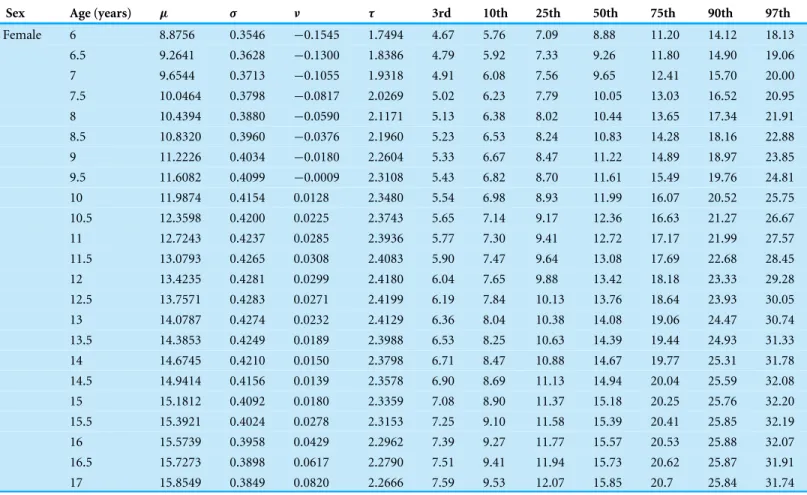
Table 7 Parameter values (µ,σ,ν,τ) and percentiles of medial calf skinfold thickness (mm) by age and sex for Canadian children and youth
aged 6–19 years.
Sex Age (years) µ σ ν τ 3rd 10th 25th 50th 75th 90th 97th
Female 6 8.8756 0.3546 −0.1545 1.7494 4.67 5.76 7.09 8.88 11.20 14.12 18.13 6.5 9.2641 0.3628 −0.1300 1.8386 4.79 5.92 7.33 9.26 11.80 14.90 19.06 7 9.6544 0.3713 −0.1055 1.9318 4.91 6.08 7.56 9.65 12.41 15.70 20.00 7.5 10.0464 0.3798 −0.0817 2.0269 5.02 6.23 7.79 10.05 13.03 16.52 20.95 8 10.4394 0.3880 −0.0590 2.1171 5.13 6.38 8.02 10.44 13.65 17.34 21.91 8.5 10.8320 0.3960 −0.0376 2.1960 5.23 6.53 8.24 10.83 14.28 18.16 22.88 9 11.2226 0.4034 −0.0180 2.2604 5.33 6.67 8.47 11.22 14.89 18.97 23.85 9.5 11.6082 0.4099 −0.0009 2.3108 5.43 6.82 8.70 11.61 15.49 19.76 24.81 10 11.9874 0.4154 0.0128 2.3480 5.54 6.98 8.93 11.99 16.07 20.52 25.75 10.5 12.3598 0.4200 0.0225 2.3743 5.65 7.14 9.17 12.36 16.63 21.27 26.67 11 12.7243 0.4237 0.0285 2.3936 5.77 7.30 9.41 12.72 17.17 21.99 27.57 11.5 13.0793 0.4265 0.0308 2.4083 5.90 7.47 9.64 13.08 17.69 22.68 28.45 12 13.4235 0.4281 0.0299 2.4180 6.04 7.65 9.88 13.42 18.18 23.33 29.28 12.5 13.7571 0.4283 0.0271 2.4199 6.19 7.84 10.13 13.76 18.64 23.93 30.05 13 14.0787 0.4274 0.0232 2.4129 6.36 8.04 10.38 14.08 19.06 24.47 30.74 13.5 14.3853 0.4249 0.0189 2.3988 6.53 8.25 10.63 14.39 19.44 24.93 31.33 14 14.6745 0.4210 0.0150 2.3798 6.71 8.47 10.88 14.67 19.77 25.31 31.78 14.5 14.9414 0.4156 0.0139 2.3578 6.90 8.69 11.13 14.94 20.04 25.59 32.08 15 15.1812 0.4092 0.0180 2.3359 7.08 8.90 11.37 15.18 20.25 25.76 32.20 15.5 15.3921 0.4024 0.0278 2.3153 7.25 9.10 11.58 15.39 20.41 25.85 32.19 16 15.5739 0.3958 0.0429 2.2962 7.39 9.27 11.77 15.57 20.53 25.88 32.07 16.5 15.7273 0.3898 0.0617 2.2790 7.51 9.41 11.94 15.73 20.62 25.87 31.91 17 15.8549 0.3849 0.0820 2.2666 7.59 9.53 12.07 15.85 20.7 25.84 31.74
Table 7(continued)
Sex Age (years) µ σ ν τ 3rd 10th 25th 50th 75th 90th 97th 17.5 15.9602 0.3811 0.1014 2.2608 7.66 9.62 12.18 15.96 20.76 25.83 31.61 18 16.0453 0.3785 0.1179 2.2603 7.70 9.68 12.26 16.05 20.82 25.84 31.52 18.5 16.1127 0.3774 0.1309 2.2605 7.73 9.72 12.32 16.11 20.89 25.88 31.50 19 16.1645 0.3779 0.1405 2.2579 7.72 9.74 12.35 16.16 20.95 25.95 31.57 19.5 16.2024 0.3800 0.1470 2.2522 7.69 9.72 12.36 16.20 21.02 26.06 31.71 Male 6 7.6139 0.3532 −0.4290 2.0886 4.25 5.03 6.05 7.61 9.82 12.62 16.57 6.5 7.9514 0.3740 −0.4000 2.2278 4.30 5.11 6.21 7.95 10.47 13.61 17.96 7 8.3241 0.3942 −0.3711 2.3743 4.37 5.21 6.38 8.32 11.18 14.70 19.45 7.5 8.7435 0.4118 −0.3426 2.5227 4.47 5.34 6.59 8.74 11.95 15.84 20.96 8 9.1952 0.4264 −0.3147 2.6629 4.58 5.50 6.84 9.20 12.75 17.00 22.45 8.5 9.6377 0.4404 −0.2878 2.7854 4.69 5.64 7.07 9.64 13.55 18.14 23.92 9 10.0372 0.4568 −0.2627 2.8827 4.75 5.74 7.25 10.04 14.31 19.31 25.50 9.5 10.3692 0.4757 −0.2405 2.9490 4.75 5.78 7.38 10.37 15.02 20.46 27.15 10 10.6239 0.4941 −0.2228 2.9851 4.71 5.78 7.45 10.62 15.62 21.48 28.69 10.5 10.7952 0.5074 −0.2113 2.9966 4.68 5.77 7.49 10.80 16.03 22.21 29.84 11 10.9036 0.5136 −0.2077 2.9961 4.67 5.79 7.53 10.90 16.27 22.62 30.50 11.5 10.9717 0.5145 −0.2128 2.9980 4.71 5.82 7.58 10.97 16.39 22.83 30.84 12 11.0043 0.5115 −0.2262 3.0093 4.76 5.87 7.62 11.00 16.43 22.88 30.95 12.5 10.9698 0.5073 −0.2460 3.0302 4.81 5.90 7.63 10.97 16.35 22.80 30.88 13 10.8526 0.5017 −0.2700 3.0602 4.84 5.90 7.58 10.85 16.15 22.51 30.54 13.5 10.6446 0.4947 −0.2959 3.0972 4.83 5.86 7.48 10.64 15.79 22.00 29.86 14 10.3584 0.4868 −0.3214 3.1372 4.80 5.77 7.32 10.36 15.31 21.30 28.89 14.5 10.0042 0.4798 −0.3446 3.1788 4.71 5.64 7.11 10.00 14.75 20.47 27.75 15 9.6173 0.4750 −0.3643 3.2226 4.58 5.46 6.85 9.62 14.15 19.64 26.61 15.5 9.2415 0.4714 −0.3799 3.2679 4.45 5.28 6.60 9.24 13.59 18.85 25.52 16 8.9001 0.4694 −0.3911 3.3148 4.31 5.10 6.37 8.90 13.09 18.15 24.57 16.5 8.5901 0.4703 −0.3978 3.3649 4.17 4.92 6.14 8.59 12.66 17.59 23.82 17 8.3241 0.4727 −0.4010 3.4191 4.03 4.76 5.93 8.32 12.32 17.15 23.24 17.5 8.1317 0.4742 −0.4017 3.4752 3.93 4.64 5.79 8.13 12.06 16.81 22.75 18 8.0090 0.4733 −0.4007 3.5298 3.88 4.57 5.70 8.01 11.88 16.53 22.31 18.5 7.9196 0.4702 −0.3983 3.5766 3.86 4.53 5.64 7.92 11.73 16.25 21.81 19 7.8366 0.4643 −0.3943 3.6102 3.84 4.51 5.60 7.84 11.55 15.90 21.17 19.5 7.7663 0.4572 −0.3887 3.6266 3.84 4.50 5.57 7.77 11.37 15.55 20.53
Figure 2 Percentile curves for triceps skinfold thickness for male and female Canadian children and youth aged 6–19 years.
Figure 3 Percentile curves for subscapular skinfold thickness for male and female Canadian children and youth aged 6–19 years.
Figure 4 Percentile curves for suprailiac skinfold thickness for male and female Canadian children and youth aged 6–19 years.
Figure 5 Percentile curves for medial calf skinfold thickness for male and female Canadian children and youth aged 6–19 years.
healthier, and fitter individuals. Our study is limited by the relatively small sample size, and the cross-sectional nature of the data; longitudinal data may more accurately reflect how body fatness changes with age. The omission of SFT measurements in children with a BMI greater than 30 resulted in an exclusion of 4% of children, which may have resulted in a slight downward shift of the percentiles compared to the full sample. While the flexibility of the GAMLSS method is a notable strength, its flexibility also means that the curves may differ considerably based on the parameter choices made by the researcher.
This study has presented percentile curves for SFT in a representative sample of Canadian children and youth. Since we did not examine any relationships with health outcomes or disease markers, the data should be considered as a reference for future studies and not as a growth standard.
ACKNOWLEDGEMENTS
The analysis presented in this paper was conducted at the Atlantic Research Data Centre, which is part of the Canadian Research Data Centre Network (CRDCN). The services and activities provided by the Atlantic Research Data Centre are made possible by the financial or in-kind support of the SSHRC, the CIHR, the CFI, Statistics Canada, and Dalhousie University. The views expressed in this paper do not necessarily represent the views of the CRDCN or its partners.
ADDITIONAL INFORMATION AND DECLARATIONS
Funding
This work was supported by an IWK Health Centre (http://www.iwk.nshealth.ca) Establishment Grant awarded to Dr Stefan Kuhle (#09020) and an IWK Health Centre Research Associate Award awarded to Dr Jillian Ashley-Martin (#18396). The funders had no role in study design, data collection and analysis, decision to publish, or preparation of the manuscript.
Grant Disclosures
The following grant information was disclosed by the authors: IWK Health Centre Establishment: #09020.
IWK Health Centre Research Associate Award: #18396.
Competing Interests
The authors declare there are no competing interests.
Author Contributions
• Stefan Kuhle and Bryan Maguire conceived and designed the experiments, analyzed the data, wrote the paper, prepared figures and/or tables, reviewed drafts of the paper.
• Jillian Ashley-Martin conceived and designed the experiments, wrote the paper, reviewed drafts of the paper.
Human Ethics
The following information was supplied relating to ethical approvals (i.e., approving body and any reference numbers):
All processes used for cycles 1 and 2 of the CHMS were reviewed and approved by the Health Canada Research Ethics Board to ensure that internationally recognized ethical standards for human research were met and maintained. Written informed consent was obtained from all participants aged 14 years and older; parents or guardians gave consent on behalf of children aged 6–13 years, while the child provided his or her assent to participate. The current project was approved by the IWK Health Centre Research Ethics Board, Halifax, NS, Canada (File # 1014413).
Data Availability
The following information was supplied regarding data availability:
Data are only available through the Statistics Canada Research Data Centres for researchers who meet the criteria for access to confidential data.
The application process is described athttp://www.statcan.gc.ca/eng/rdc/process. Researchers submit an application form and project proposal to the Statistics Canada Research Data Centres Program. Upon approval they have to undergo a security check. Once completed they get access to one of the Research Data Centres in Canada to analyze the data. All output produced at the centres must be vetted by a Statistics Canada analyst before it is released to the researcher for publication.
REFERENCES
Addo OY, Himes JH. 2010.Reference curves for triceps and subscapular skinfold thicknesses in US children and adolescents.American Journal of Clinical Nutrition 91:635–642DOI 10.3945/ajcn.2009.28385.
Bedogni G, Iughetti L, Ferrari M, Malavolti M, Poli M, Bernasconi S, Battistini N. 2003. Sensitivity and specificity of body mass index and skinfold thicknesses in detecting excess adiposity in children aged 8–12 years.Annals of Human Biology30:132–139 DOI 10.1080/0301446021000033409.
Boeke CE, Oken E, Kleinman KP, Rifas-Shiman SL, Taveras EM, Gillman MW. 2013. Correlations among adiposity measures in school-aged children.BMC Pediatrics 13:99DOI 10.1186/1471-2431-13-99.
Bowen PE, Custer PB. 1984.Reference values and age-related trends for arm muscle area, arm fat area, and sum of skinfolds for United States adults.Journal of the American College of Nutrition3:357–376DOI 10.1080/07315724.1984.10720060. Brambilla P, Bedogni G, Moreno LA, Goran MI, Gutin B, Fox KR, Peters DM, Barbeau
P, De Simone M, Pietrobelli A. 2006.Crossvalidation of anthropometry against magnetic resonance imaging for the assessment of visceral and subcutaneous adipose tissue in children.International Journal of Obesity30:23–30
Brannsether B, Roelants M, Bjerknes R, Júlíusson PB. 2013.References and cutoffs for triceps and subscapular skinfolds in Norwegian children 4–16 years of age.European Journal of Clinical Nutrition67:928–933DOI 10.1038/ejcn.2013.91.
Cole TJ, Bellizzi MC, Flegal KM, Dietz WH. 2000.Establishing a standard definition for child overweight and obesity worldwide: international survey.BMJ 320:1240–1243 DOI 10.1136/bmj.320.7244.1240.
Cole TJ, Green PJ. 1992.Smoothing reference centile curves: the LMS method and penal-ized likelihood.Statistics in Medicine11:1305–1319DOI 10.1002/sim.4780111005. Cole TJ, Lobstein T. 2012.Extended international (IOTF) body mass index cut-offs for
thinness, overweight and obesity.Pediatric Obesity7:284–294 DOI 10.1111/j.2047-6310.2012.00064.x.
Dai S, Fulton JE, Harrist RB, Grunbaum JA, Steffen LM, Labarthe DR. 2009.Blood
lipids in children: age-related patterns and association with body-fat indices: Project HeartBeat.American Journal of Preventive Medicine37:S56–S64
DOI 10.1016/j.amepre.2009.04.012.
De Onis M, Onyango A, Borghi E, Siyam A, Nishida C, Pinol A. 2009.WHO child growth
standards: growth velocity based on weight, length and head circumference: methods and
development. Geneva: WHO.
De Onis M, Onyango AW, Borghi E, Siyam A, Nishida C, Siekmann J. 2007.
Develop-ment of a WHO growth reference for school-aged children and adolescents.Bulletin of the World Health Organization85:660–667 DOI 10.2471/BLT.07.043497.
Frankenfield DC, Rowe WA, Cooney RN, Smith JS, Becker D. 2001.Limits of body
mass index to detect obesity and predict body composition.Nutrition17:26–30 DOI 10.1016/S0899-9007(00)00471-8.
Freedman DS, Horlick M, Berenson GS. 2013.A comparison of the Slaughter
skinfold-thickness equations and BMI in predicting body fatness and cardiovascular disease risk factor levels in children.American Journal of Clinical Nutrition98:1417–1424 DOI 10.3945/ajcn.113.065961.
Freedman DS, Serdula MK, Srinivasan SR, Berenson GS. 1999.Relation of
circum-ferences and skinfold thicknesses to lipid and insulin concentrations in children and adolescents: the Bogalusa Heart Study.American Journal of Clinical Nutrition 69:308–317.
Going SB, Lohman TG, Cussler EC, Williams DP, Morrison JA, Horn PS. 2011.Percent
body fat and chronic disease risk factors in US children and youth.American Journal of Preventive Medicine41:S77–S86DOI 10.1016/j.amepre.2011.07.006.
Haas GM, Liepold E, Schwandt P. 2011.Percentile curves for fat patterning in German adolescents.World Journal of Pediatrics7:16–23DOI 10.1007/s12519-011-0241-4. Heude B, Kettaneh A, De Lauzon Guillain B, Lommez A, Borys JM, Ducimetière P,
Charles MA, Fleurbaix LVSG. 2006.Growth curves of anthropometric indices in a general population of French children and comparison with reference data.European Journal of Clinical Nutrition60:1430–1436DOI 10.1038/sj.ejcn.1602474.
subscapular, and abdominal skinfold thicknesses in Polish children and adolescents– the OLAF study.European Journal of Pediatrics171:1215–1221
DOI 10.1007/s00431-012-1717-5.
Kelishadi R, Mirmoghtadaee P, Najafi H, Keikha M. 2015.Systematic review on the association of abdominal obesity in children and adolescents with cardio-metabolic risk factors.Journal of Research in Medical Sciences20:294–307.
Klimek-Piotrowska W, Koziej M, Hołda MK, Piątek K, Wszołek K, Tyszka A, Kmiotek
E, Pliczko M, Śliwińska A, Krauss K, Miszczyk M, Walocha J. 2015.Anthropometry
and body composition of adolescents in Cracow, Poland.PLoS ONE10:e0122274 DOI 10.1371/journal.pone.0122274.
Kromeyer-Hauschild K, Glässer N, Zellner K. 2012.Percentile curves for skinfold thickness in 7- to 14-year-old children and adolescents from Jena, Germany.
European Journal of Clinical Nutrition66:613–621DOI 10.1038/ejcn.2011.216. Kuhle S, Maguire B, Ata N, Hamilton D. 2015.Percentile curves for anthropometric
measures for Canadian children and youth.PLoS ONE 10:e0132891 DOI 10.1371/journal.pone.0132891.
Laurson KR, Eisenmann JC, Welk GJ. 2011.Body fat percentile curves for U.S. children and adolescents.American Journal of Preventive Medicine41:S87–S92
DOI 10.1016/j.amepre.2011.06.044.
McCarthy HD, Ashwell M. 2006.A study of central fatness using waist-to-height ratios in UK children and adolescents over two decades supports the simple message— ‘keep your waist circumference to less than half your height’.International Journal of Obesity30:988–992DOI 10.1038/sj.ijo.0803226.
Moreno LA, Mesana MI, González-Gross M, Gil CM, Ortega FB, Fleta J, Wärnberg J, León J, Marcos A, Bueno M. 2007.Body fat distribution reference standards in Spanish adolescents: the AVENA Study.International Journal of Obesity 31:1798–1805DOI 10.1038/sj.ijo.0803670.
Nagy P, Kovacs E, Moreno LA, Veidebaum T, Tornaritis M, Kourides Y, Siani A, Lauria F, Sioen I, Claessens M, Mårild S, Lissner L, Bammann K, Intemann T,
Buck C, Pigeot I, Ahrens W, Molnár D, IDEFICS Consortium. 2014.Percentile
reference values for anthropometric body composition indices in European children from the IDEFICS study.International Journal of Obesity38(Suppl 2):S15–S25 DOI 10.1038/ijo.2014.131.
Neuhauser HK, Schienkiewitz A, Schaffrath-Rosario A, Dortschy R, Kurth BM. 2011. Referenzperzentile für anthropometrische Maßzahlen und Blutdruck aus der Studie zur Gesundheit von Kindern und Jugendlichen in Deutschland (KiGGS) 2003–2006. Berlin: Robert-Koch Institut.
Durrani AM, Esteghamati A, Farzadfar F, Fay DF, Feigin VL, Flaxman A, Forouzanfar MH, Goto A, Green MA, Gupta R, Hafezi-Nejad N, Hankey GJ, Harewood HC, Havmoeller R, Hay S, Hernandez L, Husseini A, Idrisov BT, Ikeda N, Islami F, Jahangir E, Jassal SK, Jee SH, Jeffreys M, Jonas JB, Kabagambe EK, Khalifa SE, Kengne AP, Khader YS, Khang YH, Kim D, Kimokoti RW, Kinge JM, Kokubo Y, Kosen S, Kwan G, Lai T, Leinsalu M, Li Y, Liang X, Liu S, Logroscino G, Lotufo PA, Lu Y, Ma J, Mainoo NK, Mensah GA, Merriman TR, Mokdad AH, Moschandreas J, Naghavi M, Naheed A, Nand D, Narayan KM, Nelson EL, Neuhouser ML, Nisar MI, Ohkubo T, Oti SO, Pedroza A, Prabhakaran D, Roy N, Sampson U, Seo H, Sepanlou SG, Shibuya K, Shiri R, Shiue I, Singh GM, Singh JA, Skirbekk V, Stapelberg NJ, Sturua L, Sykes BL, Tobias M, Tran BX, Trasande L, Toyoshima H, Van de Vijver S, Vasankari TJ, Veerman JL, Velasquez-Melendez G, Vlassov VV, Vollset SE, Vos T, Wang C, Wang X, Weiderpass E, Werdecker A, Wright JL, Yang YC, Yatsuya H, Yoon J, Yoon SJ, Zhao Y, Zhou M, Zhu S, Lopez AD, Murray CJ, Gakidou E. 2014.Global, regional, and national prevalence of overweight and obesity in children and adults during 1980–2013: a systematic analysis for the Global Burden of Disease Study 2013.Lancet 384:766–781 DOI 10.1016/S0140-6736(14)60460-8.
Nooyens AC, Koppes LL, Visscher TL, Twisk JW, Kemper HC, Schuit AJ, Van Mechelen W, Seidell JC. 2007.Adolescent skinfold thickness is a better predictor of high body fatness in adults than is body mass index: the Amsterdam Growth and Health Longitudinal Study.American Journal of Clinical Nutrition85:1533–1539.
Petkeviciene J, Klumbiene J, Kriaucioniene V, Raskiliene A, Sakyte E, Ceponiene I.
2015.Anthropometric measurements in childhood and prediction of cardiovascular
risk factors in adulthood: Kaunas cardiovascular risk cohort study.BMC Public Health15:218 DOI 10.1186/s12889-015-1528-5.
R Core Team. 2016.R: a language and environment for statistical computing. Vienna: R Foundation for Statistical Computing.Available athttps:// www.r-project.org/
(accessed on 20 June 2016).
Rigby RA, Stasinopoulos DM. 2004.Smooth centile curves for skew and kurtotic data modelled using the Box–Cox power exponential distribution.Statistics in Medicine 23:3053–3076DOI 10.1002/sim.1861.
Rigby RA, Stasinopoulos DM. 2006.Using the Box–Cox t distribution in GAMLSS to
model skewness and kurtosis.Statistical Modelling6:209–229 DOI 10.1191/1471082X06st122oa.
Rodríguez G, Moreno LA, Blay MG, Blay VA, Fleta J, Sarría A, Bueno M,
AVENA-Zaragoza Study Group. 2005.Body fat measurement in adolescents: comparison
of skinfold thickness equations with dual-energy X-ray absorptiometry.European Journal of Clinical Nutrition59:1158–1166DOI 10.1038/sj.ejcn.1602226.
Shields M. 2006.Overweight and obesity among children and youth.Health Reports 17:27–42.
Slaughter MH, Lohman TG, Boileau RA, Horswill CA, Stillman RJ, Van Loan MD, Bemben DA. 1988.Skinfold equations for estimation of body fatness in children and youth.Human Biology60:709–723.
Statistics Canada. 2011.Canadian Health Measures Survey (CHMS) data user guide: cycle 1. Ottawa: Statistics Canada.
Statistics Canada. 2012.Canadian Health Measures Survey (CHMS) data user guide: cycle 2. Ottawa: Statistics Canada.
Statistics Canada. 2013.Canadian Health Measures Survey (CHMS): instructions for combining cycle 1 and cycle 2 data. Ottawa: Statistics Canada.
Steinberger J, Jacobs DR, Raatz S, Moran A, Hong CP, Sinaiko AR. 2005.Comparison
of body fatness measurements by BMI and skinfolds vs dual energy X-ray absorp-tiometry and their relation to cardiovascular risk factors in adolescents.International Journal of Obesity29:1346–1352DOI 10.1038/sj.ijo.0803026.
Tran BX, Nair AV, Kuhle S, Ohinmaa A, Veugelers PJ. 2013.Cost analyses of obesity in Canada: scope, quality, and implications.Cost Effectiveness and Resource Allocation 11:3DOI 10.1186/1478-7547-11-3.
Van Buuren S, Fredriks M. 2001.Worm plot: a simple diagnostic device for modelling growth reference curves.Statistics in Medicine20:1259–1277DOI 10.1002/sim.746. Van der Sluis IM, De Ridder MA, Boot AM, Krenning EP, De Muinck Keizer-Schrama
SM. 2002.Reference data for bone density and body composition measured with
dual energy x ray absorptiometry in white children and young adults.Archives of Disease in Childhood87:341–347DOI 10.1136/adc.87.4.341.
Wells JC, Fewtrell MS. 2006.Measuring body composition.Archives of Disease in Childhood91:612–617DOI 10.1136/adc.2005.085522.
Wells JC, Fuller NJ, Dewit O, Fewtrell MS, Elia M, Cole TJ. 1999.Four-component model of body composition in children: density and hydration of fat-free mass and comparison with simpler models.American Journal of Clinical Nutrition69:904–912. Wells JC, Williams JE, Chomtho S, Darch T, Grijalva-Eternod C, Kennedy K, Haroun
D, Wilson C, Cole TJ, Fewtrell MS. 2012.Body-composition reference data for sim-ple and reference techniques and a 4-component model: a new UK reference child.
American Journal of Clinical Nutrition96:1316–1326DOI 10.3945/ajcn.112.036970. Wohlfahrt-Veje C, Tinggaard J, Winther K, Mouritsen A, Hagen CP, Mieritz MG, De
Renzy-Martin KT, Boas M, Petersen JH, Main KM. 2014.Body fat throughout
childhood in 2647 healthy Danish children: agreement of BMI, waist circumference, skinfolds with dual X-ray absorptiometry.European Journal of Clinical Nutrition 68:664–670DOI 10.1038/ejcn.2013.282.