RAPID COMMUNICATION
Anthropometric indicators as predictors of serum
triglycerides and hypertriglyceridemia in older adults
Raildo Silva Coqueiro,IDaniele Fares,IIAline Rodrigues Barbosa,IITassla De´l Rei Oliveria Passos,I Wanderley Matos Reis-Ju´nior,IMarcos Henrique FernandesI
IDepartamento de Sau´de, Universidade Estadual do Sudoeste da Bahia, Jequie´, CEP 45206190, Bahia, BrazilIICentro de Desportos, Universidade Federal de
Santa Catarina – Campus Trindade, s/n, Floriano´polis, CEP 88040900, Santa Catarina, Brazil
OBJECTIVES: To compare the relation between anthropometric indicators and serum triglycerides, and to identify the indicators most strongly associated with hypertriglyceridemia in older adults.
METHODS:A population-based, cross-sectional study conducted with 316 subjects ($60 years old) in 2011. The following were checked: triglycerides, body mass index, waist-to-hip ratio, waist-to-height ratio, conicity index, body adiposity index, triceps skinfold thickness, and waist and calf circumference.
RESULTS:Linear regression analyses showed that waist-to-hip ration (R2¼0.065) in women and body mass index (R2¼0.123) in men were the indicators that best correlated with triglyceride. Poisson’s regression showed that
body mass index, calf circumference, and triceps skinfold thickness were the only indicators associated with hypertriglyceridemia (triglycerides$150 mg/dl) among female subjects. For male subjects, with the exception of waist-to-hip ratio and the conicity index, all other indicators were associated with hypertriglyceridemia.
CONCLUSION:The anthropometric indicators that best explain the variability of triglyceride differ according to sex. Body mass index, calf circumference, and triceps skinfold thickness are the best anthropometric indicators for hypertriglyceridemia in older adults of both sexes.
KEYWORDS: Anthropometry; Health of the Elderly; Risk Factors; Dyslipidemia.
Coqueiro RS, Fares D, Barbosa AR, Passos TDO, Reis-Ju´nior WM, Fernandes MH. Anthropometric indicators as predictors of serum triglycerides and hypertriglyceridemia in older adults. MEDICALEXPRESS. 2014 Aug;1(4):202-205.
Received for publication onMay 15 2014;First review completed onMay 24 2014;Accepted for publication onJune 04 2014
E-mail: [email protected]
B INTRODUCTION
High serum triglycerides (hypertriglyceridemia) are recognized as a public health problem. Alone or accompanied by metabolic disorders, hypertriglyceridemia is a risk factor for cardiovascular disease1. Heredity2, lifestyle, inadequate nutrition3, sedentarism4, and excess body fat5,6 are factors associated with the lipid profile. Furthermore, excess body fat is one of the main factors associated with hypertriglyceridemia in adults and older adults7,8.
In epidemiological studies that address hypertriglycer-idemia, the presence of excess body fat is identified by anthropometric measures, including body mass index (BMI), waist circumference6 – 8, and waist-to-height ratio7. However, some other methods, such as computed tomography and magnetic resonance imaging, can also be used to assess body composition. Anthropometric measurements are relatively easy to take and are low in cost compared with more accurate methods. In addition, they can be used in household surveys, clinical practices, and primary health care9.
Studies comparing the association between anthropo-metric indicators and serum triglyceride levels have focused on only a few measurements or indices6 – 8. Other anthropo-metric indicators in this association still need to be studied. Furthermore, most studies were carried out with adults, and their results are far from consistent7,8. Therefore, determin-ing the best anthropometric indicator for hypertriglyceride-mia based solely on these studies is not possible. This research issue has been the subject of only limited investigation6involving older adults.
The objectives of the present study are as follows: (i) to compare the relation of anthropometric indicators with serum triglycerides and (ii) to identify the indicators most associated with hypertriglyceridemia.
B METHODS
The present investigation employed data from the population-based cross-sectional study entitled “Nutritional status, risk behavior and health conditions of older adults in Lafaiete Coutinho – BA” (“Estado nutricional, comportamentos de risco e condico˜es de sau´de dos idosos de Lafaiete Coutinho – BA”). Details about setting, population, and data collection have been previously published10. The study population
DOI:10.5935/MedicalExpress.2014.04.08
comprised all urban residents of Lafaiete Coutinho, in the state of Bahia, Brazil, aged$60 years old (n¼355). Of the
355 subjects in the study population, 316 (89.0%) took part in the research; 17 refusals (4.8%) were registered, and 22 individuals (6.2%) were not located after three household visits (alternate days), and were, thus, considered to be lost from the study.
The study protocol was approved by the research ethics committee of the Universidade Estadual do Sudoeste da Bahia (n8064/10).
Triglycerides and hypertriglyceridemia (dependent variables)
The previously validated11 Accutrendw Plus (Roche Diagnostics, Germany) system verified the triglycerides after a 12-hour fast. Capillary blood samples were collected through a transcutaneous puncture of the medial side of the tip of the middle finger using a disposable hypodermic lancet. Hypercholesterolemia (triglycerides$150 mg/dl) was defined according to the guidelines in effect in Brazil1.
Anthropometric indicators (independent variables)
The anthropometric data were obtained by three under-graduate students who received theoretical and practical training to standardize the anthropometric techniques used in the study. Weight and height were measured with the participant barefoot and wearing the least amount of clothing possible, according to the technique of Frisancho12.
Waist (umbilical scar level), hip, and calf circumferences were measured with an inelastic anthropometric tape measure. Hip and calf circumferences were measured according to the technique of Callaway et al.13. Triceps
skinfold thickness (TSF) was measured with a skinfold caliper (WCS, Brazil), according to Harrison et al.14. All anthropometric measurements, except for body mass, were taken in triplicate, and the average values were used in the analyses. The following anthropometric indicators were calculated: BMI [BMI¼body mass (kg) / height2 (m)],
waist-to-hip ratio (WHR¼waist circumference / hip
circumference), waist-to-height ratio [WHtR¼waist
cir-cumference (cm) / height (cm)], conicity index15, and body
adiposity index (BAI)16.
Adjustment variables
Sociodemographic: age group (60–69, 70–79, or $80 years) and literacy (yes or no).
Lifestyle: alcohol intake ($ once/week/ ,once/week) and physical exercise (insufficiently active / active). The instrument used to assess the level of habitual physical exercise was theInternational Physical Activity Questionnaire, long version17: insufficiently active (fewer than 150 minutes per week of moderate to vigorous physical exercise) and active (150 or more minutes per week of moderate to vigorous physical exercise).
High blood glucose: Accutrendw
Plus was used to dose 12-hour fasting plasma glucose, with procedures as described for triglycerides. High blood glucose (plasma glucose.100 -mg/dl) was defined according to Brazilian guidelines18.
Statistical procedure
Distribution normality was checked using the Kolmo-gorov-Smirnov test. The frequencies, means (or medians), and standard deviations (or interquartile intervals) were calculated. Differences between sexes were compared using
the chi-squared test (qualitative variables) and the Mann-Whitney U test or Student’st-test for independent variables (quantitative variables), Simple linear regression analysis was used to check the relation between anthropometric indicators and triglycerides. The association between anthropometric indicators (independent variables) and hypertriglyceridemia (dependent variable) was tested with the Poisson regression technique. Robust, adjusted models were calculated to estimate the prevalence ratio with their respective 95% confidence intervals (CI 95%).
In all analyses, the level of significance adopted was 5% (a¼0.05). The data were tabulated and analyzed in SPSSw
21.0 (SPSS Inc., Chicago, IL).
B RESULTS
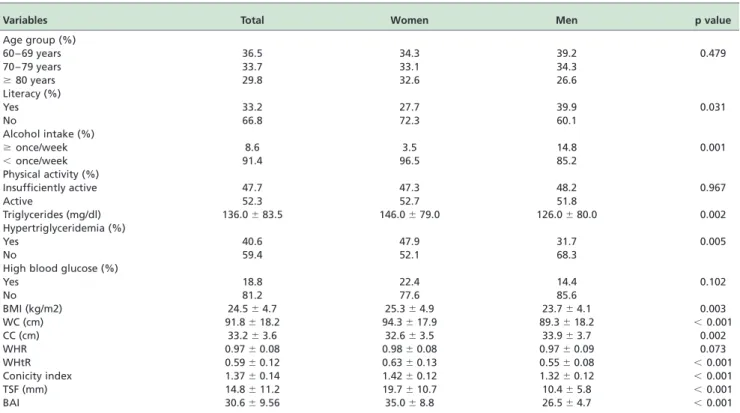
The study population consisted of 173 women (54.7%) and 143 men (45.3%) aged between 60 and 105 (74.2^9.8 years). The mean age was 74.9^10.0 years for women and 73.4^9.4 years for men. Other characteristics of the participants, according to sex, are shown in Table 1. Individuals who stated that they could read and write, consumed alcoholic beverages once per week or more often, and did not have high triglycerides were more commonly men. Women had higher triglycerides levels; anthropometric values were variable, except for calf circumference, which was higher in men, and WHR, which showed no significant difference between the sexes.
According linear regression analyses, only the conicity index was not positively correlated with triglycerides (both sexes). WHR (6.5%) was the indicator that most explained triglyceride variability in women, whereas waist circumfer-ence (5.9%), WHtR (5.6%), and BMI (5.4%) exhibited approximately the same levels of variance. Among the male subjects, triglyceride variability was best accounted for BMI (12.3%), whereas waist circumference (10.8%) and TSF (10.0%) expressed almost the same quantity of variance. The order of correlation of anthropometric indicators and triglycerides was WHR.waist circumference.WHtR. -BMI.calf circumference.BAI.TSF, among the women. Among the men, the order was BMI.waist circumference.TSF.WHtR.calf circumference. -BAI.WHR (Table 2).
Using the Poisson regression analysis (Table 3), we found that among the women, the only indicators associated with hypertriglyceridemia were BMI, calf circumference, and TSF. Among the men, with the exception of WHR and conicity index, all other indicators were associated with hypertrigly-ceridemia. BMI (p,0.001), TSF (p,0.001), and BAI (p,0.001) showed the strongest associations. With each increment of 1 mm of TSF, there was a 2.5% increase in the probability of women having hypertriglyceridemia and a corresponding 9.6% increase in men. The increment of one unit of BMI (1 kg/m2) resulted in increases of 3.2% and 12.4%
in the probability of hypertriglyceridemia in female and male individuals, respectively (Table 3).
B DISCUSSION
In the present study, waist to hip ratio and body mass index are the indicators that express the highest variability percentage of triglycerides among women and men, respectively. This result is consistent with a study conducted with 2179 Iranian individuals (15 to 74 years of age)19. MEDICALEXPRESS 2014 August;1(4):202-205 Anthropometry and hypertriglyceridemia Coqueiro et al.
However, other authors have identified a correlation between triglyceride serum levels and different anthropo-metric indicators in adults and older adults: WHR and waist circumference20, BMI and waist circumference21,22, and BMI, waist circumference, and WHR23 in individuals of both sexes, and WHR and waist circumference in women24.
The results of the present study show that calf circumference in both sexes, and BMI among men were the indicators most strongly associated with hypertriglyceride-mia. TSF was the second indicator most strongly associated with hypertriglyceridemia in both sexes, standing out as a good predictor for the identification of this dyslipidemia. These results are somewhat surprising because, in older adults, calf circumference and TSF are indicators of muscle mass and subcutaneous fat reserves, respectively9. No other
study found that these indicators were associated with hypertriglyceridemia. However, in a 30-year-long study conducted with 1511 men and 691 women (40 to 64 years of age, baseline), TSF was found to be predictive of fatal coronary heart disease in women (RR¼1.63, 95% CI¼1.12
to 2.39)25. Another study24, conducted with 388 women, identified a correlation between triglycerides and the sum of the following five skinfolds: biceps, abdomen, suprailiac, mid-point of the thigh, and mid-point of the calf.
Regarding BMI, a study by Wannamethee et al.26showed that the addition of one standard deviation to BMI increased the probability of hypertriglyceridemia in men by 77%. In Table 1 -Characteristics of participants
Variables Total Women Men p value
Age group (%)
60 – 69 years 36.5 34.3 39.2 0.479
70 – 79 years 33.7 33.1 34.3
$80 years 29.8 32.6 26.6
Literacy (%)
Yes 33.2 27.7 39.9 0.031
No 66.8 72.3 60.1
Alcohol intake (%)
$once/week 8.6 3.5 14.8 0.001
,once/week 91.4 96.5 85.2
Physical activity (%)
Insufficiently active 47.7 47.3 48.2 0.967
Active 52.3 52.7 51.8
Triglycerides (mg/dl) 136.0^83.5 146.0^79.0 126.0^80.0 0.002
Hypertriglyceridemia (%)
Yes 40.6 47.9 31.7 0.005
No 59.4 52.1 68.3
High blood glucose (%)
Yes 18.8 22.4 14.4 0.102
No 81.2 77.6 85.6
BMI (kg/m2) 24.5^4.7 25.3^4.9 23.7^4.1 0.003
WC (cm) 91.8^18.2 94.3^17.9 89.3^18.2 ,0.001
CC (cm) 33.2^3.6 32.6^3.5 33.9^3.7 0.002
WHR 0.97^0.08 0.98^0.08 0.97^0.09 0.073
WHtR 0.59^0.12 0.63^0.13 0.55^0.08 ,0.001
Conicity index 1.37^0.14 1.42^0.12 1.32^0.12 ,0.001
TSF (mm) 14.8^11.2 19.7^10.7 10.4^5.8 ,0.001
BAI 30.6^9.56 35.0^8.8 26.5^4.7 ,0.001
BMI, body mass ı´ndex; WC, waist circumference; CC, calf circumference; WHR, waist-to-hip ratio; WHtR, waist-to-height ratio; TSF, skinfold triceps; BAI, body adiposity index.
The values are expressed in median^interquartile interval or percentage, except for BMI, which is expressed as mean^standard deviation.
Table 2 -Linear regression analysis between anthropometric indicators and triglycerides
Variables Women Men
b R2 p value b R2 p value
BMI 4.441 0.054 0.002 6.913 0.123 ,0.001 WC 1.833 0.059 0.001 1.768 0.108 ,0.001 CC 5.234 0.035 0.009 4.452 0.037 0.013 WHR 427.829 0.065 0.001 109.562 0.029 0.026 WHtR 254.299 0.056 0.001 258.576 0.081 ,0.001 Conicity index 133.232 0.016 0.058 57.884 0.012 0.102 TSF 1.727 0.021 0.036 5.122 0.100 ,0.001 BAI 2.300 0.022 0.033 3.982 0.032 0.021
BMI, body mass ı´ndex; WC, waist circumference; CC, calf circumference; WHR, waist-to-hip ratio; WHtR, waist-to-height ratio; TSF, skinfold triceps; BAI, body adiposity index.
Table 3 -Prevalence ratio for increasing anthropometric indicators according to hypertriglyceridemia
Variables Women Men
PR* CI 95% p-value PR* CI 95% p-value
BMI 1.032 1.002 – 1.063 0.037 1.124 1.071 – 1.179 <0.001 WC 1.013 0.999 – 1.026 0.064 1.024 1.010 – 1.037 0.001 CC 1.052 1.003 – 1.104 0.038 1.124 1.051 – 1.202 0.001 WHR 1.024 0.993 – 1.057 0.129 1.012 0.998 – 1.026 0.087 WHtR 1.015 0.997 – 1.033 0.107 1.037 1.015 – 1.059 0.001 CI 1.756 0.421 – 7.329 0.440 2.265 0.847 – 6.058 0.103 TSF 1.025 1.007 – 1.043 0.006 1.096 1.062 – 1.131 <0.001 BAI 1.012 0.990 – 1.035 0.279 1.085 1.044 – 1.128 <0.001
PR, prevalence ratio; CI95%, confidence interval 95%; BMI, body mass index; WC, waist circumference; CC, calf circumference; WHR, waist-to-hip ratio; WHtR, waist-to-height ratio; CI, conicity index; TSF, skinfold triceps; BAI, body adiposity index.
*Adjusted for age group, literacy, alcohol intake, physical activity and high blood glucose.
Anthropometry and hypertriglyceridemia
Coqueiro et al. MEDICALEXPRESS 2014 August;1(4):202-205
the present study, with each addition of 1 kg/m2unit to BMI, there was a 12.4% increase in the probability of hypertrigly-ceridemia for men, and 3.2% for women. The results for men are comparable to Wannamethee et al.26, because the standard deviation in our study was 4.1 kg/m2, which
means that one standard deviation increase should increase the probability by 51%.
The present study is limited in its cross-sectional delinea-tion, which does not enable us to establish a cause-and-effect relation between anthropometric indicator alterations and serum concentrations of triglycerides and hypertriglyceride-mia. However, this study validates and encourages the use of anthropometric indicators in clinical practice for health professionals who aim to prevent, maintain, or improve monitoring of lipid levels in older adults.
The use of anthropometric indicators for routine assess-ment of the health of older adults could contribute to baseline studies and the monitoring of more specific care, particularly with therapies that include guidelines for physical activity and nutrition. Although WHR and waist circumference are independent predictors for metabolic disorders27, these
indicators, similarly to TSF and calf circumference, do not consider height or changes in body weight. Therefore, we recommend the combined use of these indicators, together with BMI, to improve the predictive capacity of metabolic changes and cardiovascular complications.
B CONCLUSION
The anthropometric indicators that best explain triglycer-ide variability differ according to sex, with waist-to-circumference being the best predictor for women and body mass index for men. Body mass index, calf circumference, and triceps skinfold thickness stand out as the best anthropometric indicators for hypertriglyceridemia in elderly people of both sexes.
B RESUMO
OBJETIVOS: Comparar a relaca˜o entre indicadores antropome´tricos e triglicerı´deos se´ricos e identificar os indicadores mais associados a` hipertrigliceridemia em idosos.
ME´TODOS:Estudo transversal de base populacional realizado com 316 idosos ($ 60 anos), em 2011. Foram verificados os triglicerı´deos (sistema AccutrendwPlus), o ı´ndice de massa corporal, a raza˜o cintura-quadril, a raza˜o
cintura-estatura, o ı´ndice de conicidade, o ı´ndice de adiposidade corporal, a dobra cutaˆnea tricipital e as circunfereˆncias da cintura e da panturrilha.
RESULTADOS: As ana´lises de regressa˜o linear mostraram que a raza˜o cintura-quadril (6,5%), nas mulheres e o ı´ndice de massa corporal (12,3%), nos homens, foram os indicadores que mais explicaram a variabilidade dos triglicerı´deos. A regressa˜o de Poisson mostrou que o ı´ndice de massa corporal, a circunfereˆncia da panturrilha e a dobra cutaˆnea tricipital foram os indicadores associados a hipertrigliceridemia (triglice´rides$150 mg/dl), no sexo feminino. Para os homens, a` exceca˜o da raza˜o cintura-quadril e do ı´ndice de conicidade, os demais indicadores foram associados a` hipertrigliceridemia.
CONCLUSO˜ ES: Os indicadores antropome´tricos que melhor discriminama variabilidade dos triglicerı´deos diferem entre os sexos.Oı´ndice de massa corporal, a circunfereˆncia da panturrilha e a dobra cutaˆnea tricipital se destacam como os melhores indicadores antropome´tricos para hipertriglicer-idemia em idosos de ambos os sexos.
B REFERENCES
1. Departamento de Aterosclerose da Sociedade Brasileira de Cardiologia. IV Diretriz Brasileira Sobre Dislipidemias e Prevenca˜o da Aterosclerose. Arq Bras Cardiol. 2007;88(Suppl 1):S1-19.
2. Andrade FM, Hutz MH. O componente gene´tico da determinaca˜o dos lipı´deos se´ricos. Cieˆnc Sau´de Colet. 2002;7(1):175-82.
3. Neumann AI, Martins IS, Marcopito LF, Arau´jo EA. Padro˜es alimentares associados a fatores de risco para doencas cardiovasculares entre
residentes de um municı´pio brasileiro. Pam Am J Public Health. 2007;22 (5):329-39.
4. Guedes DP, Goncalves LA. Impacto da pra´tica habitual de atividade fı´sica no perfil lipı´dico de adultos. Arq Bras Endocrinol Metab. 2007;51(1):72-8. 5. de Moraes SA, Checchio MV, Freitas IC. Dislipidemia e fatores associados em adultos residentes em Ribeira˜o Preto, SP: resultados do Projeto EPIDCV. Arq Bras Endocrinol Metab. 2013;57(9):691-701.
6. Karaouzene N, Merzouk H, Aribi M, Merzouk AS, Yahia Berrouiguet A, Tessier C, et al., Effects of the association of aging and obesity on lipids, lipoproteins and oxidative stress biomarkers: A comparison of older with young men. Nutr Metab Cardiovas Dis. 2011;21(10):792-9.
7. Mellati AA, Mousavinasab SN, Sokhanvar S, Kazemi SA, Esmailli MH, Dinmohamadi H. Correlation of anthropometric indices with common cardiovascular risk factors in an urban adult population of Iran: data from Zanjan Healthy Heart Study. Asia Pac J Clin Nutr. 2009;18(2):217-25. 8. Lee HH, Lee HJ, Cho JI, Stampfer MJ, Willett WC, Kim CI, et al., Overall
and abdominal adiposity and hypertriglyceridemia among Korean adults: the Korea National Health and Nutrition Examination Survey 2007-2008. Eur J Clin Nutr. 2013;67(1):83-90.
9. Barbosa AR, Coqueiro RS. Anthropometric measurements in adults and elderly: Cuban perspectives. In: Preedy VR, editor. Handbook of Anthropometry: Physical Measures of Human Form in Health and Disease. DOI 10.1007/978-1-4419-1788-1_91,q Springer Scienceþ -Business Media, LLC 2012.
10. Santos KT, Fernandes MH, Reis LA, Coqueiro RS, Rocha SV. Depressive symptoms and motor performance in the elderly: a population based study. Rev Bras Fisioter. 2012;16(4):295-300.
11. Coqueiro RD, Santos MC, Leal Neto JD, Queiroz BM, Bru¨gger NA, Barbosa AR. Validity of a glucose, total cholesterol and triglycerides portable multi analyzer in adults. Biol Res Nurs. 2013; (Jul 19), [Epub ahead of print].
12. Frisancho AR. New standards of weight and body composition by frame size and height for assessment of nutritional status of adults and the elderly. Am J Clin Nutr. 1984;40(4):808-19.
13. Callaway WC, Chumlea WC, Bouchard C, Himes JH, Lohman TG, Martin AD, et al., Circumferences. In: Lohman TG, Roche AF, Martorell R, editors. Anthropometric Standardization Reference Manual. Champaign: Human Kinetics; 1988; p. 39-54.
14. Harrison GG, Buskirk RE, Carter JEL, Johnston FE, Lohman TG, Pollock ML, et al., Skinfold thicknesses. In: Lohman TG, Roche AF, Martorell R, editors. Anthropometric Standardization Reference Manual. Champaign: Human Kinetics; 1988; p. 55-70.
15. Valdez R. A simple model-based index of abdominal adiposity. J Clin Epidemiol. 1991;44(9):955-6.
16. Bergman RN, Stefanovski D, Buchanan TA, Sumner AE, Reynolds JC, Sebring NG, et al., A Better Index of Body Adiposity. Obesity. 2011;19:1083-9.
17. Craig CL, Marshall AL, Sjostrom M, Bauman AE, Booth ML, Ainsworth BE, et al., International Physical Activity Questionnaire: 12-country reliability and validity. Med Sci Sports Exerc. 2003;35(6):1381-95.
18. Sociedade Brasileira de Diabetes. Diretrizes da Sociedade Brasileira de Diabetes 2009. 3 ed. Itapevi: A. Arau´jo Silva Farmaceˆutica; 2009(Acessed June15, 2013, http://www.diabetes.org.br/attachments/diretrizes09_ final.pdf).
19. Gharakhanlou R, Farzad B, Agha-Alinejad H, Steffen LM, Bayati M. Anthropometric measures as predictors of cardiovascular disease risk factors in the urban population of Iran. Arq Bras Cardiol. 2012;98(2):126-35. 20. Paula HA, Ribeiro R De C, Rosado LE, Abranches MV, Franceschini S do
C. Classic anthropometric and body composition indicators can predict risk of metabolic syndrome in the elderly. Ann Nutr Metab. 2012;60 (4):264-71.
21. Lichtash CT, Cui J, Guo X, Chen Y-DI, Hsueh WA, Rotter JI, et al., Body adiposity index versus body mass index and other anthropometric traits as correlates of cardiometabolic risk factors. PLoS ONE. 2013;8(6): e65954.
22. Rezende FA, Rosado LE, Ribeiro R de C, Vidigal F de C, Vasques AC, Bonard IS, et al., Body mass index and waist circumference: association with cardiovascular risk factors. Arq Bras Cardiol. 2006;87(6):728-34. 23. He YH, Chen YC, Juang GX, Huang HE, Li R, Li XY, et al., Evaluation on
anthropometric indices for metabolic syndrome in chinese adults aged 40 years and over. Eur J Nutr. 2012;51(1):81-7.
24. Krause MP, Hallage T, Gama MP, Sasaki JE, Miculin CP, Buzzachera CF, et al., Association between lipid profile and adiposity in women over age 60. Arq Bras Cardiol. 2007;89(3):163-9.
25. Kim J, Meade T, Haines A. Skinfold thickness, body mass index, and fatal coronary heart disease: 30 year follow up of the Northwick Park heart study. J Epidemiol Community Health. 2006;60(3):275-9.
26. Wannamethee SG, Shaper AG, Morris RW, Whincup PH. Measures of adiposity in the identification of metabolic abnormalities in elderly men. Am J Clin Nutr. 2005;81(6):1313-21.
27. Arsenault BJ, Lemueux I, Despre´s JP, Wareham MJ, Kastelein JJ, Khaw KT, et al., The hypertriglyceridemic-waist phenotype and the risk of coronary artery disease: results from the EPIC-Norfolk Prospective Population Study. CMAJ. 2010;182(13):1427-32.
MEDICALEXPRESS 2014 August;1(4):202-205 Anthropometry and hypertriglyceridemia Coqueiro et al.