www.biogeosciences.net/9/1465/2012/ doi:10.5194/bg-9-1465-2012
© Author(s) 2012. CC Attribution 3.0 License.
Biogeosciences
Increasing iron concentrations in surface waters – a factor
behind brownification?
E. S. Kritzberg and S. M. Ekstr¨om
Department of Biology/Aquatic Ecology, Lund University, S¨olvegatan 37, 223 62 Lund, Sweden
Correspondence to:E. S. Kritzberg ([email protected])
Received: 30 November 2011 – Published in Biogeosciences Discuss.: 21 December 2011 Revised: 13 March 2012 – Accepted: 25 March 2012 – Published: 20 April 2012
Abstract. Browning of inland waters has been noted over
large parts of the Northern hemisphere and is a phenomenon with both ecological and societal consequences. The increase in water color is generally ascribed to increasing concentra-tions of dissolved organic matter of terrestrial origin. How-ever, oftentimes the increase in water color is larger than that of organic matter, implying that changes in the concentration of organic matter alone cannot explain the enhanced water color. Water color is known to be affected also by the quality of organic matter and the prevalence of iron. Here we in-vestigated trends in water color, organic matter and iron be-tween 1972 and 2010 in 30 rivers draining into the Swedish coast (data from the national Swedish monitoring program), and performed a laboratory iron addition experiment to nat-ural waters, to evaluate the role of iron and organic matter in determining water color. By comparing the effect of iron ad-ditions on water color in the experiment, to variation in water color and iron concentration in the monitoring data, we show that iron can explain a significant share of the variation in water color (on average 25 %), especially in the rivers in the north of Sweden (up to 74 %). Furthermore, positive trends for iron are seen in 27 of 30 rivers (21–468 %) and the in-crease in iron is larger than that of organic matter, indicating that iron and organic matter concentrations are controlled by similar but not identical processes. We speculate that increas-ing iron concentrations can be caused by changes in redox conditions, that mean that more anoxic water with high con-centrations of soluble FeII are feeding into the surface wa-ters. More studies are needed about why iron is increasing so strongly, since both causes and consequences are partly different from those of increasing organic matter content.
1 Introduction
It is frequently reported that water color is increasing strongly in many lakes and running waters of the Northern hemisphere (Driscoll et al., 2003; Frey and Smith, 2005; Monteith et al., 2007; Erlandsson et al., 2008; Haaland et al., 2010). This is a phenomenon with far reaching ecolog-ical and societal consequences as it is bound to affect the structure and function of the aquatic ecosystem, e.g. through the impaired light climate, and reduce the recreational value and potential to use the water as a drinking water resource (Chow et al., 2007). The drivers behind this trend, sometimes referred to as brownification, are heavily debated and have been ascribed to hydrological factors (Hongve et al., 2004; Erlandsson et al., 2008) as well as an increase in temperature, changes in land-use and reduced acid deposition (Correll et al., 2001; Freeman et al., 2001; Monteith et al., 2007). Al-though it has been difficult to tease out a single factor causing brownification, there is an implicit consensus that thedirect
factor causing brownification is increased concentrations of terrestrially derived organic matter (OM) in the water. This is reasonable, as dissolved OM correlate well with water color (Pace and Cole, 2002; von Einem and Graneli, 2010) and is considered responsible for most of the light absorption in natural waters. Many studies report a concurrent increase in OM content along with the increase in water color, however, water color has often increased significantly more than OM (Hongve et al., 2004; Erlandsson et al., 2008). This suggests that the increase in OM content alone does not suffice to ex-plain the increase in water color.
2005). Unfortunately, measures of OM quality are rarely in-cluded in environmental monitoring or experiments address-ing brownification (but see Freeman et al., 2001; Ekstr¨om et al., 2011). By contrast, there is a wealth of studies report-ing correlations between Fe and water color (Canfield et al., 1984; Pennanen and Frisk, 1984; Heikkinen and Ihme, 1995; Maloney et al., 2005). Although it is well known that water color is caused by both OM and Fe, few estimates of the in-terference of Fe with color have been presented (Pennanen and Frisk, 1984) and to our knowledge the potential role of Fe to brownification has not been studied.
In this study we address the causes behind brownification across the latitudinal and climatic gradient of Sweden. More specifically, we evaluate the different roles of OM quantity, OM quality and Fe for water color in 30 rivers during a pe-riod of 38 years. The statistical analysis of this large dataset from the national Swedish monitoring program is comple-mented with a laboratory experiment to assess the effect on water color in response to Fe. The main aim is to understand the role of Fe to brownification, as this is imperative for a better understanding of the underlying drivers, but also be-cause increasing concentrations of Fe may have partly differ-ent consequences to the aquatic system than increasing con-centrations of organic matter.
2 Material and methods
2.1 Analyses of monitoring data
Data from rivers in the Swedish national monitoring program (run by the Swedish University of Agricultural Sciences) was used. The data is freely available at http://webstar.vatten.slu. se/db.html. Rivers with long and continuous time series, or with only minor gaps, of water color, COD, TOC, Fe, and Mn were selected. Rivers that we know to be heavily affected by industrial activities, such as pulp mills, were excluded. This resulted in a dataset with 30 rivers with monthly sam-ples 1972–2010 (Table 1). For one river data was available only from 1976 and five rivers had Fe and Mn data only from 1976 and onwards. Data on TOC was available only from 1987 and onwards. Because data on a few variables were in-complete for 2010, data from 2009 were selected for some inter-comparisons between rivers. Data on export loading, i.e. accounting for the export to the coastal waters by consid-ering both concentrations and water discharge, was available until 2008.
The 30 rivers are located throughout Sweden, between lat-itude N 54–69◦ and longitude E 10–24◦and encompasses a gradient regarding both climate and vegetation type (Fig. 1). Most of Sweden has a climate dominated by high humidity, cool summers and cold winters with snow (Dfc, according to the K¨oppen-Geiger climate classification), and ranges from dry, polar climate in the north (ET) to warm temperate, hu-mid climate, with warm summers in the south (Cfb; Kottek et
AC
Y
X
C
AB
D
E
H
K M N
O
Bothnian Bay
Bothnian Sea
Baltic Proper
The Sound Kattegatt Skagerrak
4 5 6
7 8 9 10
11 12 13
14
15
16
17 18
19
20 21
22 23 24 25
26 27
28 29 30
1 3 2 BD
Fig. 1.Map of Sweden with the rivers denoted by numbers. Letters denote counties.
al., 2006). Most catchments are dominated by boreal vegeta-tion but the vegetavegeta-tion type ranges from alpine in the north, to nemoral in the south. The drainage areas vary in size from 300 to 34 400 km2, with a mean of 10 400 km2and drain into the Bothnian Bay, Bothnian Sea, Baltic proper, Kattegat and Skagerrak (Fig. 1).
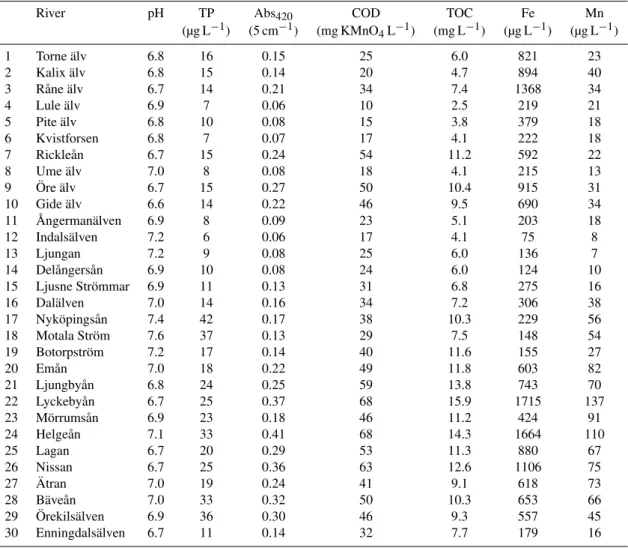
Table 1.Median values of pH, TP, Abs420, COD, TOC, Fe and Mn in the 30 Swedish rivers between 1987 and 2010.
River pH TP Abs420 COD TOC Fe Mn
(µg L−1) (5 cm−1) (mg KMnO4L−1) (mg L−1) (µg L−1) (µg L−1)
1 Torne ¨alv 6.8 16 0.15 25 6.0 821 23
2 Kalix ¨alv 6.8 15 0.14 20 4.7 894 40
3 R˚ane ¨alv 6.7 14 0.21 34 7.4 1368 34
4 Lule ¨alv 6.9 7 0.06 10 2.5 219 21
5 Pite ¨alv 6.8 10 0.08 15 3.8 379 18
6 Kvistforsen 6.8 7 0.07 17 4.1 222 18
7 Rickle˚an 6.7 15 0.24 54 11.2 592 22
8 Ume ¨alv 7.0 8 0.08 18 4.1 215 13
9 Ore ¨alv¨ 6.7 15 0.27 50 10.4 915 31
10 Gide ¨alv 6.6 14 0.22 46 9.5 690 34
11 Angerman¨alven˚ 6.9 8 0.09 23 5.1 203 18
12 Indals¨alven 7.2 6 0.06 17 4.1 75 8
13 Ljungan 7.2 9 0.08 25 6.0 136 7
14 Del˚angers˚an 6.9 10 0.08 24 6.0 124 10
15 Ljusne Str¨ommar 6.9 11 0.13 31 6.8 275 16
16 Dal¨alven 7.0 14 0.16 34 7.2 306 38
17 Nyk¨opings˚an 7.4 42 0.17 38 10.3 229 56
18 Motala Str¨om 7.6 37 0.13 29 7.5 148 54
19 Botorpstr¨om 7.2 17 0.14 40 11.6 155 27
20 Em˚an 7.0 18 0.22 49 11.8 603 82
21 Ljungby˚an 6.8 24 0.25 59 13.8 743 70
22 Lyckeby˚an 6.7 25 0.37 68 15.9 1715 137
23 M¨orrums˚an 6.9 23 0.18 46 11.2 424 91
24 Helge˚an 7.1 33 0.41 68 14.3 1664 110
25 Lagan 6.7 20 0.29 53 11.3 880 67
26 Nissan 6.7 25 0.36 63 12.6 1106 75
27 Atran¨ 7.0 19 0.24 41 9.1 618 73
28 B¨ave˚an 7.0 33 0.32 50 10.3 653 66
29 Orekils¨alven¨ 6.9 36 0.30 46 9.3 557 45
30 Enningdals¨alven 6.7 11 0.14 32 7.7 179 16
determined as absorbance of unfiltered water at 420 nm in a 5 cm cuvette (Abs420; 5 cm−1). Organic matter content was
measured by two methods, COD and TOC. COD was as-sessed as consumption of KMnO4in unfiltered water (COD;
mg KMnO4L−1). TOC was measured on unfiltered water
by oxidative combustion on a Shimadzu total carbon ana-lyzer. Fe and Mn concentrations were determined on un-filtered samples preserved with 0.5 % HNO3by AAS until
1993 and ICP-MS or ICP-AES from 1994 and onwards. 28 of the 30 rivers exhibited 1–4 abrupt changes in Fe concen-trations, however, only 3 of these coincided with the change in analytical methods. Thus, we believe that the shift in the analytical method did not affect the temporal trends for Fe found in this study.
2.2 Experimental Fe addition
To test how much of absorbance at 420 nm can be attributed to the presence of Fe, additions of FeCl3were made to
wa-ter from Motala Str¨om, Lagan and Lake Holmeshulta from
the catchment of M¨orrums˚an and Lake Lindhultsg¨olen from the catchment of Lagan. These waters were chosen to re-flect the range of pH, TOC and Fe concentrations in the monitoring dataset (Tables 1 and 3). Before the addition of FeCl3, the water was GF/B-filtered (nominal pore size
2.7 µm) to remove large particles. Water was transferred to 100-ml plankton bottles in brown glass and amended with FeIII using a 0.03 M FeCl3solution in 0.001 M HCl.
Table 2.Percent change in discharge of total organic matter, mea-sured as COD, and Fe in river mouths of the respective counties (shown in Fig. 1) into the different sub-basins between 1972 and 2008. Numbers within brackets show the yearly rate of change in percent.
County Sub-basin COD (%) Fe (%)
BD Bothnian Bay 30 (0.8) 73 (2.0)
AC –II– 43 (1.2) 68 (1.9)
AC Bothnian Sea n.s. n.s.
Y –II– n.s. n.s.
X –II– n.s. n.s.
C Baltic Proper n.s. n.s.
AB –II– n.s. n.s.
D –II– n.s. 116 (3.2)
E –II– n.s. 101 (2.8)
H –II– 86 (2.4) 185 (5.1)
I –II– n.s. n.s.
K –II– 182 (5.1) 403 (11.2)
M –II– 206 (5.7) 426 (11.8)
M The Sound n.s. 388 (10.8)
M Kattegat 54 (1.5) 173 (4.8)
N –II– 2 (0.1) 247 (6.9)
O –II– n.s. n.s.
O Skagerrak 113 (3.1) 108 (3.0)
Sweden total 32 (0.9) 69 (1.9)
“n.s.” means no significant trends were found.
before FeCl3 addition was measured using a non-purgable
organic carbon method on a Shimadzu TOC-VCHP analyzer. Fe before FeCl3addition was determined with an ICP-AES
Optima 3000 DV (PerkinElmer), while a Hanna HI 991300 was used for the pH measurements.
2.3 Statistical treatment
To detect long-term trends, non-parametric Mann-Kendall tests for trends in time series were used. To estimate the magnitude of a trend that was significant by Mann-Kendall, we used the slope of a linear regression line of yearly mean values over time. Comparison of the relative magnitude of change between different variables was tested by paired t-test. Paired t-test was also used to examine differences in export of organic matter and Fe.
Co-variation between variables among rivers was tested by Pearson correlations of yearly mean values. Relationships between variables within rivers were tested by linear regres-sions including data from all sampling dates unless other-wise stated. Variation in water color within rivers was sig-nificantly related to both the concentration of organic matter and the Fe concentration in the water. To assess if the rela-tionships were independent of each other, we tested if Fe ex-plained any of the variation in the residuals of the water color – organic matter relationship, i.e. controlling for the variation in water color due to organic matter, and vice versa.
The effect of experimental Fe additions on Abs420was
ex-amined by linear regression and differences in the magnitude of the response in different water was examined by analysis of covariance (ANCOVA).
Mann-Kendall tests were performed using an Excel macro, MULTMK/PARTMK, developed by Anders Grimvall and Claudia Libiseller, Link¨oping University, Sweden, in col-laboration with the Swedish University of Agricultural Sci-ences. The software Change-Point Analyzer (version 2.3, Taylor Enterprises, Inc., http://www.variation.com), which has been shown to successfully detect abrupt changes in time series (Temnerud and Weyhenmeyer, 2008) was used on yearly mean Fe concentrations for each river to detect abrupt changes caused by the change in analytical methods for Fe. All other statistical tests were performed in PASW Statistics 18.
3 Results
3.1 Water color and concentrations of organic matter
and Fe
TP, Abs420, COD, TOC, Fe and Mn vary considerably among
the rivers (Table 1), while the median pH vary within a rather narrow range of one pH unit close to neutral (6.6–7.6). Phos-phorus concentrations are generally higher in the more south-ern rivers. Strongly colored waters (Abs4205 cm−1>0.20)
occur throughout the north-south gradient, but weakly col-ored (Abs4205 cm−1<0.10) waters occur only in the more
northern rivers. Water color, COD, TOC, Fe and Mn are all inter-correlated among the rivers, e.g. Pearson correlations between yearly means of all variables from 2009 generate r-values in between 0.52 and 0.97. However, the relationships are generally not 1:1 and the ratios between the different vari-ables, e.g. Abs420/COD and Fe/COD, vary among rivers.
pH increased significantly in 14 rivers during the period re-flecting the reduction in sulfur deposition during the period. This increase in pH was especially seen in the southern rivers and was significant in all rivers from River 20 and south-wards. Moreover, TP decreased significantly in 23 rivers by on average 36 % (5–74 %) corresponding to 7 (1–18) µg L−1.
This decrease reflects improved sewage water treatment and was seen throughout the north-south gradient and the relative change (%) was similar in the northern and southern rivers.
0 2 4 6 8 10 12 1 2 3 4 5 6 7 8 9 10 11 12 13 14 15 16 17 18 19 20 21 22 23 24 25 26 27 28 29 30
0 2 4 6 8 10 12
1 2 3 4 5 6 7 8 9 10 11 12 13 14 15 16 17 18 19 20 21 22 23 24 25 26 27 28 29 30
0 2 4 6 8 10 12
1 2 3 4 5 6 7 8 9 10 11 12 13 14 15 16 17 18 19 20 21 22 23 24 25 26 27 28 29 30
0 2 4 6 8 10 12
1 2 3 4 5 6 7 8 9 10 11 12 13 14 15 16 17 18 19 20 21 22 23 24 25 26 27 28 29 30 Rivers
Change in Abs 420 yr
-1
(%) Change in COD yr-1 (%) Change in TOC yr-1 (%) Change in Fe yr-1 (%)
A
B
C
D
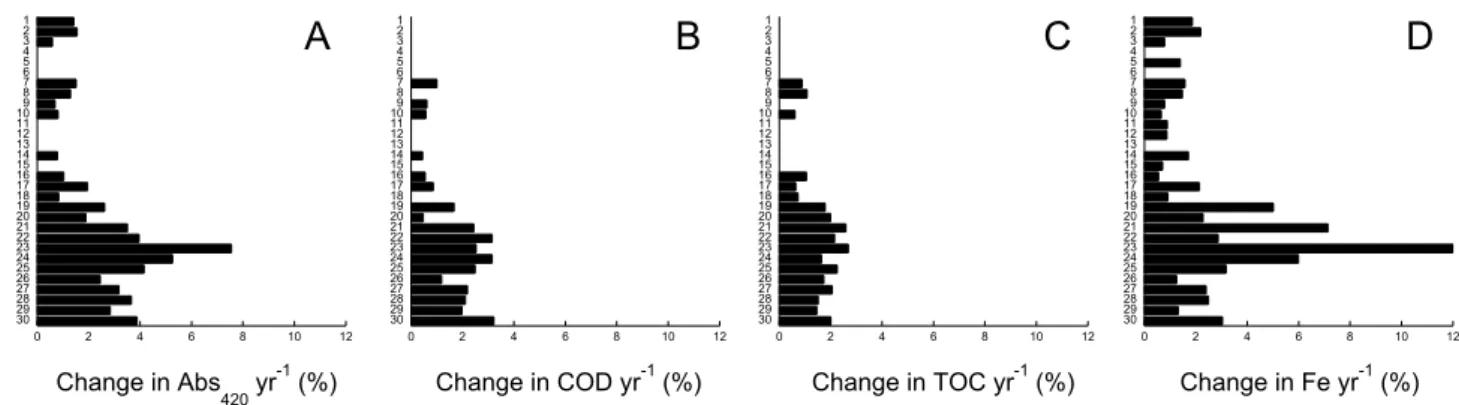
Fig. 2.The rate of change per year of Abs420, COD, TOC and Fe. For Abs420, COD and Fe it is the change between 1972 and 2010. For TOC it is the change between 1987 and 2010. Where there are no bars there is no significant change over time.
pronounced in rivers with higher median values of water color (r2=0.30,p=0.001), COD (r2=0.44,p=0.001), TOC (r2=0.33,p=0.001), Fe (r2=0.16,p=0.028) and Mn (r2=0.49, p=0.000). However, these relationships have rather low explanatory power (r2-values above). Thus overall, an increase in water color is seen in rivers from north to south and in weakly as well as strongly colored rivers.
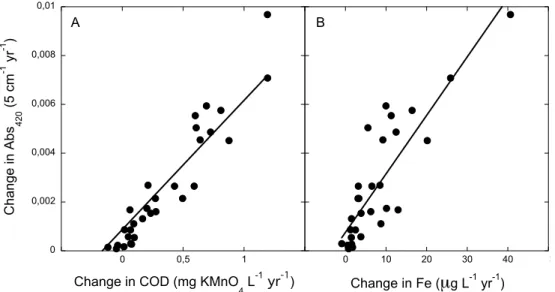
Observations of increasing water color correspond well to changes in both COD (r2=0.90,p=0.000), and Fe (r2= 0.75,p=0.000) across all rivers (Fig. 4), while there was no relationship with changes in Mn (r2=0.026,p=0.89). Mn is therefore not considered in the following analysis. COD has increased in 18 of the 30 rivers by 0.5–3.2 % per year, corresponding to an increase of 17–122 % over the whole period (Figs. 2b and 3d–f). In five rivers water color has in-creased while COD exhibit no significant trend. Since 1987, 20 rivers exhibit increasing water color (data not shown) and 19 an increase in TOC (Figs. 2c and 3g–i).
Water color increased more than COD across all rivers (paired t-test; t=5.93, p=0.000) and Abs420/COD
in-creased significantly in 26 rivers by on average 0.6 (0.2– 2.0) % per year (see Figs. 5a and 6a–c). Similarly, water color increased more than TOC (t=4.81, p=0.000) and Abs420/TOC increased in 12 rivers by on average 0.8 % (0.5–
1.1 %). This implies that the increase in organic matter con-tent alone does not suffice to explain the increase in water color. The increase in water color may be partly related to changes in organic matter quality. COD and TOC are both used as measures of organic matter content, but COD reflects both quantity and quality of organic matter (see Discussion). COD increased more than TOC (t=4.67,p=0.000) among rivers and COD/TOC changed significantly in 8 rivers by on average 0.5 % (–0.1–0.9 %) per year (Figs. 5b and 6d–f). The latter reflects a change in organic matter quality over time.
Fe has increased significantly in 27 rivers (Fig. 2d) and three examples of Fe over time are shown in Fig. 3j–l.The increase varies from 0.5 to 12.3 % per year, corresponding to 21 to 468 % over the whole period. In all rivers where water color show an increasing trend there is a concurrent increase
in Fe, while in four rivers Fe has increased (on average 37 % over the whole period) without a significant increase in water color.
There are positive relationships between water color and COD (r2=0.504±0.178,p <0.001), water color and TOC (r2=0.180±0.122, p <0.001), and water color and Fe (r2=0.457±0.193, p <0.001) in all rivers. Since Fe is associated to organic matter, the relationship between water color and Fe could potentially be dependent on the relation-ship between water color and organic matter, or vice versa. However, the relationships between water color and organic matter and water color and Fe appear to be independent. The relationship between water color and COD is signifi-cant also when controlling for the concentration of Fe in the water (p <0.001) and the relationship between water color and TOC is significant when controlling for the variation in Fe in the water (p <0.05) for all rivers but five. Similarly, the relationships between water color and Fe are significant also when controlling for the variation in COD for all rivers (p <0.001) and when controlling for the variation in TOC (p <0.001).
0 0,1 0,2 0,3 0,4 0,5 0,6 0,7 0,8
0 5 10 15 20 25
0 5 10 15 20
0 500 1000 1500 2000 2500
1970 1975 1980 1985 1990 1995 2000 2005 1975 1980 1985 1990 1995 2000 2005 1975 1980 1985 1990 1995 2000 2005 2010
Abs
420
(cm
-5 )
River Kalixälven River Ljungan River Helgaån
COD (mg L
-1 )
TOC (mg L
-1 )
Fe (
μ
g
L
-1 )
Time (year)
A B C
D E F
G H I
J K L
0 0,002 0,004 0,006 0,008 0,01
-0,5 0 0,5 1 1,5
Change in COD (mg KMnO 4 L
-1
yr-1) Change in Fe (
μ
g L-1 yr-1)Change in Abs
420
(5 cm
-1 yr -1 )
A B
-10 0 10 20 30 40 50
Fig. 4. Changes in Abs420correspond to changes in COD (Abs420 = 0.0064×COD + 0.0004,r2=0.90,p <0.001, panel A) and Fe (Abs420= 0.0002×Fe + 0.0008,r2=0.75,p <0.001, panel B). Each point represents a single river.
0 0,5 1 1,5 2
1 2 3 4 5 6 7 8 9 10 11 12 13 14 15 16 17 18 19 20 21 22 23 24 25 26 27 28 29 30
-0,5 0 0,5 1 1,5 1
2 3 4 5 6 7 8 9 10 11 12 13 14 15 16 17 18 19 20 21 22 23 24 25 26 27 28 29 30
0 1 2 3 4
1 2 3 4 5 6 7 8 9 10 11 12 13 14 15 16 17 18 19 20 21 22 23 24 25 26 27 28 29 30
River
Change in Abs
420/COD yr
-1
(%) Change in COD/TOC yr-1 (%) Change in Fe/COD yr-1 (%)
A
B
C
Fig. 5.The rate of change per year of Abs420/COD, COD/TOC and Fe/COD in all the rivers. For Abs420/COD and Fe/COD it is the change between 1972 and 2010. For COD/TOC it is the change between 1987 and 2010. Where there are no bars there is no significant change over time.
3.2 Export of Fe and organic matter
That concentrations of Fe have increased more than the con-centration of organic matter in the water is also reflected by the relatively larger increase in the export of Fe to coastal ar-eas compared to that of OM (Table 2). The export of Fe has increased significantly between 1972 and 2008 in the areas that drain into the Bothnian Bay, the Baltic proper, Kattegat and Skagerrak, but not in the area draining into the Bothnian Sea. The export of organic matter as measured by COD ex-hibit a similar pattern, but the increase is smaller (t=4.07, p <0.01) and nonexistent in three areas where there has been a significant increase in Fe (Table 2).
3.3 Experimental Fe addition
Experimental additions of Fe resulted in a linear response in Abs420in all four waters (Fig. 7a, Table 3). The magnitude of
the response differed, i.e. there was a significant interaction between the two factors (F =14.38,p=0.000). Abs420
in-creased between 0.0075 and 0.0090 cm−1per mg Fe added,
0 0,002 0,004 0,006 0,008 0,01
0 0,2 0,4 0,6 0,8 1 1,2
0 50 100 150 200 250
1970 1975 1980 1985 1990 1995 2000 2005 1975 1980 1985 1990 1995 2000 2005 1975 1980 1985 1990 1995 2000 2005 2010
River Kalix River Ljungan River Helgaån
Time (year)
Abs
420
/COD
COD/TOC
Fe/COD
A B C
D E F
G H I
Fig. 6.Trends in Abs420/COD, COD/TOC and Fe/COD in rivers in northern (Kalix˚an), central (Ljungan) and southern Sweden (Helga˚an). Trend lines are shown when there are significant increases over time.
The theoretical contribution of Fe to variation in water color in the rivers was estimated by comparing the slope of the Abs420 – Fe relationship in the rivers to that of the
experimental Fe addition. The variation in water color be-tween years that could theoretically be explained by Fe var-ied from 6 to 74 %, based on annual means of Abs420and Fe
(Fig. 7b). When including all Abs420and Fe data from each
river, i.e. accounting also for the seasonal variation, Fe ex-plained 9–75 % of the variation in water color. Although the slopes of the relationships differed significantly when doing
the Fe addition to the four different waters, the estimated con-tribution of Fe to water color in the rivers was not strongly affected by the choice of slope. Comparing the fraction of water color that could be explained by Fe using the theo-retical 0.0075 and 0.0090 slope, the mean difference was 4 percent units.
4 Discussion
0 20 40 60 80 100
1 2 3 4 5 6 7 8 9 10 11 12 13 14 15 16 17 18 19 20 21 22 23 24 25 26 27 28 29 30
0 0,05 0,1 0,15
0 1 2 3 4
Fe added (mg L
-1)
% of interannual Abs
420
variation explained by Fe
Abs
420
(cm
-1
)
A
B
Fig. 7. The theoretical contribution of Fe to Abs420. Panel A shows the effect of Fe additions on water color as measured by Abs420in water from Lake Lindhultsg¨ol (N), River Lagan (), Lake Holmeshultasj¨on () and River Motala Str¨om (•) respectively. All regressions are significant (p <0.001). The slope andr2of the regression equations and water chemistry of the different waters are shown in Table 3. Panel B shows how much of the inter-annual variation in Abs420that could theoretically be explained by variation in Fe for each river. This fraction is calculated by comparing the slope of the Abs420– Fe relationship in each river to that of the experimental Fe addition (the mean of the four slopes derived from the experiment, 0.0083 cm−1mg Fe−1).
Table 3.Chemistry of the waters used for the Fe addition experiment and the regression equation withr2-values for the increase in absorbance in response to Fe addition for the respective waters (visualized in Fig. 7).
Origin pH DOC Fe Abs420 Regression slope r2
of water (mg L−1) (µg L−1) (cm−1) (cm−1mg Fe−1)
Lake V¨attern 7.0 2.9 34 0.006 0.0075 0.98
Lake Holmeshulta 6.7 8.0 143 0.017 0.0080 0.99
River Lagan 6.7 10.5 631 0.037 0.0084 0.99
Lake Lindhultsg¨ol 6.6 17.2 625 0.109 0.0090 0.99
1972 to 2010, is in line with previous reports of increasing water color and OM concentrations in freshwaters in Europe, Siberia and North America (Driscoll et al., 2003; Frey and Smith, 2005; Monteith et al., 2007; Erlandsson et al., 2008). This brownification is believed to have fundamental ecolog-ical implications as well as societal consequences. The anal-ysis of the current dataset also shows that the increase in wa-ter color is too large to be explained by the increase in OM alone. Thus, in addition to increasing concentrations of OM there must be a change in the quality of the OM or an ad-ditional factor that contributes to the increase in water color, and it appears that Fe could play that role in many of these rivers. To fully understand both the causes and consequences of brownification it is necessary to know the direct factor be-hind it.
4.1 The role of organic matter to water color
A current paradigm suggests that dissolved OM is re-sponsible for most of the light absorption in freshwaters (Williamson et al., 1999) and across the rivers of the cur-rent dataset, increases in water color correspond well with changes in OM concentrations (COD and TOC). However, in five rivers water color increased without a concurrent change in COD. Moreover, the relative increase in water color was larger than that of the COD across the whole dataset, and Abs420/COD increased over time in 27 rivers. This
deposition, and changes in land-use – should all bring a con-current change in OM quality. Unfortunately changes in OM quality are rarely addressed in studies of brownification. The change in Abs420/COD and Abs420/TOC over time seen in
most of the rivers means that more light is absorbed for each unit of OM. The carbon specific absorbance (Abs420/TOC)
can vary depending on the molecular structure of the organic matter. For example, when comparing DOM in soil water from plots exposed to high versus low acid irrigation, the former had lower carbon specific absorbance, corresponding to lower molecular weight and aromaticity (Ekstr¨om et al., 2011). Thus, coupled with an increase in DOM in soil water as a result of lower acidification, there was a change in DOM quality. While the larger increase in water color than in OM content in the Swedish rivers may reflect a change towards larger and more aromatic OM, it cannot be excluded that it is due to a color related factor other than OM quantity and quality. On the other hand, the change in COD/TOC seen in eight rivers is clear evidence of a change in OM quality – for each unit of carbon more permanganate is consumed. The relationship between COD and TOC is not fixed and depend on the number of oxygen atoms per carbon atom required to oxidize different organic molecules, i.e. on OM quality. Moreover, the chemical oxidation of OM by permanganate is incomplete and oxidizes approximately 40 % of the total OM (Wilander, 1988). Thus, the increase in COD/TOC over time reflects a change in OM quality, either that a greater share of the OM is susceptible to chemical oxidation or that the OM present in the water is less oxidized. However, though there are logical reasons and strong indications that there have been changes in OM quality in many of these rivers, the data does not allow for any quantitative conclusions on how this contributes to brownification.
There is a general trend that phosphorus concentrations in the rivers are decreasing as an effect of improved sewage treatment. A reduction in available phosphorus may reduce the autochthonous production of DOM in the systems. How-ever, in systems like these, that are not highly eutrophic or with low terrestrial inputs, the lions’ share of the DOM pool should be terrestrially derived (Bade et al., 2007). More-over, autochthonous DOM is generally low in color. Thus, we believe such a decline in autochthonous production would have minor effects on water color and DOM concentrations in these systems.
4.2 The role of Fe to water color
To the extent that the increase in water color cannot be ex-plained by changes in the quantity and quality of OM, Fe is a potential source of color. Fe is known to contribute to light absorbance and water color in freshwaters and Fe and water color are often correlated across lakes (Canfield et al., 1984) as they are across the rivers in the current dataset. Some studies indicate that complexes between Fe and OM affect water color more than OM alone (Pennanen and Frisk, 1984;
Heikkinen, 1994; Maloney et al., 2005). Recently, increasing Fe concentrations have been reported for UK upland waters (Neal et al., 2008) and a general increase in stream water Fe concentrations was noted in a dataset with 62 Swedish rivers 1996–2009 (Huser et al., 2011). For the current dataset, Fe increased significantly in 27 out of 30 rivers. On average Fe has doubled over the 38-year period, but there is a large vari-ation with increases between 21 and 468 %. For all the rivers that exhibit an increase in water color there is a concurrent increase in Fe and there is a strong relationship between wa-ter color and Fe within rivers, also when controlling for OM. The role of Fe and dissolved OM to changes in light ab-sorbance in the UV range in a humic lake was explored by Maloney et al. (2005), both by artificial Fe additions and by oxygenating hypolimnic water with high content of FeII, which then oxidized to FeIII and probably formed complex with DOM. Fe was found to be the more important factor controlling changes in UV absorbance and the results fur-ther suggest that Fe should be important also in controlling absorbance in the visual spectra, i.e. water color. Our exper-iments confirm that water color (Abs420)was enhanced by
additions of FeCl3. Furthermore, by relating the slope of the
relationship between water color and Fe derived from the ex-periment to that of the variations in water color and Fe within the rivers, we can see that a considerable share of the inter-annual variation in water color can theoretically be accounted for by iron. On average 25 % of inter-annual variation could be theoretically explained by Fe and it seems to be a more important factor in the north (up to 74 %) than in the south (down to 6 %).
Upon addition of Fe the response in water color in the ex-perimental waters was significantly higher with higher TOC concentration (0.0075–0.0090 cm−1mg Fe−1). The
differ-ence may be due to the differdiffer-ences in OM quality between the waters. While the experimental waters were only ana-lyzed for Abs420, TOC and Fe concentrations, monitoring
data verifies that water from the four water bodies sampled differ in Abs420/TOC and COD/TOC, indicating differences
in OM quality. It has been demonstrated that visible ab-sorbance increases more for OM extracted with XAD-8 iso-lates (hydrophobic acids, relatively larger MW) than with XAD-4 (hydrophilic acids, relatively smaller MW; Aiken et al., 1992) with the same concentration of Fe (Pullin et al., 2007). In the XAD-8 extracts, but not the XAD-4 extracts, there was a small shift towards higher molecular weight after the addition of Fe, probably reflecting bridging of organic molecules. Thus, molecular weight and absorbance of OM from different waters may be affected differently by the pres-ence of Fe due to differpres-ences in chemical structure.
With the aim to improve the conversion of Abs420to TOC
Pennanen and Frisk (1984) estimated the role of Fe on wa-ter color by statistical modeling including Abs420, TOC and
be calculated by the conversion factor 0.025 cm−1mg Fe−1,
i.e. a factor 2.7–3.3 times higher than those derived from our experimental Fe additions. While the addition experi-ment isolates the effect of Fe, the modeled conversion fac-tor may also be affected by facfac-tors apart from Fe but con-tributing to absorbance, such as OM quality. Repeating the modeling exercise by Pennanen and Frisk (1984) with river data from 2009 yield a factor 0.005–0.022 (mean 0.013) cm−1mg Fe−1, depending on which month we select for the model. It is possible that we arrive at lower values than Pen-nanen and Frisk (1984) because the latter used the colloidal fraction of the samples to derive their relationship, whereas we use the entire OM. If we apply the factor derived by Pen-nanen and Frisk instead of the ones derived from the Fe addi-tion experiment, on average 61 % of inter-annual variaaddi-tion in water color could be theoretically explained by Fe, more than 100 % in the north and down to 19 % in the south. Compared to the modeling approach, the Fe addition gives a conser-vative estimate of the role of Fe to variation in water color. Hence we are more likely to underestimate than overestimate the importance of Fe.
It appears that in the south, where the increase in color is most pronounced, changes in OM quality, increases in OM quantity and Fe concentration may have contributed to this trend, while in the north Fe may have been more important than changes in OM quantity and quality. The south of Swe-den has been more severely affected by sulfur deposition. As reversed acidification has been suggested to be an important factor behind changes in OM quantity (Monteith et al., 2007; Erlandsson et al., 2008) and quality (Ekstr¨om et al., 2011), this phenomenon may be more important in the southern part of Sweden, and this may be reflected in the strongly upward trends in the south and few and smaller trends in the north.
4.3 Why is Fe increasing?
In contrast to terrestrial OM export, the mobility of Fe should not be directly enhanced by the reduced acidity of soils since the solubility of FeIII is reduced at higher pH due to the formation of Fe-hydroxides. Landre et al. (2009) found Fe concentrations to be independent of acidity (SO24−) in all compartments (e.g. soil layers, upland and wetland draining streams) of a forested catchment in Canada. Neither were Fe concentrations related to alkalinity in soils, ground and streamwater in the Plynlimon catchments in mid-Wales (Neal et al., 2008).
Is OM a driver behind increasing Fe? Spatial and tem-poral association of Fe and OM, in this dataset and many others, may indicate that positive Fe trends are the result of increasing concentrations of OM in the water. In fact, Fe is soluble only under anoxic conditions, as FeII, or at strongly acidic pH, and it is the interaction between Fe and OM that maintain Fe in solution under conditions prevailing in these rivers out of which it would otherwise precipitate (Shapiro, 1966). Accordingly, an important pathway for Fe into
sur-face waters is leaching from organic forest and wetland soils in complex with OM (Maranger et al., 2006). There is a spa-tial relationship between Fe and OM measured both as COD and TOC among the rivers. However, the Fe/TOC ratios vary widely from 10 to 219 µg Fe mg−1 TOC (annual means for 2009). This suggests that the spatial controls of Fe and OM are similar but not identical and are probably linked to differ-ences in the catchment characteristics such as the influence of peatland and precipitation (Kortelainen et al., 2006). For ex-ample, both Fe and dissolved OM export has been shown to be a function of peatland coverage (Dillon and Molot, 1997). There are also temporal relationships between Fe and OM, i.e. in 18 out of the 27 rivers where Fe shows a positive trend there is a concurrent increase in COD. A similar association was found in catchments in the UK (Neal et al., 2008). How-ever, the relationship between Fe and OM within rivers is generally weak. Most importantly, the observation that Fe per unit of OM is increasing – Fe/COD has increased in 20 of the rivers by on average 50 % – is at odds with the theory that the increase in OM is the driver behind increasing Fe (Neal et al., 2008). If Fe was controlled by the concentration of OM in the rivers it should increase proportionately and in all rivers.
The ability of OM to form complexes with Fe is related OM quality, since Fe associates preferentially with high MW OM (Pennanen and Frisk, 1984). However, it appears un-likely that changes in OM quality would explain such a large increase in Fe/COD, up to 133 %. It has been modeled that over 99 % of the Fe in these rivers occur as oxyhydroxide (ferrihydrite, FeOOH; W¨allstedt et al., 2010). Dissolved OM is known to bind to the surface of ferrihydrite and stabilize against aggregation by giving the particle surface a net neg-ative charge (Tipping, 1981). To obtain a broad estimate of the importance of this process, Neal et al. (2008) produced an indicate empirical model based on data from rivers of the UK and found that about 5 % of dissolved OM would be bound to ferrihydrite. Even if the conditions prevailing in the Swedish rivers may differ from those in the UK, the concentrations of unbound OM should be in excess relative to those binding to ferrihydrite. In all, it appears that neither increasing OM nor changes in OM quality can be the sole explanations of increasing Fe.
temperature, precipitation and runoff across Sweden since 1972 (Hellstr¨om and Lindstr¨om, 2008) is in line with in-creasing anoxia in organic soils. Another factor affecting the groundwater table is silviculture. Intense forestry and clear-cutting may raise the groundwater level (Pothier et al., 2003) and Fe/DOC in stream water have been found to be higher in managed than in unmanaged forests (Lundin, 1991). While combining water chemistry data with measures of groundwa-ter levels, wagroundwa-ter flow and temperature is outside the scope of this study, these aspects warrant further research.
4.4 Implications of increasing Fe concentrations
The positive trends for Fe in the rivers reflect higher concen-trations of Fe in the freshwater component of the catchments and also increasing export to coastal areas. Besides the obvi-ous effect of increasing water color and reducing light pen-etration, Fe may affect the biogeochemical cycling of OM, phosphorus and nitrogen. Photooxidation of OM is enhanced by Fe (Minor et al., 2006), and photooxidation in the pres-ence of Fe promotes the formation of sedimenting particles and an associated loss of OM and Fe (Gao and Zepp, 1998; von Wachenfeldt et al., 2008). Also in the absence of pho-tooxidation Fe appears to stimulate the generation of high molecular weight DOM and to induce a shift towards greater molecular weight (Pullin et al., 2007). Thus Fe may aug-ment photooxidation of OM and also enhance the loss of OM from the water column through aggregation and sedi-mentation. Due to adsorbtion of phosphate to Fe hydroxides and oxides, Fe affects leaching (Dillon and Molot, 1997), sedimentation (Jonsson and Jansson, 1997) and bioavailabil-ity of phosphorus (Maranger and Pullin, 2003). As a co-factor in nitrogenase and nitrate reductase, Fe is potentially limiting primary productivity, nitrate reduction and nitrogen fixation in marine environments. In fact, Fe additions have been shown to stimulate the production of nitrogen fixing cyanobacteria in the Baltic Sea (Stal et al., 1999; Stolte et al., 2006). Finally, increasing concentrations of Fe can have direct and indirect toxic effects on aquatic biota. Precipita-tion of Fe on fish gills can impair ion regulaPrecipita-tion and oxygen uptake (Peuranen et al., 1994). Concentrations of toxic met-als such as arsenic and vanadium appear to be determined by concentrations of Fe, and are reported to increase in southern Sweden (W¨allstedt et al., 2010).
4.5 Concluding remarks
The majority of Swedish rivers exhibit strong increases in Fe concentrations over the last four decades. This trend is spatially and temporally associated to increasing water color, and the response in water color to Fe additions suggests that Fe may explain a significant share of the browning of river waters. Although Fe is generally correlated to concentrations of OM, Fe is increasing more than OM, indicating that Fe and OM concentrations are controlled by similar, but not
identi-cal, processes. The fact that Fe/OM ratios increase may be due to changes in the amounts of anoxic groundwater, rich in FeII, feeding into these river systems. This points to the im-portance of changing hydrological and redox conditions, that are connected to climate change, as determinants for brown-ing of inland waters and implies that brownification may be a continuous process if predictions of a warmer and wetter climate for the region hold (R¨ais¨anen et al., 2004). It is im-portant to better understand to what extent Fe is contributing to enhanced water color, since to the extent that brownifica-tion is an effect of decreased sulfur deposibrownifica-tion it is likely to level off, and the consequences of increasing concentrations of Fe are in part different from those of increasing OM.
Acknowledgements. This research was supported by FORMAS
through funding to E. Kritzberg and the strong research envi-ronment Managing Multiple Stressors in the Baltic Sea. We thank J. Ingri and M. Jonsson for sharing valuable insights. We especially wish to acknowledge the environmental monitoring carried out within the Swedish national monitoring program run by the Swedish University of Agricultural Sciences.
Edited by: T. J. Battin
References
Aiken, G. R., McKnight, D. M., Thorn, K. A., and Thurman, E. M.: Isolation of hydrophilic organic acids from water using nonionic macroporous resins, Organic Geochemistry, 18, 567–573, 1992. Bade, D. L., Carpenter, S. R., Cole, J. J., Pace, M. L., Kritzberg, E., Van de Bogert, M. C., Cory, R. M., and McKnight, D. M.: Sources and fates of dissolved organic carbon in lakes as deter-mined by whole-lake carbon isotope additions, Biogeochemistry, 84, 115–129, 2007.
Canfield, D. E., Linda, S. B., and Hodgson, L. M.: Relations be-tween color and some limnological characteristics of Florida lakes, Water Res. Bull., 20, 323–329, 1984.
Chow, A. T., Dahlgren, R. A., and Harrison, J. A.: Watershed sources of disinfection byproduct precursors in the Sacramento and San Joaquin rivers, California, Environ. Sci. Technol., 41, 7645–7652, 2007.
Correll, D. L., Jordan, T. E., and Weller, D. E.: Effects of precipita-tion, air temperature, and land use on organic carbon discharges from rhode river watersheds, Water, Air Soil Poll., 128, 139-159, 2001.
Dillon, P. J. and Molot, L. A.: Effect of landscape form on export of dissolved organic carbon, iron, and phosphorus from forested stream catchments, Water Resour. Res., 33, 2591–2600, 1997. Driscoll, C. T., Driscoll, K. M., Roy, K. M., and Mitchell, M. J.:
Chemical response of lakes in the Adirondack Region of New York to declines in acidic deposition, Environ. Sci. Technol., 37, 2036–2042, 2003.
Erlandsson, M., Buffam, I., F¨olster, J., Laudon, H., Temnerud, J., Weyhenmeyer, G. A., and Bishop, K.: Thirty-five years of syn-chrony in the organic matter concentrations of Swedish rivers explained by variation in flow and sulphate, Glob. Change Biol., 14, 1191–1198, 2008.
Freeman, C., Evans, C. D., Monteith, D. T., Reynolds, B., and Fen-ner, N.: Export of organic carbon from peat soils, Nature, 412, 785–785, 2001.
Frey, K. E. and Smith, L. C.: Amplified carbon release from vast West Siberian peatlands by 2100, Geophys. Res. Lett., 32, 1–4, doi:10.1029/2004GL022025, 2005.
Gao, H. and Zepp, R. G.: Factors influencing photoreactions of dis-solved organic matter in a coastal river of the southeastern United States, Environ. Sci. Technol., 32, 2940–2946, 1998.
Haaland, S., Hongve, D., Laudon, H., Riise, G., and Vogt, R. D.: Quantifying the Drivers of the Increasing Colored Organic Mat-ter in Boreal Surface WaMat-ters, Environ. Sci. Technol., 44, 2975– 2980, 2010.
Heikkinen, K.: Organic matter, iron and nutrient transport and na-ture of dissolved organic matter in the drainage basin of a boreal humic river in northern Finland, Sci. Total Environ., 152, 81–89, 1994.
Heikkinen, K., and Ihme, R.: Retention of organic Fe-P-colloids from peat mining water in an overland flow wetland treatment system in northern Finland, Archiv fuer Hydrobiologie, 134, 547-560, 1995.
Hellstr¨om, S.-S. and Lindstr¨om, G.: Regional analys av klimat, vat-tentillg˚ang och h¨oga fl¨oden, Swedish Meteorlogical and Hydro-logical Institute, Hydrologi nr 110, 2008.
Hongve, D., Riise, G., and Kristiansen, J. F.: Increased colour and organic acid concentrations in Norwegian forest lakes and drink-ing water - a result of increased precipitation?, Aquat. Sci., 66, 231–238, 2004.
Huser, B. J., K¨ohler, S. J., Wilander, A., Johansson, K., and F¨olster, J.: Temporal and spatial trends for trace metals in streams and rivers across Sweden (1996–2009), Biogeosciences, 8, 1813– 1823, doi:10.5194/bg-8-1813-2011, 2011.
Jonsson, A. and Jansson, M.: Sedimentation and mineralisation of organic carbon, nitrogen and phosphorus in a large humic lake, northern Sweden, Archiv Fur Hydrobiologie, 141, 45-65, 1997. Kortelainen, P., Mattsson, T., Finer, L., Ahtiainen, M., Saukkonen,
S., and Sallantaus, T.: Controls on the export of C, N, P and Fe from undisturbed boreal catchments, Finland, Aquat. Sci., 68, 453–468, 2006.
Kottek, M., Grieser, J., Beck, C., Rudolf, B., and Rubel, F.: World map of the Koppen-Geiger climate classification updated, Mete-orol. Z., 15, 259–263, 2006.
Landre, A. L., Watmough, S. A., and Dillon, P. J.: The effects of dissolved organic carbon, acidity and seasonality on metal geochemistry within a forested catchment on the Precambrian Shield, central Ontario, Canada, Biogeochemistry, 93, 271–289, 2009.
Lundin, L.: Influence of silviculture on content of organic matter and metals in water, Finnish Humus News, 3, 21–26, 1991. Maloney, K. O., Morris, D. P., Moses, C. O., and Osburn, C. L.:
The role of iron and dissolved organic carbon in the absorption of ultraviolet radiation in humic lake water, Biogeochemistry, 75, 393–407, 2005.
Maranger, R., and Pullin, M. J.: Elemental Complexation by Dis-solved Organic Matter in Lakes: Implications for Fe Speciation and the Bioavailability of Fe and P, in: Aquatic Ecosystems In-teractivity of Dissolved Organic Matter, edited by: Findlay, S. E. G. and Sinsabaugh, R. L., Academic Press, 2003.
Maranger, R., Canham, C. D., Pace, M. L., and Papaik, M. J.: A spa-tially explicit model of iron loading to lakes, Limnol. Oceanogr., 51, 247–256, 2006.
Martin-Mousset, B., Croue, J. P., Lefebvre, E., and Legube, B.: Dis-tribution and characterization of dissolved organic matter of sur-face waters, Water Res., 31, 541–553, 1997.
Minor, E. C., Pothen, J., Dalzell, B. J., Abdulla, H., and Mop-per, K.: Effects of salinity changes on the photodegradation and ultraviolet-visible absorbance of terrestrial dissolved organic matter, Limnol. Oceanogr., 51, 2181–2186, 2006.
Monteith, D. T., Stoddard, J. L., Evans, C. D., de Wit, H. A., For-sius, M., Høg˚asen, T., Wilander, A., Skjelkv˚ale, B. L., Jeffries, D. S., Vuorenmaa, J., Keller, B., Kopacek, J., and Vesely, J.: Dissolved organic carbon trends resulting from changes in atmo-spheric deposition chemistry, Nature, 450, 537–541, 2007. Neal, C., Lofts, S., Evans, C. D., Reynolds, B., Tipping, E., and
Neal, M.: Increasing iron concentrations in UK upland waters, Aquat. Geochem., 14, 263–288, 2008.
Pace, M. L. and Cole, J. J.: Synchronous variation of dissolved organic carbon and color in lakes, Limnol. Oceanogr., 47, 333– 342, 2002.
Pennanen, V. and Frisk, T.: A statistical model for conversion of absorbance measurements with significant iron interference into organic carbon in a polyhumic lake, Aqua Fennica, 14, 171–178, 1984.
Peuranen, S., Vuorinen, P. J., Vuorinen, M., and Hollender, A.: The effects of iron, humic acids and low pH on the gills and physi-ology of brown trout (Salmo Trutta), Ann. Zool. Fenn., 31, 389– 396, 1994.
Pothier, D., Pr´evost, M., and Auger, I.: Using the shelterwood method to mitigate water table rise after forest harvesting, For. Ecol. Manage., 179, 573–583, 2003.
Pullin, M. J., Anthony, C., and Maurice, P. A.: Effects of iron on the molecular weight distribution, light absorption, and fluorescence properties of natural organic matter, Environ. Eng. Sci., 24, 987– 997, 2007.
R¨ais¨anen, J., Hansson, U., Ullerstig, A., D¨oscher, R., Graham, L. P., Jones, C., Meier, H. E. M., Samuelsson, P., and Willen, U.: Euro-pean climate in the late twenty-first century: regional simulations with two driving global models and two forcing scenarios, Clim. Dynam., 22, 13–31, 2004.
Shapiro, J.: On measurement of ferrous iron in natural waters, Lim-nol. Oceanogr., 11, 293—298, 1966.
Stal, L. J., Staal, M., and Villbrandt, M.: Nutrient control of cyanobacterial blooms in the Baltic Sea, Aquat. Microb. Ecol., 18, 165–173, 1999.
Stolte, W., Balode, M., Carlsson, P., Grzebyk, D., Janson, S., Lips, I., Panosso, R., Ward, C. J., and Graneli, E.: Stimulation of nitrogen-fixing cyanobacteria in a Baltic Sea plankton commu-nity by land-derived organic matter or iron addition, Mar. Ecol.-Prog. Ser., 327, 71–82, 2006.
doi:10.1029/2007GB003023, 2008.
Tipping, E.: The absorption of aquatic humic substances by iron oxides, Geochim. Cosmochim. Acta, 45, 191–199, 1981. Wilander, A.: Organic Substances in Natural Water. A Comparison
of Results from Different Analytical Methods, Vatten, 44, 217– 224, 1988.
Williamson, C. E., Morris, D. P., Pace, M. L., and Olson, A. G.: Dissolved organic carbon and nutrients as regulators of lake ecosystems: Resurrection of a more integrated paradigm, Lim-nol. Oceanogr., 44, 795–803, 1999.
von Einem, J. and Graneli, W.: Effects of fetch and dissolved or-ganic carbon on epilimnion depth and light climate in small for-est lakes in southern Sweden, Limnol. Oceanogr., 55, 920–930, 2010.
von Wachenfeldt, E., Sobek, S., Bastviken, D., and Tranvik, L. J.: Linking allochthonous dissolved organic matter and boreal lake sediment carbon sequestration: The role of light-mediated floc-culation, Limnol. Oceanogr., 53, 2416–2426, 2008.