Article
A Matlab program for stepwise regression
Yanhong Qi
1,
GuangHua Liu
2,
WenJun Zhang
3 1Sun Yat-sen University Libraries, Sun Yat-sen University, Guangzhou 510275, China 2
Guangdong AIB Polytech College, Guangzhou 510507, China 3
School of Life Sciences, Sun Yat-sen University, Guangzhou 510275, China; International Academy of Ecology and Environmental Sciences, Hong Kong
E-mail: [email protected], [email protected]
Received 8 October 2015; Accepted 2 December 2015; Published online 1 March 2016
Abstract
The stepwise linear regression is a multi-variable regression for identifying statistically significant variables in
the linear regression equation. In present study, we presented the Matlab program of stepwise regression.
Keywords
stepwise linear regression; variables identification; statistic significance; Matlab program.
1 Introduction
The stepwise linear regression is a multi-variable regression for identifying statistically significant variables in
the linear regression equation (Zhang and Fang, 1982). It is expected to be used in network pharmacology for
identifying attributes, traits, variables, etc. In present study we presented the Matlab program of stepwise
regression.
2 Algorithm
Suppose there are
n
candidate variables for
m
samples. The raw data matrix is
x
=(
x
ij)
n×m. The full
multi-variable linear regression equation is (Zhang and Fang, 1982)
y
=
b
0+ b
1x
1+ b
2x
2+...+ b
nx
nwhere
x
iis the
i
-th variable. Let
m m m
l
ij=
l
ji=
∑
x
jkx
ik-[
∑
x
jk∑
x
ik]/
m
k=1 k=1 k=1
m m m
l
iy=
∑
x
iky
k-[
∑
x
ik∑
y
k]/
m
k=1 k=1 k=1
Network Pharmacology ISSN 24151084
URL: http://www.iaees.org/publications/journals/np/onlineversion.asp RSS: http://www.iaees.org/publications/journals/np/rss.xml
Email: [email protected] EditorinChief: WenJun Zhang
i, j
=1,2,…,
n
Correlation coefficients between independent variables and between independent variables and dependent
variable
y
are
r
ij=
l
ij/(
l
iil
jj)
0.5r
iy=
l
iy/(
l
iil
yy)
0.5Solve the equation
r
i1b’
1+ r
i2b’
2+...+ r
inb’
n=
r
iyi
=1,2,…,
n
The variance contribution of each variable is
v
i=
r
iy2/
r
ii2Let
v
k=max
v
i, and calculate
F
=(
m
-
l
-1)
v
k/
q
, where
l
is the number of variables included in the equation,
q
is the
square of residuals. For first screening,
q
=
v
k. If
F
≥
F
a, include the variable
x
kin the equation (
F
a=0.1, etc.), or
else remove
x
k. The correlation matrix are changed as the following
r
ij=
r
ij-
r
ikr
kj/r
kki
,
j
≠
k
r
kj=
r
kj/r
kkj
≠
k
,
i
=
k
r
jk=-
r
jk/r
kkj
≠
k
,
i
=
k
r
kk=1
/r
kki
=
k
,
j
=
k
where
k
is the
k
-th included or removed variable. Calculate
v
k(
l
+1)=max
v
i(
l
+1), and
F
=(
m
-
l
-2)
v
k(
l
+1)/(
q
(
l
)-v
k(
l
+1)). If
F
(
l
+1)
≥
F
a, include the variable
x
kin the equation, and change the correlation matrix. Let
v
k=max
v
i,
where
x
kis the variable already in the equation,
F
k=(
m
-
l
-1)
v
k(
l
)/
q
(
l
), where
q
is the
r
yyin the inverse matrix of
correlation matrix. If
F
k≤
F
a, remove the variable
x
kfrom the equation, otherwise include the variable. Repeat
the procedure above, until no variable can be included or remove from the equation.
By doing so, the linear regression equation is obtained as the following
k k j
j i
i
x
b
x
b
x
b
b
y
~
0
~
...
~
...
~
and the variables remained in the equation are qualified variables.
The following are Matlab codes (stepwiseRegression.m) of the algorithm
%Reference: Qi YH, Liu GH, Zhang WJ. 2016. A Matlab program for stepwise regression. Network Pharmacology, 1(1): 36-41 raw=input('Input the file name of sample-by-variable data (e.g., raw.txt, raw.xls, etc. The matrix is z=(zij)m*(n+1), where m is total number of samples, n is the number of variables, the last column is the dependent variable): ','s');
fs=input(' F threshold value for identifying variables (e.g., 0.1, 0.05): '); x=(load(raw))';
m=size(x,2); n=size(x,1);
xb=zeros(1,n); sg=zeros(1,n); ds=zeros(1,n); a=zeros(n);
for j=1:m
c=c+x(i,j);
end
xb(i)=c/m;
c=0;
for j=1:m
c=c+(x(i,j)-xb(i))^2;
end
sg(i)=sqrt(c);
end
h=sg(n);
for i=1:n-1
for j=i+1:n
c=0;
for k=1:m
c=c+(x(i,k)-xb(i))*(x(j,k)-xb(j));
end
a(i,j)=c/(sg(i)*sg(j)); a(j,i)=a(i,j);
end; end
for i=1:n
xb(i)=i; sg(i)=0; a(i,i)=1;
end
disp('Correlation matrix')
CorrMat=a
l=0; s=0;
while (n>=1)
if (l==n-1) break; end
ma=0;
for i=1:n
ds(i)=xb(i);
end
for i=1:n-1
if (ds(i)==0) continue; end
if (a(i,i)<1e-05) continue; end
v1=a(i,n)*a(n,i)/a(i,i);
if (v1>ma) ma=v1; k=i; end
end
f1=ma*(m-l-2)/(a(n,n)-ma);
if (f1<=fs) break; end
xb(k)=0; sg(k)=k;
l=l+1;
for i=1:n
for j=1:n
if ((i~=k) & (j~=k)) a(i,j)=a(i,j)-a(i,k)*a(k,j)/a(k,k); end
for j=1:n
if (j~=k) a(k,j)=a(k,j)/a(k,k); a(j,k)=-a(j,k)/a(k,k); end
end
a(k,k)=1/a(k,k);
r=sqrt(1-a(n,n));
yn=h*sqrt(a(n,n)/(m-l-1));
if (s==0) s=1; continue; end
lab=0;
while (n>=1)
ma=-1e+18;
for i=1:n
ds(i)=sg(i);
end
for i=1:n-1
if (ds(i)==0) continue; end
if (a(i,i)<1e-05) continue; end
v1=a(i,n)*a(n,i)/a(i,i);
if (v1>ma) ma=v1;k=i; end
end
f1=-ma*(m-l-1)/a(n,n);
if (f1>fs) lab=1; break; end
sg(k)=0; xb(k)=k;
l=l-1;
for i=1:n
for j=1:n
if ((i~=k) & (j~=k)) a(i,j)=a(i,j)-a(i,k)*a(k,j)/a(k,k); end
end; end
for j=1:n
if (j~=k) a(k,j)=a(k,j)/a(k,k); a(j,k)=-a(j,k)/a(k,k); end
end
a(k,k)=1/a(k,k);
r=sqrt(1-a(n,n));
yn=h*sqrt(a(n,n)/(m-l-1));
end;
if (lab==1) continue; end
end
for i=1:n-1
a(i,1)=sg(i);
end
for i=1:n
c=0;
for j=1:m
c=c+x(i,j);
end
c=0;
for j=1:m
c=c+(x(i,j)-xb(i))^2;
end
sg(i)=sqrt(c);
end
h=sg(n);
c=0;
for i=1:n-1
if (a(i,1)==0) continue; end
ds(i)=a(i,n)*sg(n)/sg(i);
a(i,2)=ds(i);
c=c+ds(i)*xb(i);
end
s=xb(n)-c;
iss=strcat(iss,'Qualified variables: \n');
for i=1:n-1
if (a(i,1)==0) continue; end
if (ds(i)~=0) iss=strcat(iss,'Variable-',num2str(i)); end
if ((ds(i+1)~=0) & (i<n-1)) iss=strcat(iss,','); end
if (ds(i)~=0)
end; end
iss=strcat(iss,'\nStepwise regression equation:\n');
iss=strcat(iss,'y=',num2str(s));
for i=1:n-1
if (a(i,1)==0) continue; end
if (ds(i)>0) e1=num2str(ds(i)); end
if (ds(i)<0) e1=num2str(abs(ds(i))); end
if (ds(i)>0) iss=strcat(iss,'+',e1,'Variable',num2str(i)); end
if (ds(i)<0) iss=strcat(iss,'-',e1,'Variable',num2str(i)); end
end
iss=strcat(iss,'\nCorrelation coefficient R=',num2str(r),', ','F value=',num2str(fs),'\n');
fprintf(iss)
3 Case Study
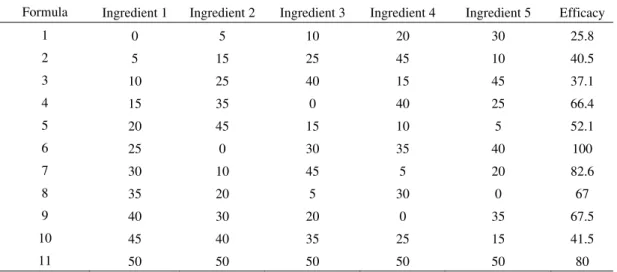
Here we use the data of Gu and Liang (2008) on the hypnotics efficacy of various formulae of five ingredients
(Table 1).
Let F=0.2, and use the algorithm. The ingredient 3 is proved to be insignificant in determining hypnotics
efficacy (
y
). The regression equation is
y
=39.8714+1.0336 ingredient1-0.65999 ingredient2+0.23529 ingredient4+0.19802 ingredient5
Table 1 Hypnotics efficacy of various formulae of five ingredients (Gu and Liang, 2008).
Formula Ingredient 1 Ingredient 2 Ingredient 3 Ingredient 4 Ingredient 5 Efficacy
1 0 5 10 20 30 25.8
2 5 15 25 45 10 40.5
3 10 25 40 15 45 37.1
4 15 35 0 40 25 66.4
5 20 45 15 10 5 52.1
6 25 0 30 35 40 100
7 30 10 45 5 20 82.6
8 35 20 5 30 0 67
9 40 30 20 0 35 67.5
10 45 40 35 25 15 41.5
11 50 50 50 50 50 80