Article
Diastolic Dysfunction Induced by a High-Fat Diet Is
Associated with Mitochondrial Abnormality and Adenosine
Triphosphate Levels in Rats
Ki-Woon Kang1, Ok-Soon Kim1, Jung Yeon Chin1, Won Ho Kim1, Sang Hyun Park1, Yu Jeong Choi1, Jong Ho Shin1, Kyung Tae Jung1, Do-Seon Lim2, Seong-Kyu Lee1,3
1
Department of Internal Medicine, Eulji University Hospital, Eulji University School of Medicine, Daejeon; 2
Department of Dental Hygiene, Eulji University College of Health Science, Seongnam; 3Department of Biochemistry-Molecular Biology, Eulji University School of Medicine, Daejeon, Korea
Background: Obesity is well-known as a risk factor for heart failure, including diastolic dysfunction. However, this mechanism in high-fat diet (HFD)-induced obese rats remain controversial. The purpose of this study was to investigate whether cardiac dys-function develops when rats are fed with a HFD for 10 weeks; additionally, we sought to investigate the association between mi-tochondrial abnormalities, adenosine triphosphate (ATP) levels and cardiac dysfunction.
Methods: We examined myocardia in Wistar rats after 10 weeks of HFD (45 kcal% fat, n=6) or standard diet (SD, n=6). Echo-cardiography, histomorphologic analysis, and electron microscopy were performed. The expression levels of mitochondrial oxi-dative phosphorylation (OXPHOS) subunit genes, peroxisome-proliferator-activated receptor γ co-activator-1α (PGC1α) and an -ti-oxidant enzymes were assessed. Markers of oxidative stress damage, mitochondrial DNA copy number and myocardial ATP level were also examined.
Results: After 10 weeks, the body weight of the HFD group (349.6±22.7 g) was significantly higher than that of the SD group (286.8±14.9 g), and the perigonadal and epicardial fat weights of the HFD group were significantly higher than that of the SD group. Histomorphologic and electron microscopic images were similar between the two groups. However, in the myocardium of the HFD group, the expression levels of OXPHOS subunit NDUFB5 in complex I and PGC1α, and the mitochondrial DNA copy number were decreased and the oxidative stress damage marker 8-hydroxydeoxyguanosine was increased, accompanied by re-duced ATP levels.
Conclusion: Diastolic dysfunction was accompanied by the mitochondrial abnormality and reduced ATP levels in the myocardi-um of 10 weeks-HFD-induced rats.
Keywords: Obesity; Diastolic dysfunction; Mitochondria
Received: 15 October 2015, Revised: 26 October 2015,
Accepted: 20 November 2015
Corresponding author: Seong-Kyu Lee
Department of Internal Medicine, Eulji University Hospital, Eulji University School of Medicine, 95 Dunsanseo-ro, Seo-gu, Daejeon 35233, Korea
Tel: +82-42-259-1642, Fax: +82-42-259-1539, E-mail: [email protected]
Copyright © 2015 Korean Endocrine Society
INTRODUCTION
Obesity has been well-known as a risk factor for heart failure [1]. An echocardiographic study has reported an association between diastolic dysfunction and obesity, even in the absence of systolic heart failure [2]. Diastolic dysfunction has been con-sidered the earliest sign of heart failure related to obesity [3,4]. Genetic experimental models have been proposed to determine the pathophysiological association between obesity and cardiac dysfunction [5]. Although genetic factors may contribute to an individual becoming obese, the high-fat diet (HFD) or over-nu-trition model may promote a positive energy balance that leads to obesity and may also be an experimental model that repro-duces many characteristics of human metabolism for obesity and other metabolic disorders, such as diabetic cardiomyopathy [5-7]. Metabolic imbalances caused by HFD-induced obesity have a complex impact on the myocardium. Mitochondria are highly vulnerable to oxidative damage [8,9]. The mitochondrial DNA (mtDNA) copy number, which reflects the content of mtDNA, is associated with mitochondrial biogenesis [10]. Mi-tochondrial dysfunction is expressed as a decrease in mtDNA copy number [10]. Mitochondrial dysfunction induced by oxi-dative stress is thought to contribute to the development of car-diometabolic diseases [11]. Reduced adenosine triphosphate (ATP) production from mitochondrial oxidative phosphoryla-tion (OXPHOS) and increased oxidative stress are major trig-gers of senescence dysfunction for long-lived postmitotic cells, such as neurons, cardiac myocytes, skeletal muscle fibers and retinal pigment epithelium [11]. Twenty weeks of HFD feeding resulted in diastolic dysfunction, myocardial lipid accumula-tion associated with oxidative stress and fibrosis, and disturbed calcium homeostasis without systolic dysfunction and impair-ment of cardiac energetics in a mouse model of HFD-induced obesity [12]. High-fat, high-sucrose diet for 8 months in a mouse model caused increased oxidative stress in cardiac mito-chondria associated with decreased ATP synthesis and de-creased complex II activity of mitochondrial OXPHOS [13]. In another previous study, a high-sugar and HFD for 4 to 8 weeks impaired cardiac systolic and diastolic function in mice [14]. The results of HFD-induced changes in cardiac structure and function can vary in the mouse model.
The purpose of this study was to investigate whether cardiac dysfunction develops when rats are fed with a HFD for 10 weeks; additionally, we sought to investigate the association between mitochondrial abnormalities, ATP levels and cardiac dysfunction.
METHODS
Rats and housing
All animal procedures were approved by the Eulji University Institutional Animal Care and Use Committee at Daejeon, Re-public of Korea. Wistar rats (6 weeks old, 150 g) were obtained from Harlan (Madison, WI, USA) and were housed at the Ani-mal Care Center of Eulji University at Daejeon under con-trolled conditions. Briefly, rats were housed in pairs at 23°C±
1°C with a 12-hour light/12-hour dark cycle. The rats were giv-en free access to water and rat chow for the ‘standard diet (SD)’ (10 kcal% fat, Harlan Laboratories), or ‘HFD’ (45 kcal% fat, Harlan Laboratories). The rats were randomly assigned to two groups, SD or HFD, which consisted of six rats each. The ini-tial, weekly and final body weights were recorded. After 10 weeks, all rats (n=12) were fasted overnight and decapitated
under CO2 anesthesia. The blood samples and tissues of all rats were collected. Serum was stored at −80°C until further analy -sis. After blood collection, the heart, appendages, epicardial and perigonadal fat, and soleus muscle were snap-frozen and stored at −80ºC until further analysis. Some of the heart and soleus muscles were fixed for histologic examination or trans-mission electron microscopy (TEM).
Histology and transmission electron microscopy
Transverse sections of the left ventricle (LV) apex in the each group were fixed in 10% buffered formalin (Sigma Aldrich Co., St. Louis, MO, USA) and embedded in paraffin. Sections (1 μm thick) were cut from tissue blocks and stained with he -matoxylin and eosin. For TEM, LV myocardial tissues were fixed in 2.5% paraformaldehyde-glutaraldehyde at 4°C for 24 hours and then washed with 0.1 M phosphate-buffered solution at 4°C. After washing twice, the tissues were post-fixed with 1% OsO4-buffered solution (pH 7.4) for 90 minutes. Samples
were dehydrated with serial ethanol and propylene oxide treat-ment and embedded in Poly/EM Bed812 embedding medium. The resin was then polymerized in a vacuum drying oven at 60°C for 48 hours. Tissues were sectioned using an EM Ultra-microtome LKB-2088 and stained with 1% toluidine blue, and ultra-thin sections were then double-stained with uranyl acetate and lead citrate and examined with a Hitachi H-7600 electron microscope (Hitachi, Tokyo, Japan).
Echocardiographic analysis
echocar-diography, all rats were anesthetized with an intraperitoneal in-jection of a mixture of ketamine (50 mg/kg) and xylazine (1 mg/kg). The chest wall hair of all rats was carefully removed, and a warm ultrasound transmission gel was gently applied to ensure optimal image quality. Echocardiography was per-formed using a high-frequency 15-MHz linear transducer (En-tos CL15-7, Philips Medical Systems, Bothell, WA, USA) con-nected to an ultrasound system (ATL-HDI5000, Philips Medical Systems). Imaging was performed at a 60° sector angle with 3 cm imaging depth. M-mode and 2-dimensional echocardio-graphic images were obtained from the short-axis, long-axis and 4 chamber views. All LV traces were manually measured with a caliper by the same observer according to the leading-edge method of the American Society of Echocardiography [16]. Measurements were recorded as the mean of at least three con-secutive cardiac cycles. Left ventricle end-diastolic dimension (LVEDD), posterior wall thickness in diastole and anterior wall thickness in diastole were measured at the maximum diastolic dimension. Left ventricle end-systolic dimension (LVESD), posterior wall thickness in systole and anterior wall thickness in systole were also measured at the maximum anterior motion of the posterior wall. In addition, the early peak transmitral flow velocity (E) to late peak transmitral flow velocity (A) ratio (E/ A) and the deceleration time (DT) were also measured. The LV ejection fraction (EF) and fractional shortening (FS) were cal-culated using the following formulas [17]:
EF %= [end-diastolic volume (EDV)–end-systolic volume]/
EDV×100
FS %=(LVEDD–LVESD)/LVEDD×100
Real-time polymerase chain reaction
A total of 10 to 30 mg of myocardium was homogenized using a polytron homogenizer (Fisher Scientific Inc., Pittsburgh, PA, USA). The homogenate was stored for 5 minutes to permit the complete dissociation of nucleoprotein complexes. Homoge-nates containing 0.2 mL of chloroform per 1 mL of TRI Re-agent (Molecular Research Center Inc., Cincinnati, OH, USA) were vigorously shaken for 15 seconds. Total RNA from the homogenates was isolated according to the manufacturer’s in-structions. Equal amounts of total RNA were reverse tran-scribed into cDNA using the iScript cDNA Synthesis Kit (Bio-Rad, Hercules, CA, USA). The primer sequences are listed in Table 1. Real-time polymerase chain reaction (PCR) was per-formed in a 20 μL reaction mixture containing 1 μg cDNA, 10 pmo forward primer, 10 pmol reverse primer, and 10 μL SYBR
Green Supermix (Bio-Rad) using a CFX96 Real-Time PCR Detection System (Bio-Rad Laboratories [Singapore] Pte Ltd., Singapore). The threshold cycle (Ct) values for each target mRNA were normalized to that of glyceraldehyde-3-phosphate dehydrogenase (GAPDH) mRNA, and the relative expression level of each target gene was calculated using CFX Manager software version 1.5 (Bio-Rad).
Western blot analysis
Myocardial tissue samples of approximately 10 to 30 mg were homogenized in Pro-Prep Protein Extraction Solution (Intron Biotechnology, Seoul, Korea) with protease (Roche Applied Science, Penzberg, Germany) and phosphatase inhibitors (Roche Applied Science). The homogenates were incubated for 20 to 30 minutes on ice and centrifuged at 13,000 rpm (4ºC) for 5 minutes, and the supernatant was then transferred to a fresh 1.5 mL tube. Lysates were run in a 4% to 20% MP TGX Precast Gel (Bio-Rad) and transferred to polyvinylidene difluoride membranes using a wet vertical Criterion Blotter (Bio-Rad). Membranes were blocked with 5% skim milk in 50 mmol/L Tris-HCl (pH 7.4) and 150 mmol/L NaCl (Tris-buffered saline [TBS]) and then incubated overnight at 4ºC with antibodies. All antibody dilutions were made in 0.5% bovine serum albumin and 0.1% sodium azide-TBS-Tween 20. After washing, mem-branes were incubated with the appropriate horseradish peroxi-dase-conjugated secondary antibody for 1 hour. Antibody sig-nals were developed using an enhanced chemiluminescence de-tection system (Millipore, Billerica, MA, USA). Anti-Akt (a serine/threonine kinase, protein kinase B; 1:500), anti-phospho-Akt (1:500), and anti-GAPDH (1:1,000) antibodies were ob -tained from Cell Signaling (Beverly, MA, USA), anti-peroxi-some proliferator-activated receptor γ co-activator-1α (PGC1α; 1:1,000) was obtained from Abcam (Cambridge, UK), and nico-tinamide adenine dinucleotide (NADH) dehydrogenase 1 β sub -complex 5 (NDUFB5; 1:1,000) was obtained from Novus Bio-logicals (Littleton, CO, USA). Secondary antibodies (goat anti-rabbit immunoglobulin G) were obtained from Cell Signaling.
Oxidative stress marker measurement
(Oxiselect Oxidative DNA Damage ELISA Kit, Cell Biolabs Inc., San Diego, CA, USA). The optical density of 8-OHdG as measured at 450 nm (OD 450 nm) decreases with increased re-active oxygen species (ROS) damage.
Mitochondrial copy number measurement
mtDNA in myocardial tissue was extracted from 10 mg myo-cardium using a DNeasy Blood &Tissue Kit (Qiagen Inc.). A
total of 20 ng of genomic DNA was used. The relative mtDNA copy number was measured by real-time PCR in an iCycler thermal cycler with SYBR Green Supermix (Bio-Rad) and gene-specific oligonucleotides for β-globin and the mitochon -drial gene NADH dehydrogenase subunit 1 (ND1), which are listed in Table 1. After denaturation at 95ºC for 5 minutes, ge -nomic DNA samples were treated at 95ºC for 1 second, 56ºC for 6 seconds, and 72ºC for 18 seconds for 40 cycles. The fol -Table 1. Real-Time Polymerase Chain Reaction Primer Sequences
Gene GenBank accession no. Primer strand Primer sequence (5´-3´)
NDUFB3 NM_001106912.1 Forward
Reverse
TGC AGA AGA AGC TTG CTG C AGC AAA CCC CCA TTT GAA TC
NDUFB5 NM_001106426.1 Forward
Reverse
AGT GGG GAC CAT GGC AAG A AGC CTT CTG GGA TTT CTG C
NDUFV1 NM_001006972.1 Forward
Reverse
CCT TTC CAG CAG ATG TGG G GTG CAG GGG TGG TTG ACA T
NDUFS1 NM_001005550.1 Forward
Reverse
CAA GCA AGT GAG CTT GCC AA CCT CTA CTG CCT GAG CGC C
SDHB NM_001100539.1 Forward
Reverse
CAG GAG GGC AAG CAA CAG TA CCC CAG GTA CTT GTC TCC GT
CYC1 NM_001277194.1 Forward
Reverse
TGG CTC CTC CCA TCT ACA CA GCC CAT CAT CAA CAA CAT CT
SURF1 AF182952.1 Forward
Reverse
GGC CAG TGA AGG TCA GGG G CCA GGA TGG TGA CTC CCA A
PGC1α NM_031347.1 Forward
Reverse
TAC ACC TGT GAC GCT TTC GCT GGT GGA AGC AGG GTC AAA ATC
MnSOD Y00497.1 Forward
Reverse
GTG GTG GAG AAC CCA AAG GAG TTG GAC TCC CAC AGA CAC AGC
Prdx1 NM_057114.1 Forward
Reverse
CTT TTG TGT GTC CCA CGG AG GTT CAT GGG TCC CAA TCC TC
Prdx2 NM_017169.1 Forward
Reverse
GTC CCA GAA TTA CGG CGT GT GAG CGT CCC ACA GGT AGG TC
Prdx5 NM_053610.1 Forward
Reverse
GTC TCT CTT TGG GAA TCG TCG AGT TGT GAG AGG ATG TTG GGG
COL1A1 NM_053304.1 Forward
Reverse
CTG ACT GGA AGA GCG GAG AGT A TTG GGC TGA TGT ACC AGT TCT T
SERCA2 NM_001110139.2 Forward
Reverse
CTT TTA CAG GGC GAG AAT TTG A ATC TCA TCA AAG GAC TGC AGG A
ND1 X07479.1 Forward
Reverse
CTG ACT ATT AAT CCC CGC CTG GCG TAT TCG ACG TTA AAG CCT
β-Globin X06701. Forward
Reverse
AGG AAT TCA CCC CGT CTG C GCC CAA AGG CCT TCA TCA T
GAPDH NM_017008.4 Forward
Reverse
CCA AAA GGG TCA TCA TCT CC CTA AGC AGT TGG TGG TGC AG NDUFB3, NADH dehydrogenase 1 β subcomplex, 3; NDUFB5, NADH dehydrogenase 1 β subcomplex, 5; NDUFV1, NADH dehydrogenase flavo -protein 1; NDUFS1, NADH dehydrogenase Fe-S -protein 1; SDHB, succinate dehydrogenase complex, subunit B; CYC1, cytochrome C1; SURF1,
surfeit 1; PGC1α, peroxisome-proliferator-activated receptor γ, co-activator-1α; MnSOD, manganese-containing superoxide dismutase; Prdx1, per
-oxiredoxin 1; Prdx2, per-oxiredoxin 2; Prdx5, per-oxiredoxin 5; COL1A1, collagen, type I, α 1; SERCA2, sarcoendoplasmic reticulum calcium trans
lowing equation was used to quantify the mtDNA copy number relative to β-globin: relative copy number=2ΔCt (ΔCt=Ctβ-globin–
CtND1). Relative expression was calculated using CFX Manager
software version 1.5 (Bio-Rad).
Measurement of ATP level
Myocardial tissue samples (approximately 10 mg each), which were obtained through snap-frozen, were homogenized in mammalian cell ATP lysis solution (Perkin-Elmer, Waltham, MA, USA). The homogenates were centrifuged at 12,000 rpm (4ºC) for 5 minutes, and the supernatants were transferred to fresh 1.5 mL tubes. Then, the ATPlite assay procedure was per-formed according to the manufacturer’s instructions (Perkin-Elmer). The luminescence emitted from the ATP-dependent lu-ciferase reaction was measured with a 2030 Multi-label Reader
(Perkin-Elmer).
Statistical analysis
Baseline and echocardiographic characteristics are expressed as mean±standard deviations. Other characteristics are
ex-pressed as mean±standard errors. Comparisons between two
groups were analyzed using the independent Student t test. Sta-tistical analyses were performed using SPSS version 15.0 (SPSS Inc., Chicago, IL, USA), and P values <0.05 were
con-sidered statistically significant.
RESULTS
Baseline characteristics
As shown in Table 2, the body weight of the HFD group Table 2. Characteristics of Rats after 10 Weeks of a Standard Diet or a High-Fat Diet (n=6)
Characteristic Standard diet group High-fat diet group P value
Initial body weight, g 218.13±16.93 223.73±13.68 0.187
Body weight, g 286.83±14.91 349.56±22.72 <0.01
Heart weight, g 0.81±0.12 0.84±0.07 0.234
Weight of epicardial fat, g 0.37±0.29 0.71±0.15 <0.05
Weight of appendage, g 0.03±0.01 0.21±0.44 0.144
Weight of perigonadal fat, g 6.96±3.02 13.15±6.38 <0.05
Values are expressed as mean±SD. Initial body weight (g) means body weight before starting a standard diet or a high-fat diet. Student t test was used to compare the parameters of the standard diet and high-fat diet groups.
Table 3. Comparison of the Echocardiographic Parameters of Rats after 10 Weeks of a Standard Diet or a High-Fat Diet (n=6)
Parameter Standard diet group High-fat diet group P value
LVPWS, cm 0.22±0.02 0.25±0.03 0.187
LVIDS, cm 0.37±0.01 0.41±0.01 <0.001
IVSS, cm 0.23±0.01 0.23±0.01 0.291
LVPWD, cm 0.17±0.01 0.22±0.03 0.024
LVIDD, cm 0.68±0.06 0.64±0.05 0.316
IVSD, cm 0.16±0.01 0.19±0.02 0.087
EF, % 80.43±3.45 70.66±8.10 0.022
E, cm/sec 68.66±9.81 33.00±13.17 <0.001
A, cm/sec 52.33±11.87 83.00±14.05 <0.001
E/A 1.33±0.13 0.42±0.22 <0.001
DT, ms 126.66±18.07 436.66±0.18 <0.001
Values are expressed as mean±SD. Student t test was used to compare the parameters of the standard diet and high-fat diet groups.
(349.56±22.72 g) was significantly higher (P<0.01) than that
of the SD group (286.83±14.91 g), and the weight of the
peri-gonadal fat of the HFD group (13.15±6.38 g) was significantly
higher (P<0.05) than that of the SD group (6.96±3.02 g). For
the heart tissue weights, the epicardial fat weight of the HFD group (0.71±0.15 g) was significantly higher (P<0.05) than
that of the SD group (0.37±0.29 g). However, the myocardium
tissue weight of the HFD group (0.84±0.07 g) was not
differ-ent compared to that of the SD group (0.81±0.12 g), and the
appendage weight was not different between the two groups.
Comparison of echocardiographic parameters
In the echocardiogram shown in Table 3, Fig. 1, the thickness of the left ventricular posterior wall at diastole was significant-ly increased (P<0.05) in the HFD group (0.22±0.03 cm)
com-pared with the SD group (0.17±0.01 cm). The EF, which is
representative of LV systolic function in both groups, was within the normal range (80.43%±3.45% in the SD group vs.
70.66%±8.10% in the HFD group, P=0.022); however, for
di-astolic function, the level of E in the HFD group was signifi-cantly decreased (68.66±9.81 cm/sec in the SD group vs.
33.00±13.17 cm/sec in the HFD group, P<0.001), the level of
A in the HFD group (52.33±11.87 cm/sec in the SD group vs.
83.00±14.05 cm/sec in the HFD group, P<0.001) was
cantly increased, the E/A ratio in the HFD group was signifi-cantly decreased (1.33±0.13 in SD group vs. 0.42±0.22 in
HFD group, P<0.001), and DT was significantly increased in
the HFD group (436.66±0.18 ms, P<0.001) compared with
the SD group (126.66±18.07 ms).
Histomorphologic and transmission electron microscopic images
The myocardial histology appeared to be similar in the two groups and demonstrated no striking morphological abnormali-ties after HFD (Fig. 2A, B). An electron microscopic image of the myocardium in the SD group appeared to be more electron-dense (Fig. 2C, D). Generally, electron microscopy images demonstrated no striking morphological abnormalities after HFD (Fig. 2C, D).
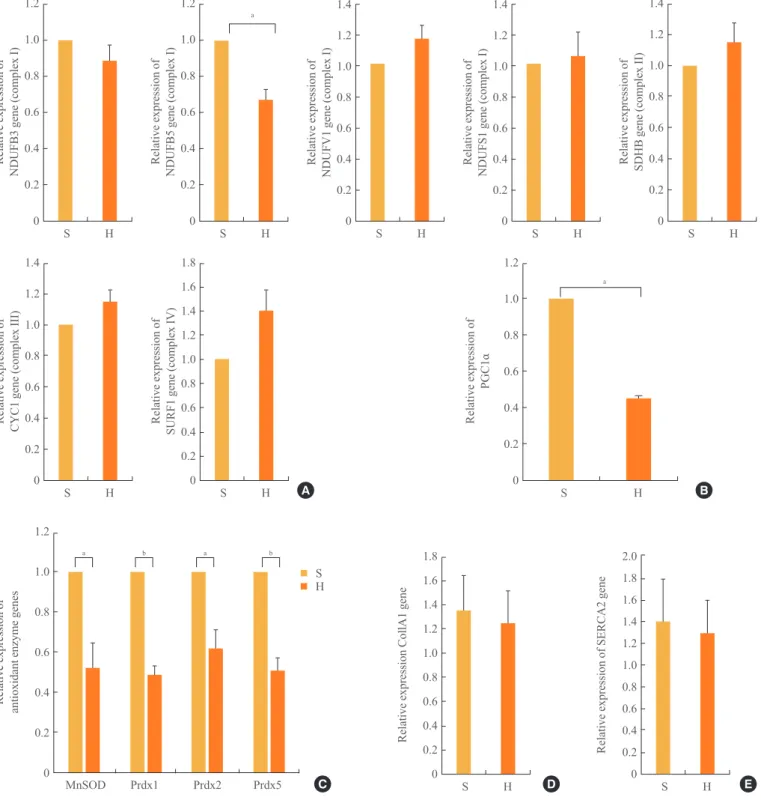
mRNA expression levels of a subset of OXPHOS subunits
and PGC1α
Cluster analysis grouped the regulated genes into five clusters based on three principal components in the mitochondria; how-ever, the genes in complex I were highly focused on the manipu-lations, as previously reported [18]. We sought to confirm the ex-pression of these OXPHOS genes by real-time quantitative PCR. As shown in Fig. 3A, the mRNA expression levels of the OX-PHOS genes NDUFB5 was significantly (P<0.05) decreased,
similar to the levels in skeletal muscle [19], compared with the complex I genes, including NDUFB3, NDUFB5, NADH dehy-drogenase (ubiquinone) flavoprotein 1 (NDUFV1), and NADH dehydrogenase (ubiquinone) Fe-S protein 1 (NDUFS1). The mRNA expression levels of NDUFB 3, NDUFV1, and NDUFS1 of complex I, the succinate dehydrogenase complex, subunit B (SDHB) of complex II, cytochrome C1 (CYC1) of complex III, and surfeit 1 (SURF1) of complex IV were not different be-tween the SD and HFD groups. In addition, the level of PGC1α expression associated with mitochondrial biogenesis [19,20] was significantly (P<0.05) reduced by 54% in the HFD com-Fig. 1. Comparison of the mitral inflow patterns in the diastolic stages between (A) the standard diet and (B) high-fat diet groups.
Fig. 2. Histomorphologic images stained with (A, B, ×200) H&E and (C, D, ×3,000; scale bar 1,000 nm) transmission electron
micro-scopic images in the myocardia in the (A, C) standard diet and (B, D) high-fat diet groups.
A B
C D
pared with the SD group (Fig. 3B).
mRNA expression levels of antioxidant enzymes
Increases in oxidative stress are coupled with reduced anti-oxi-dant species [21]. As shown in Fig. 3C, in the HFD group, the expression levels of anti-oxidant enzymes, such as Mn superox-ide dismutase (SOD) and peroxiredoxins (Prdx) 1, 2, and 5, were significantly decreased compared with those in the SD group.
Myocardial collagen and calcium cycling protein mRNA expression
The mRNA expression levels of collagen type I, α 1 (CO -L1A1), which mostly determines myocardial wall stiffness [22] were not increased in the HFD group compared with those in the SD group (Fig. 3D). The mRNA expression level of
sarco-endoplasmic reticulum calcium transport ATPase 2 (SERCA2), which is known to modulate calcium handling and cycling in myocardial contractility [22], was not decreased with HFD compared with that in the SD group (Fig. 3E).
Western blot analysis
In Western blot analysis (Fig. 4), GAPDH expression appeared to be similar between the two groups, and phosphorylated AKT ex-pression was decreased by 49% in the HFD group compared with the SD group (P=0.078). The protein expression of NDUFB5
(complex I), one of the OXPHOS subunits in the mitochondria, was 70% lower in the HFD group compared with the SD group, a difference that was significant (P<0.05). PGC1α protein ex
Fig. 3. The mRNA expression levels of a subset of oxidative phosphorylation (OXPHOS) subunits (A), PGC1α (B), antioxidant enzymes (C), Col1A1 (D), and SERCA2 (E) in the myocardia in the standard diet and high-fat diet groups. S, standard diet; H, high-fat diet;
NDUFB3, NADH dehydrogenase 1 β subcomplex, 3; NDUFB5, NADH dehydrogenase 1 β subcomplex, 5; NDUFV1, NADH dehydro -genase flavoprotein 1; NDUFS1, NADH dehydro-genase Fe-S protein 1; SDHB, succinate dehydro-genase complex, subunit B; CYC1,
cytochrome C1; SURF1, surfeit 1; PGC1α, peroxisome-proliferator-activated receptor γ, co-activator-1α; MnSOD, manganese-contain
-ing superoxide dismutase; Prdx1, peroxiredoxin 1; Prdx2, peroxiredoxin 2; Prdx5, peroxiredoxin 5; Col1A1, collagen, type I, α 1; SER -CA2, sarcoendoplasmic reticulum calcium transport ATPase 2. aP<0.05; bP<0.01.
Relative expression of
CYC1 gene (complex III)
1.4 1.2 1.0 0.8 0.6 0.4 0.2 0 S H
Relative expression of
SURF1 gene (complex IV)
1.8 1.6 1.4 1.2 1.0 0.8 0.6 0.4 0.2 0 S H
Relative expression of
SDHB gene (complex II)
1.4 1.2 1.0 0.8 0.6 0.4 0.2 0 S H
Relative expression of
NDUFB3 gene (complex I)
1.2 1.0 0.8 0.6 0.4 0.2 0 S H
Relative expression of
NDUFS1 gene (complex I)
1.4 1.2 1.0 0.8 0.6 0.4 0.2 0 S H
Relative expression of
NDUFB5 gene (complex I)
1.2 1.0 0.8 0.6 0.4 0.2 0 S H a
Relative expression of
NDUFV1 gene (complex I)
1.4 1.2 1.0 0.8 0.6 0.4 0.2 0 S H A C
Relative expression of
antioxidant enzyme genes
1.2 1.0 0.8 0.6 0.4 0.2 0
MnSOD Prdx1 Prdx2 Prdx5
a b a b
S H
D
Relative expression CollA1 gene
1.8 1.6 1.4 1.2 1.0 0.8 0.6 0.4 0.2 0
S H E
Relative expression of SERCA2 gene
2.0 1.8 1.6 1.4 1.2 1.0 0.8 0.6 0.4 0.2 0 S H
Relative expression of
Fig. 4. Western blot results (A) and relative expression of pAKT (B), NDUFB5 (C), and PGC1α (D) in the myocardia in the standard diet and high-fat diet groups. S, standard diet; H, high-fat diet; pAKT, phospho-Akt; AKT, a serine/threonine kinase, protein kinase B;
NDUFB5, NADH dehydrogenase 1-β subcomplex 5; PGC1α, peroxisome-proliferator-activated receptor γ, co-activator-1α; GAPDH,
glyceraladehyde-3-phosphate dehydrogenase. aP<0.05.
S H
pAKT
AKT
NDUFB5
PGC1α
GAPDH
A B
Relative expression of pAKT/AKT
200 180 160 140 120 100 80 60 40 20 0
S H
C
Relative expression of NDUFB5/GAPDH
3.5
3.0
2.5
2.0
1.5
1.0
0.5
0
S H
a
D
Relative expression of
PGC1
α
/GAPDH
2.5
2.0
1.5
1.0
0.5
0
S H
a
A
Mitochondrial DNA
copy number
4,500
4,000
3,500
3,000
2,500
2,000
1,500
1,000
500
0
S H
a
B
OD 450 nm
0.9
0.8
0.7
0.6
0.5
0.4
0.3
0.2
0.1
0
S H
a
C
A
TP
(nmol)
8.0
7.0
6.0
5.0
4.0
3.0
2.0
1.0
0
S H
a
Fig. 5. Mitochondrial DNA copy number (A), optical density of reactive oxygen species damage marker 8-OHdG (B), and ATP levels (C) in the myocardia in the standard diet and high-fat diet groups. S, standard diet; H, high-fat diet; 8-OHdG, 8-hydroxydeoxyguanosine; OD 450 nm, optical density of 8-OHdG as measured at 450 nm; ATP, adenosine triphosphate. aP<0.05.
Mitochondrial DNA copy number
mtDNA copy number, which reflects the content of mtDNA and is associated with mitochondrial biogenesis, was 46% low-er in the HFD group compared with the SD group, a difflow-erence that was significant (P<0.05) (Fig. 5A).
Oxidative stress damage markers
To investigate whether oxidative stress was increased in the HFD group, we measured oxidative stress damage markers such as 8-OHdG. There was a significant (P<0.05) increase in the expression of the oxidative stress damage marker 8-OHdG
(16% decrease by optical density OD 450 nm) in the HFD group compared with the SD group (Fig. 5B).
Myocardial ATP level
The level of myocardial ATP 78% lower in the HFD group compared with the SD group, a difference that was significant (P<0.05) (Fig. 5C).
DISCUSSION
diastolic dysfunction accompanied by increased ROS damage, decreased mtDNA content, decreased PGC1α, a decrease in the complex I, NDUFB5 of OXPHOS subunit, and decreased ATP levels without striking structural changes in the myocardium. These results were different to those data derived from 20 weeks [12] or 8 months [13] of HFD feeding in a mouse mod-el, and also, were different to an impaired systolic and diastolic function in high-sugar and HFD fed mice for 4 to 8 weeks [14]. Further researches are required to define the mechanism of the difference. Our data suggest that increased ROS damage and mitochondrial abnormality resulting in a reduction in ATP may potentially contribute to early contractile dysfunction without striking myocardial structural changes.
Obesity is well known to be related to cardiac morbidities such as coronary artery disease, hypertension, atrial fibrillation, and heart failure [4]. HFD-induced or over-nutrition-induced obesity may be a precipitating factor for the development of cardiomyopathy, which has been confirmed in several animal models [21,23,24], and in this study, HFD-induced obesity with excess body weight also demonstrated a decreased E/A ratio and increased DT for diastolic early filling (Table 3, Fig. 1), suggesting diastolic dysfunction compared with the SD group, as previously reported [5,6,21].
Thus, a constant fuel supply is required. Mitochondria are responsible for meeting the constant energy demands of the postnatal mammalian heart via oxidative phosphorylation (gene set as OXPHOS), and consistently, cardiac myocytes contain numerous mitochondria [23,25]. During metabolic dysfunction in obesity-associated cardiomyopathy, gene targets are associated with mitochondrial genes such as OXPHOS and PGC1α, a key metabolic regulator that coordinates the gene expression of pathways involved in mitochondrial biogenesis and respiratory function. PGC1α regulates the expression of several genes involved in the electron transport chain, mito-chondrial biogenesis, and fatty acid β-oxidation and glucose oxidative metabolism [19,26]. PGC1α acts as a crucial regula -tor of oxidative metabolism in cardiovascular disease [27]. PGC1α-null mice develop heart failure due to reduced mito -chondrial fatty acid OXPHOS in mito-chondrial energy metabo-lism [27]. In addition, ATP synthesis obtained during maximal respiration in permeabilized myocardial fibers was reduced in PGC1α-deficient mice. Previous studies demonstrating chang -es in mitochondrial number, structure and function in skeletal muscle in obesity support the direct association between obesi-ty and mitochondrial dysfunction in the myocardium [28,29]. In our study, structural changes in myocardial mitochondria in
HFD-induced obese rats with diastolic dysfunction were not significantly different compared with SD non-obese rats with-out diastolic dysfunction. However, there was a decreased mtDNA copy number, reduced PGC1α expression, reduced ex -pression of the OXPHOS subunit NDUFB5 and increased ex-pression of oxidative stress markers, which were subsequently, associated with decreased ATP levels. ATP is essential for myo-cardial relaxation and contraction, and the decreased myocar-dial ATP level might be considered an earlier step than changes in the myocardial structure in HFD-induced obese rats. In the present study, systolic dysfunction didn’t develop, although there was a decrease in myocardial ATP levels. We hypothe-sized that the development of systolic dysfunction might need additional myocardial abnormality beyond ATP supply in HFD-induced obese rats.
In previous studies, decreased calcium handling has been ex-amined as an earlier change in diastolic dysfunction [6,24]. In our study, there was no decrease in SERCA2 expression, sug-gesting no influence on the early stages of diastolic dysfunc-tion. The composition of collagen, which mainly determines the myocardial interstitial matrix of the LV, is important for the mechanical properties of LV walls [30]. In this viewpoint, in-creased collagen 1 correlates with LV stiffness, which occurs during diastolic dysfunction [31]. In our study, there was no de-crease in SERCA2 and no inde-crease in collagen 1, but there was mitochondrial dysfunction and a decreased ATP level.
mito-chondrial dysfunction and decreased ATP levels without myo-cardial structural changes develop, resulting in diastolic dys-function and evolving abnormalities over time, including in-creased interstitial fibrosis, hypertrophy and systolic dysfunc-tion, eventually leading to heart failure. HFD-induced mito-chondrial abnormality in myocardium might be one of systemic changes associated with HFD regardless of tissue.
This study has some limitations. First, there were no different micro- or macro-morphologic changes between the two groups. Second, activities of complexes of OXPHOS subunits and mi-tochondrial respiratory capacities were not examined. Thus we didn’t use the term, mitochondrial dysfunction. Instead, we used the term, mitochondrial abnormality. Third, the underlying mechanisms that were responsible for the decreased expression of PGC1α and OXPHOS subunit NDUFB5, as well as the de -creased mtDNA copy number, were not elucidated in this study. Fourth, we didn’t evaluate the levels of important metabolic pa-rameters or markers associated with mitochondrial function in other tissues such as adipose tissue, muscle and liver.
In conclusion, this study suggests that a decreased expres-sion of OXPHOS subunit NDUFB5 in complex I and PGC1α, as well as a decreased mtDNA copy number in the myocardia of 10 weeks-HFD-induced obese rats (consequently resulting in a reduction in ATP), may potentially contribute to diastolic dysfunction in early stage cardiomyopathy without striking myocardial structural changes.
CONFLICTS OF INTEREST
No potential conflict of interest relevant to this article was re-ported.
ACKNOWLEDGMENTS
This research was supported by grant from Eulji University in 2013 (13-11-12), Republic of Korea.
REFERENCES
1. Kenchaiah S, Evans JC, Levy D, Wilson PW, Benjamin EJ, Larson MG, et al. Obesity and the risk of heart failure. N Engl J Med 2002;347:305-13.
2. Powell BD, Redfield MM, Bybee KA, Freeman WK, Rihal
CS. Association of obesity with left ventricular remodeling and diastolic dysfunction in patients without coronary ar-tery disease. Am J Cardiol 2006;98:116-20.
3. Cote AT, Harris KC, Panagiotopoulos C, Sandor GG, Dev
-lin AM. Childhood obesity and cardiovascular dysfunction. J Am Coll Cardiol 2013;62:1309-19.
4. Aurigemma GP, de Simone G, Fitzgibbons TP. Cardiac re
-modeling in obesity. Circ Cardiovasc Imaging 2013;6:142-52.
5. Levin BE, Dunn-Meynell AA, Balkan B, Keesey RE.
Se-lective breeding for diet-induced obesity and resistance in Sprague-Dawley rats. Am J Physiol 1997;273(2 Pt 2):R725-30.
6. Wilson CR, Tran MK, Salazar KL, Young ME, Taegtmeyer
H. Western diet, but not high fat diet, causes derangements of fatty acid metabolism and contractile dysfunction in the heart of Wistar rats. Biochem J 2007;406:457-67.
7. Woods SC, Seeley RJ, Rushing PA, D’Alessio D, Tso P. A
controlled high-fat diet induces an obese syndrome in rats. J Nutr 2003;133:1081-7.
8. Larsson NG, Clayton DA. Molecular genetic aspects of hu -man mitochondrial disorders. Annu Rev Genet 1995;29:151-78.
9. Liu CS, Tsai CS, Kuo CL, Chen HW, Lii CK, Ma YS, et al.
Oxidative stress-related alteration of the copy number of mitochondrial DNA in human leukocytes. Free Radic Res 2003;37:1307-17.
10. Clay Montier LL, Deng JJ, Bai Y. Number matters: control of mammalian mitochondrial DNA copy number. J Genet Genomics 2009;36:125-31.
11. Johannsen DL, Ravussin E. The role of mitochondria in
health and disease. Curr Opin Pharmacol 2009;9:780-6.
12. Abdurrachim D, Ciapaite J, Wessels B, Nabben M, Luiken
JJ, Nicolay K, et al. Cardiac diastolic dysfunction in high-fat diet fed mice is associated with lipotoxicity without im-pairment of cardiac energetics in vivo. Biochim Biophys Acta 2014;1842:1525-37.
13. Sverdlov AL, Elezaby A, Behring JB, Bachschmid MM,
Luptak I, Tu VH, et al. High fat, high sucrose diet causes cardiac mitochondrial dysfunction due in part to oxidative post-translational modification of mitochondrial complex II. J Mol Cell Cardiol 2015;78:165-73.
14. Carbone S, Mauro AG, Mezzaroma E, Kraskauskas D,
Marchetti C, Buzzetti R, et al. A high-sugar and high-fat diet impairs cardiac systolic and diastolic function in mice. Int J Cardiol 2015;198:66-9.
15. Heaps CL, Tharp DL, Bowles DK. Hypercholesterolemia
arteri-oles. Am J Physiol Heart Circ Physiol 2005;288:H568-76.
16. Sahn DJ, DeMaria A, Kisslo J, Weyman A.
Recommenda-tions regarding quantitation in M-mode echocardiography: results of a survey of echocardiographic measurements. Circulation 1978;58:1072-83.
17. Litwin SE, Katz SE, Weinberg EO, Lorell BH, Aurigemma GP, Douglas PS. Serial echocardiographic-Doppler assess -ment of left ventricular geometry and function in rats with pressure-overload hypertrophy. Chronic angiotensin-con-verting enzyme inhibition attenuates the transition to heart failure. Circulation 1995;91:2642-54.
18. Sparks LM, Xie H, Koza RA, Mynatt R, Hulver MW, Bray GA, et al. A high-fat diet coordinately downregulates genes required for mitochondrial oxidative phosphorylation in skeletal muscle. Diabetes 2005;54:1926-33.
19. Mootha VK, Lindgren CM, Eriksson KF, Subramanian A, Sihag S, Lehar J, et al. PGC-1alpha-responsive genes in -volved in oxidative phosphorylation are coordinately down-regulated in human diabetes. Nat Genet 2003;34:267-73.
20. Sihag S, Cresci S, Li AY, Sucharov CC, Lehman JJ.
PGC-1alpha and ERRalpha target gene downregulation is a sig-nature of the failing human heart. J Mol Cell Cardiol 2009; 46:201-12.
21. Mandavia CH, Pulakat L, DeMarco V, Sowers JR.
Over-nu-trition and metabolic cardiomyopathy. Metabolism 2012;61: 1205-10.
22. Manrique C, DeMarco VG, Aroor AR, Mugerfeld I, Garro
M, Habibi J, et al. Obesity and insulin resistance induce early development of diastolic dysfunction in young female mice fed a Western diet. Endocrinology 2013;154:3632-42.
23. Bugger H, Abel ED. Mitochondria in the diabetic heart.
Cardiovasc Res 2010;88:229-40.
24. Duncan JG. Mitochondrial dysfunction in diabetic cardio
-myopathy. Biochim Biophys Acta 2011;1813:1351-9.
25. Palomer X, Salvado L, Barroso E, Vazquez-Carrera M. An
overview of the crosstalk between inflammatory processes and metabolic dysregulation during diabetic cardiomyopa-thy. Int J Cardiol 2013;168:3160-72.
26. Finck BN, Kelly DP. Peroxisome proliferator-activated
re-ceptor alpha (PPARalpha) signaling in the gene regulatory control of energy metabolism in the normal and diseased
heart. J Mol Cell Cardiol 2002;34:1249-57.
27. Finck BN, Kelly DP. PGC-1 coactivators: inducible regula
-tors of energy metabolism in health and disease. J Clin In-vest 2006;116:615-22.
28. Kelley DE, He J, Menshikova EV, Ritov VB. Dysfunction
of mitochondria in human skeletal muscle in type 2 diabe-tes. Diabetes 2002;51:2944-50.
29. Petersen KF, Dufour S, Befroy D, Garcia R, Shulman GI.
Impaired mitochondrial activity in the insulin-resistant off-spring of patients with type 2 diabetes. N Engl J Med 2004; 350:664-71.
30. Massie BM. Obesity and heart failure: risk factor or
mecha-nism? N Engl J Med 2002;347:358-9.
31. Matsubara LS, Matsubara BB, Okoshi MP, Cicogna AC,
Janicki JS. Alterations in myocardial collagen content af-fect rat papillary muscle function. Am J Physiol Heart Circ Physiol 2000;279:H1534-9.
32. Furukawa S, Fujita T, Shimabukuro M, Iwaki M, Yamada Y,
Nakajima Y, et al. Increased oxidative stress in obesity and its impact on metabolic syndrome. J Clin Invest 2004;114:1752-61.
33. Mari M, Morales A, Colell A, Garcia-Ruiz C,
Fernandez-Checa JC. Mitochondrial glutathione, a key survival anti-oxidant. Antioxid Redox Signal 2009;11:2685-700.
34. Sugamura K, Keaney JF Jr. Reactive oxygen species in
car-diovascular disease. Free Radic Biol Med 2011;51:978-92.
35. Colom B, Oliver J, Roca P, Garcia-Palmer FJ. Caloric re
-striction and gender modulate cardiac muscle mitochondrial H2O2 production and oxidative damage. Cardiovasc Res 2007;74:456-65.
36. Oh TS, Kwon EY, Choi JW, Choi MS, Yun JW.
Time-de-pendent hepatic proteome analysis in lean and diet-induced obese mice. J Microbiol Biotechnol 2011;21:1211-27.
37. Schmid GM, Converset V, Walter N, Sennitt MV, Leung
KY, Byers H, et al. Effect of high-fat diet on the expression of proteins in muscle, adipose tissues, and liver of C57BL/6 mice. Proteomics 2004;4:2270-82.
38. Jortay J, Senou M, Abou-Samra M, Noel L, Robert A,