Obesity Resistance and Enhanced Insulin
Sensitivity in
Ahnak
-/-
Mice Fed a High Fat
Diet Are Related to Impaired Adipogenesis
and Increased Energy Expenditure
Jae Hoon Shin1,2☯, Il Yong Kim1,2☯, Yo Na Kim1,2, Sun Mee Shin3, Kyung Jin Roh4, Seo
Hyun Lee1,2, Mira Sohn3, Soo Young Cho1,2, Sang Hyuk Lee5, Chang-Yong Ko6, Han-Sung Kim1,2, Cheol Soo Choi4, Yun Soo Bae3*, Je Kyung Seong1,2,7*
1Laboratory of Developmental Biology and Genomics, College of Veterinary Medicine, and BK21 Program for Veterinary Science, Seoul National University, Seoul, South Korea,2Korea Mouse Phenotyping Center (KMPC), Seoul National University, Seoul, South Korea,3Division of Life Sciences, Ewha Womans University, Seoul, South Korea,4Lee Gil Ya Cancer and Diabetes Institute and Division of Endocrinology Gil Medical Center, Gachon University of Medicine and Science, Incheon, South Korea,5Ewha Research Center for Systems Biology, Ewha Womans University, Seoul, South Korea,6Department of Biomedical Engineering, College of Health Science, Institute of Medical Engineering, Yonsei University, Wonju, South Korea,7Interdisciplinary Program for Bioinformatics, Program for Cancer Biology and BIO-MAX Institute, Seoul National University, Seoul, South Korea
☯These authors contributed equally to this work. *[email protected](JKS);[email protected](YSB)
Abstract
Objective
Recent evidence has suggested that AHNAK expression is altered in obesity, although its role in adipose tissue development remains unclear. The objective of this study was to determine the molecular mechanism by whichAhnakinfluences adipogenesis and glucose homeostasis.
Design
We investigated thein vitrorole of AHNAK in adipogenesis using adipose-derived mesen-chymal stem cells (ADSCs) and C3H10T1/2 cells. AHNAK-KO male mice were fed a high-fat diet (HFD; 60% calories from high-fat) and examined for glucose and insulin tolerances, for body fat compositions, and by hyperinsulinemic-euglycemic clamping. Energy expenditures were assessed using metabolic cages and by measuring the expression levels of genes involved in thermogenesis in white or brown adipose tissues.
Results
Adipogenesis in ADSCs was impaired in AHNAK-KO mice. The loss of AHNAK led to decreased BMP4/SMAD1 signaling, resulting in the downregulation of key regulators of adi-pocyte differentiation (P<0.05). AHNAK directly interacted with SMAD1 on thePparγ2
OPEN ACCESS
Citation:Shin JH, Kim IY, Kim YN, Shin SM, Roh KJ, Lee SH, et al. (2015) Obesity Resistance and Enhanced Insulin Sensitivity inAhnak-/-Mice Fed a High Fat Diet Are Related to Impaired Adipogenesis and Increased Energy Expenditure. PLoS ONE 10(10): e0139720. doi:10.1371/journal.pone.0139720
Editor:Makoto Makishima, Nihon University School of Medicine, JAPAN
Received:July 10, 2015
Accepted:September 16, 2015
Published:October 14, 2015
Copyright:© 2015 Shin et al. This is an open access article distributed under the terms of theCreative Commons Attribution License, which permits unrestricted use, distribution, and reproduction in any medium, provided the original author and source are credited.
Data Availability Statement:All relevant data are within the paper and its Supporting Information files.
promoter. Concomitantly, HFD-fed AHNAK-KO mice displayed reduced hepatosteatosis and improved metabolic profiles, including improved glucose tolerance (P<0.001),
enhanced insulin sensitivity (P<0.001), and increased energy expenditure (P<0.05), without undergoing alterations in food intake and physical activity.
Conclusion
AHNAK plays a crucial role in body fat accumulation by regulating adipose tissue develop-ment via interaction with the SMAD1 protein and can be involved in metabolic homeostasis.
Introduction
White adipose tissue (WAT) is important for maintaining energy balance, storing calories as lipids, and supplying energy sources following hormonal stimulation [1]. Recent findings sug-gest that blocking TGFβ/SMAD3 signaling protects mice from obesity and diabetes by regulat-ing glucose and energy homeostasis [2,3]. Evidence suggests that BMPs and TGFβ-pathway members involved in adipocyte differentiation and the SMAD family play important roles in BMP/TGFβsignaling [4–6]. Recently, we reported that AHNAK regulates cell growth by medi-ating TGFβ/SMAD3 signaling [7].
AHNAK, located on human chromosome 11q12–13, encodes a ~700-kDa protein initially identified in human neuroblastomas and skin epithelial cells [8–10]. The AHNAK scaffolding protein regulates several signal-transduction pathways, including those related to cytoskeletal structure formation, calcium homeostasis, and muscle regeneration and calcium signaling with protein kinase C (PKC) and phospholipase Cγ[11–14]. We previously reported that
AHNAK-KO mice are protected from diet-induced obesity, which was associated with differ-ences in urine and blood metabolomic profiles between HFD-fed wild-type and AHNAK-KO mice [15]. Liet al. also showed that AHNAK was upregulated in adipose tissues of diet-induced-obesity rat models [16]. However, the molecular mechanism of the action of AHNAK during adipose tissue development remains unclear.
Here, we investigated the molecular mechanism whereby fat accumulation was reduced by impaired adipocyte development in AHNAK-KO mice, which had improved metabolic pro-files. Therefore, this study demonstrated the role of Ahnak in adipogenesis and metabolic homeostasis through BMP4/SMAD1 signaling in adipocytes.
Materials and Methods
Experimental animals
All mice used in this study had a C57BL/6 background. AHNAK-KO mice were generated by disrupting exon 5 of theAhnakgene, as described [17]. AHNAK-KO (Ahnak-/-) mice were obtained by crossing heterozygous breeders. 6-week-old male KO and wild-type mice were fed either a regular chow (RC) diet or a high fat diet (HFD; 20% carbohydrate, 60% fat, 20% pro-tein; D12492; Research Diets Inc., New Brunswick, NJ, USA). Mice were maintained under a 12-h light-dark cycle and had free access to water in a specific pathogen-free barrier facility. Mice were randomly assigned. These procedures were approved by the Institutional Animal Care and Use Committee of Seoul National University (Permit Number: SNU-201004-14) in accordance with the Principles of Laboratory Animal Care (NIH publication no. 85–23, revised 1985).
Cell culture, reagents, and plasmids
Murine 3T3-L1 and C3H10T1/2 cells were kindly provided as a gift by Dr. Jae Woo Kim (Yon-sei University, Seoul, South Korea) [18,19]. Cells were differentiated into mature adipocytes as described [18], with modifications. Flag-Ahnak(N-terminal, amino-acid residues 1–150) and HA-Smad1[20] expression vectors were purchased from GeneCopoeia (Rockville, MD, USA) and Addgene, respectively. C3H10T1/2 cells were transfected directly with total of 4μg plasmid
DNA using Lipofectamine LTX with Plus reagent (Invitrogen, Carlsbad, CA, USA) according to the manufacturer's protocol. FlexiTube small interfering RNA (siRNA) directed against murineAhnakmRNA (accession no. NM_001039959) was from Qiagen. siRNA transfections were performed with Lipofectamine RNAiMAX (Invitrogen), according to the manufacturer’s protocol. AllStars Negative Control siRNA was obtained from Qiagen (Hilden, Germany).
Isolation and expansion of adipose-derived stem cells (ADSCs)
The establishment of wild-type (WT) and AHNAK-KO ADSCs isolated from epididymal and inguinal WATs of 8–10-week-old mice was described previously [21,22]. Briefly, adipose tissue was minced and digested with 0.75 mg/ml collagenase (Wako Pure Chemical Industries, Ltd., Osaka, Japan) for 2 h at 37°C. Cells were added to RBC lysis buffer (eBioscience, San Diego, CA) and filtered through a 100-μm cell strainer (BD Falcon, Franklin Lakes, NJ, USA) to
gen-erate single-cell suspensions. Cells were diluted to 1 × 10⁵cells/cm2in DMEM/F12 medium (Gibco, pH 7.4) containing 10% FBS and maintained in 5% CO2at 37°C.
Quantitative real-time PCR (qPCR) analysis
Total RNA was isolated using the Total RNA Purification System (Invitrogen) following the manufacturer’s protocol. qPCR was performed with SYBR Green dye using an ABI Step One Real-Time PCR instrument (Applied Biosystems, Cheshire, U.K.). For relative quantification of gene expression, we used theΔΔCt method. Results were normalized to expression of the control gene36B4. Primers were designed according to published complementary DNA or genomic sequences. The primer sequences are shown inS1 Table.
Immunoblotting and immunoprecipitation experiments
Metabolic assays
For glucose-tolerance tests (GTTs), mice were fasted for 16 h and injected intraperitoneally with 1.5 mg of glucose/g of body weight. For insulin-tolerance tests (ITTs), mice were fasted for 6 h and injected intraperitoneally with insulin (Humulin R; Eli Lilly, Indianapolis, IN) at 1 unit/kg of body weight.
Basal study
A comprehensive animal metabolic monitoring system (CLAMS; Columbus Instruments, Columbus, OH) was used to evaluate activity, food consumption, and energy expenditure before and after HFD feeding. Energy expenditure and food intake data were normalized with respect to lean body weight. Energy expenditure and RQ were calculated from the gas exchange data.
Body composition
Fat and lean body masses were assessed by1H magnetic resonance spectroscopy (Bruker BioS-pin, Billerica, MA) before and after mice were subjected to an HFD.
Immunofluorescence
ADSCs were grown on chamber slides and exposed to BMP4 for 1 hour. Cells were fixed and then permeabilized in 0.25% Triton-X 100 at room temperature for 10 min. After washing with PBS, the cells were blocked with 10% normal goat serum. For nuclear staining, the samples were incubated with DAPI (Vector Laboratories). Images were captured using a confocal microscope system (LSM 710, Carl Zeiss, Germany).
Hyperinsulinemic-euglycemic clamp study
Seven days prior to performing hyperinsulinemic/euglycemic clamp studies, indwelling cathe-ters were placed in the right internal jugular vein extending to the right atrium. To estimate insulin-stimulated whole-body glucose fluxes, [3-3H] glucose was infused throughout the clamps at a rate of 0.1μCi/min, and 2-deoxy-D-[1-14C] glucose (2-[14C]DG; Perkin Elmer)
was injected after 85 min following clamping to estimate the rate of insulin-stimulated tissue glucose uptake, as described [23].
Glucose flux calculations
Whole-body glycolysis was calculated as the rate of increase in the plasma [3H]2O concentra-tion divided by the specific activity of plasma [3H] glucose, as described [24]. Whole-body gly-cogen synthesis was estimated by subtracting whole-body glycolysis from whole-body glucose uptake, assuming that glycolysis and glycogen synthesis account for the majority of insulin-stimulated glucose uptake [25].
Statistics
Results
Ahnak-KO mice are resistant to diet-induced obesity and had reduced
adiposity
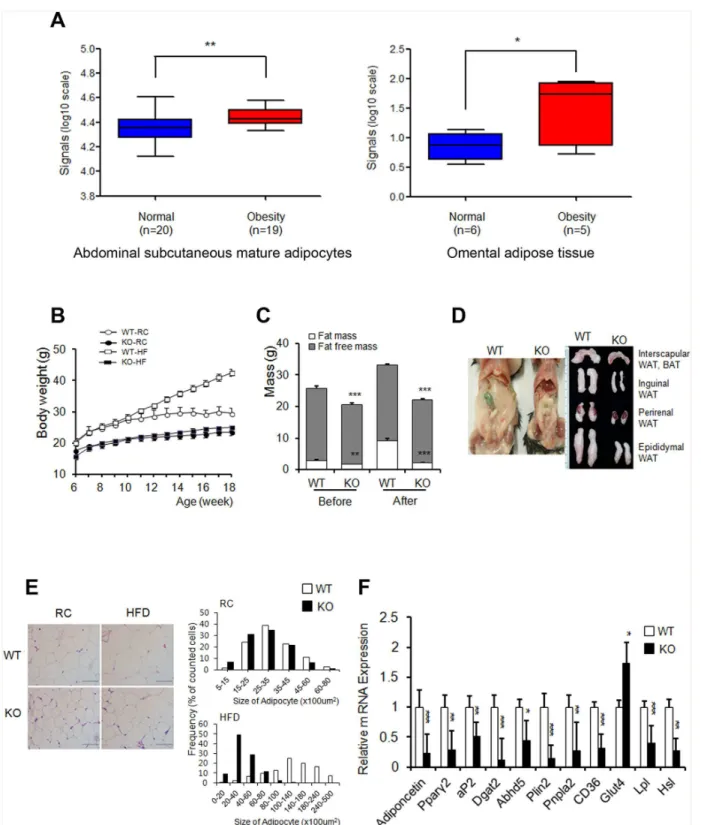
To study the potential correlation between AHNAK expression and obesity in humans, we analyzed existing GEO data. AHNAK expression was significantly increased in both subcuta-neous mature adipocytes (GDS 1495,P<0.01) and omental adipose tissues (GDS 3688,
P<0.05) from obese subjects (Fig 1A). The tissue distribution of AHNAK was examined in
C57BL/6 mice by qPCR analysis.AhnakmRNA was abundantly expressed in eWAT, brown adipose tissue (BAT), heart tissue, and lung tissue (S1A Fig). To elucidate the physiological role of AHNAKin vivo, we maintainedAhnak-KO,Ahnak+/-(hetero) mice, and WT littermates. No differences in body weights were observed between WT andAhnak+/-mice (S1B Fig). How-ever, AHNAK-KO mice weighed less than WT mice at 6 weeks (S1C Fig). At 18 weeks of age, KO mice had gained markedly less weight, compared to the WT controls fed either RC or an HFD (Fig 1Band see alsoS1C Fig). We next analyzed the body composition of WT and KO mice. We observed a significant increase in the fat-to-body ratio in WT mice, but virtually no change in KO mice after an HFD (Fig 1C). Consistently, the major fat pads of KO mice were significantly smaller than those of WT mice (Fig 1D). Micro-CT results revealed that the total fat volume in the abdominal area of KO mice decreased (S1D Fig). Adipocytes in KO mice con-tained a higher frequency of small adipocytes and a lower frequency of mid- and large-sized adipocytes than their WT counterparts (Fig 1E).
In agreement, the expression of adipogenic-related genes such asPparγ2, a key regulator of adipogenesis;aP2, a late adipocyte differentiation marker; and adiponectin, were reduced in eWAT from HFD-fed KO mice compared to WT mice. Furthermore, the expression of genes related to lipid metabolism, includingDgat2,Plin2,Cd36,Lpl, andHslwas significantly decreased in eWATs from HFD-fed KO mice (Fig 1F). In contrast, minor differences in adipo-nectin,Lpl, andHslexpression occurred in RC-fed mice (S1E Fig).
Because KO mice displayed significantly decreased fat mass, we examined the liver as a sec-ondary fat-storage organ. The ratios of liver-to-body weight between KO and WT mice were not significantly different, even though the KO livers were lighter than WT livers fed on either RC or an HFD (S2A Fig). Hepatic triglyceride and free fatty acid (FFA) levels decreased in KO mice (S2B Fig). In agreement, HFD-fed KO mice displayed reduced hepatic fat accumulation and protection against hepatosteatosis (S2C Fig). These findings indicated that AHNAK KO mice were protected from diet-induced obesity and fat accumulation, consistent with the reduced expression of lipogenic genes, which are not lipodystrophic.
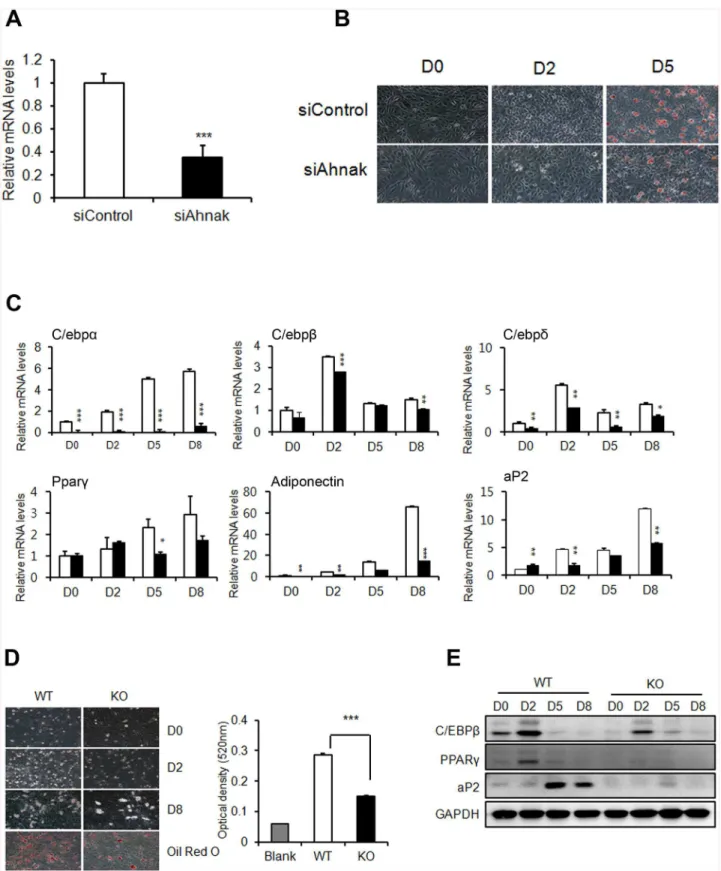
Requirement of Ahnak for adipocyte differentiation
in vitro
Fig 1.Ahnak-KO mice displayed reduced adiposity.(A) AHNAK expression of obese human subjects. (B) Changes in body weights during 12 weeks of feeding on RC or an HFD;n= 3 for WT and KO mice on regular chow diet (RC),n= 4 for WT and KO mice on HFD. (C) Body-composition changes in mice after 4 weeks on an HFD; WT:n= 6, KO:n= 5. (D) Representative pictures of fat pads from mice fed an HFD. (E) H&E staining (left) of eWAT and distribution of adipocyte sizes (right);n= 3 Scale bar, 200μm. (F) Relative mRNA levels of the indicated genes in WATs were measured by qPCR. Values were
normalized to36B4. WT:n= 5, KO:n= 8 (F). The data shown are the mean±SEM.*P<0.05,**P<0.01,***P<0.001 between WT and KO mice. eWAT,
epididymal white adipose tissue.
Fig 2. AHNAK plays a role in adipogenesisin vitro.(A) C3H10T1/2 cells were transfected with control siRNA andAhnaksiRNA. (B) C3H10T1/2 cells underwent adipocyte differentiation, as determined by oil red O staining. (C) Expression levels of adipogenic genes were measured by qPCR. All genes were normalized to36B4. (D) Representative pictures showing differentiated ADSCs stained with oil red O at day 8 after the induction of differentiation. (E) Immunoblot analysis of adipogenic proteins from differentiated cells. GAPDH was used as a loading control.
siRNA (S3C Fig). Thus, AHNAK expression in the SVF in WAT may explain the low efficiency of mature adipocyte differentiation observed in AHNAK-deficient mesenchymal stem cells and the reduced adiposity of AHNAK KO mice.
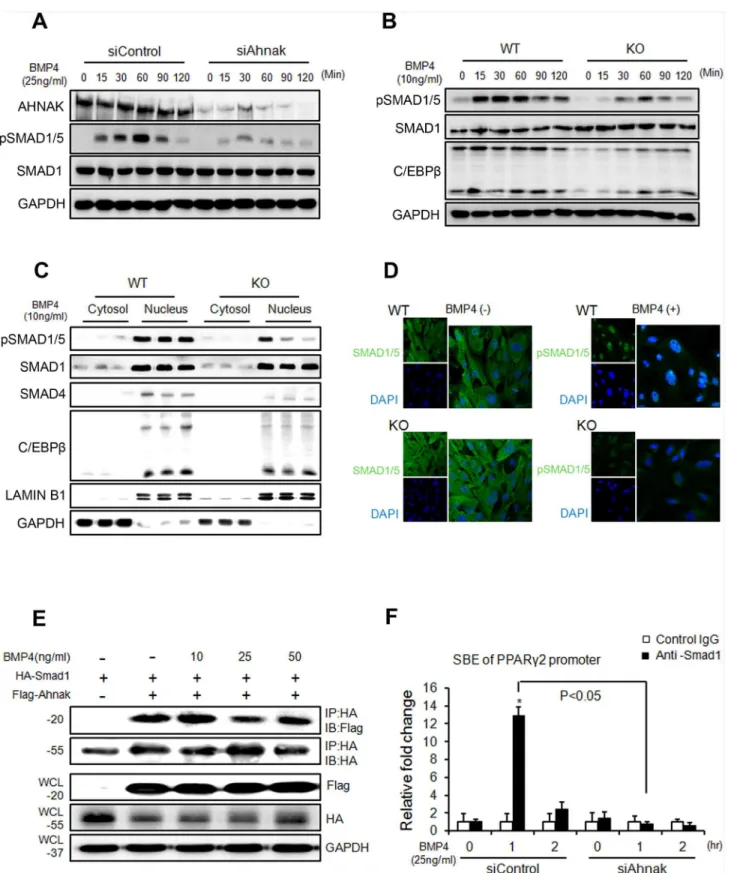
AHNAK is required for SMAD1/5 activation, which is essential for
BMP4-dependent adipogenic differentiation
BMP signaling induces the commitment of mesenchymal stem cells into preadipocytes [9,26]. SMAD1/5/8 phosphorylation is critical for BMP4-mediated transcriptional regulation and sub-sequent commitment to adipocyte differentiation9. Thus, we examined whether AHNAK is required for BMP4 signaling. Control C3H10T1/2 cells and ADSCs treated with recombinant BMP4 showed increased SMAD1/5 phosphorylation in a time-dependent manner (Fig 3A and 3B). However, in AHNAK-deficient C3H10T1/2 cells and ADSCs, BMP4-induced SMAD1/5 phosphorylation was repressed (Fig 3A and 3B). Importantly, nuclear pSMAD1/5 transloca-tion occurred following BMP4 treatment in WT ADSCs, but not in KO ADSCs (Fig 3C and 3D). AHNAK protein is also translocated into nucleus following BMP4 stimulation (S4 Fig). In addition, the expression of SMAD4, a co-SMAD that binds to R-SMADs such as SMAD1/5/8 to form an active SMAD complex, was suppressed in AHNAK-KO ADSCs after BMP4 treat-ment, compared to that in WT ADSCs. The early adipogenic transcription factor C/EBPβ showed a similar trend in terms of expression (Fig 3C). Our data suggested that the AHNAK protein potentiates BMP4 signaling by interacting with SMAD1. To study this potential inter-action, Flag-Ahnakand HA-Smad1expression vectors were co-transfected into C3H10T1/2 cells and subjected to co-immunoprecipitation with an anti-HA antibody. The transfection of Flag-Ahnakexpressed vector had no effect on cell viability (S5A Fig). These results indicated that AHNAK interacted with SMAD1 in a BMP4-independent manner (Fig 3E). Moreover, a proximity ligation assay (PLA) using AHNAK and SMAD1 probes showed that AHNAK-S-MAD1 complexes were detected as fluorescent spots, both in BMP4-treated and vehicle-con-trol cells (S5B Fig). BMP2/4-SMAD signaling induced adipogenic commitment, which regulates PPARγexpression [5,27]. Importantly, Ahnak deficiency causes decreased PPARγ2 expression (Figs1and2). We thus evaluated the effects of AHNAK on SMAD1-dependent
Pparγ2transcriptional regulation using a chromatin immunoprecipitation (ChIP) assay. The ChIP complex detected with an anti-SMAD1 antibody revealed significantly increased associa-tion with the Smad-binding element (SBE) in thePparγ2promoter following BMP4 treatment in control siRNA-transfectants. However,Ahnak-downregulated cells did not exhibit a SMAD1-boundPparγ2promoter DNA fragment (Fig 3F). These results indicate that AHNAK is required for SMAD1 activation and SMAD1 binding to thePparγ2promoter.
Ahnak
-KO mice exhibit enhanced glucose tolerance and increased
systemic insulin sensitivity
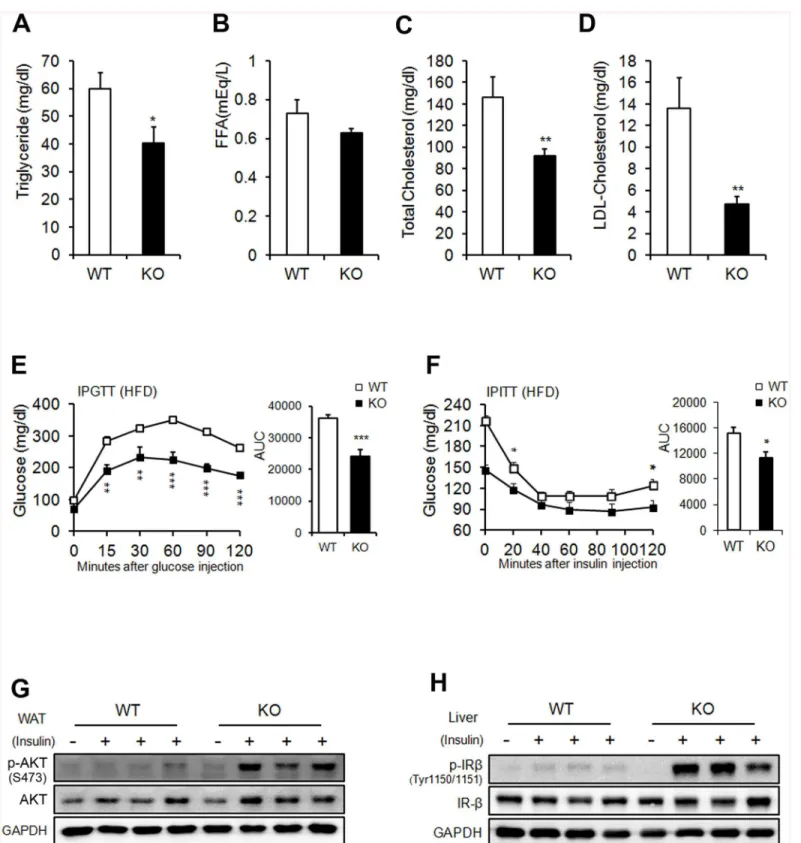
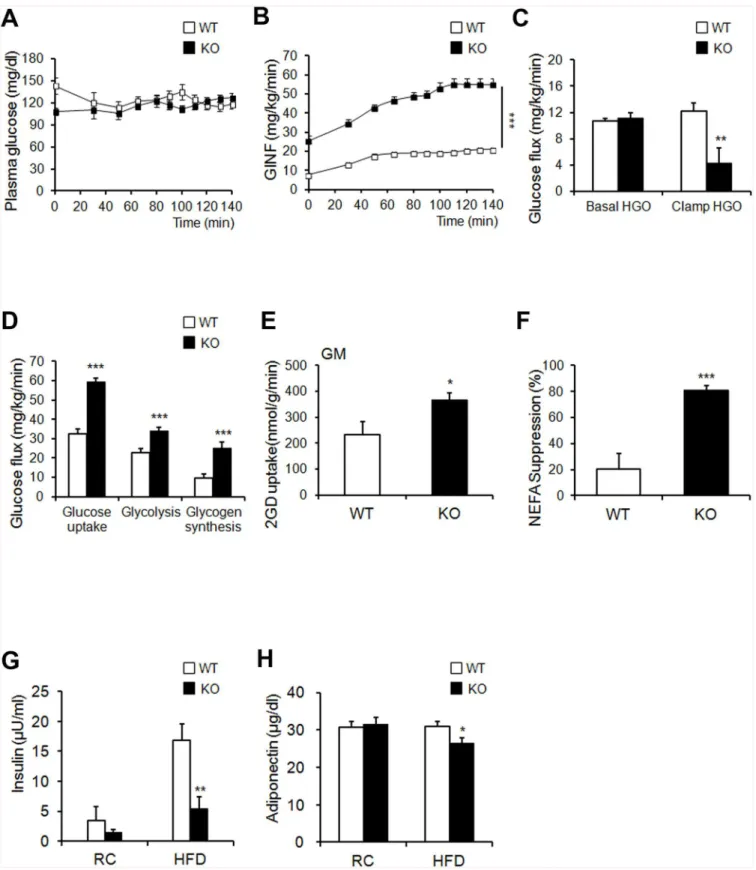
Flag-glucose metabolism in KO mice. The phospho-AKT levels in WAT, BAT, and gastrocnemius muscle, and phospho-IRb levels in liver increased in HFD-fed KO mice after insulin stimula-tion (Fig 4G and 4Hand see alsoS6C and S6D Fig). Interestingly, Glut4 mRNA was increased in eWAT from HFD-fed KO mice (Fig 1F). These results are consistent with previous studies that overexpression of human GLUT4 prevented the obesity-induced hyperinsulinemia and downregulation of GLUT4 in adipose tissue caused insulin resistance in mice [28,29]. Never-theless, int remains to be investigated whether Ahnak regulates translocation of GLUT4 to plasma membrane upon insulin stimulation. Taken together, these results indicated that AHNAK-deficiency caused reduced adiposity and increased glucose tolerance and insulin sensitivity.
Next, we utilized a hyperinsulinemic/euglycemic clamp, enabling accurate determinations of insulin-dependent glucose uptake effectsin vivo. First, during hyperinsulinemia, the glu-cose-infusion rate necessary to maintain euglycemia was higher in KO mice than in WT mice, indicating that insulin-stimulated glucose uptake and metabolism were active in KO mice (Fig 5A and 5B). Second, we tested whether hyperglycemia could result from elevated liver gluco-neogenesis. Hepatic glucose output was lower in KO mice than in the WT control in the clamped condition (Fig 5C). The third possible explanation for hyperglycemia is decreased insulin-dependent glucose uptake into peripheral tissues. The glucose uptake, glycolysis, and glycogen synthesis were markedly higher in KO mice than in WT mice (Fig 5D). Insulin-stim-ulated 2-DG uptake in skeletal muscle was significantly increased in KO mice (Fig 5E). FFA suppression increased after insulin stimulation in KO mice (Fig 5F). The fasting insulin levels of HFD-fed KO mice were significantly decreased (Fig 5G). Thus, improved insulin sensitivity caused suppression circulating FFA levels in KO mice during clamp condition. Changes in pokine secretion are correlated with several metabolic disorders [30]. Unexpectedly, serum adi-ponectin, which is inversely correlated with adipose tissue mass, was decreased in KO mice (Fig 5H). Collectively, these results indicate that KO mice showed enhanced peripheral insulin sensitivity and increased glucose metabolism, with activated insulin signaling cascades in the liver, muscle tissue, and adipose tissue, particularly when challenged by an HFD.
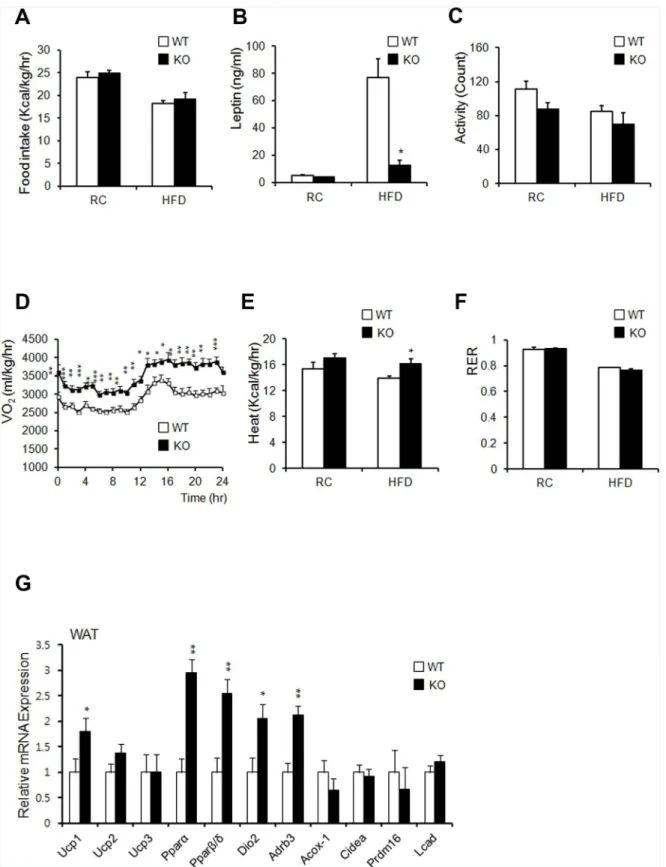
AHNAK-KO mice show increased energy expenditure
Changes in body weights often correlate with energy-balance alterations. The amount of calorie uptake/h in both RC- and HFD-fed mice was unaltered when normalized to body weight (Fig 6A). Serum leptin levels decreased in HFD-fed KO mice, despite their similar food intake (Fig 6B). These data suggested that leptin sensitivity was enhanced in KO mice and that the reduc-tion in leptin levels in KO mice resulted from a reducreduc-tion in fat mass, as leptin levels are associ-ated with fat mass [31]. Despite similar food intake levels between the two groups, KO mice showed greater leanness and resistance to HFD-induced obesity (Fig 1B). We thus hypothe-sized that KO mice have an increased metabolic rate or physical-activity rate. KO mice showed a slightly decreased level of activity (Fig 6C). Oxygen consumption and heat generation in KO mice were significantly increased compared to those of WT controls (Fig 5D and 5E). The RER remained unchanged in both groups (Fig 5F).
To confirm the effect of AHNAK ablation in WAT and BAT, we analyzed thermogenic gene expression profiles by qPCR. We observed a significant increase in the expression of
PparαandPparβ/δ. We also detected increased expression ofUcp1,Dio2, andAdrb3in WAT
Ahnakand HA-Smad1, after which the cells were incubated without or with BMP4 for 60 min. (F) DNA-protein complexes from C3H10T1/2 cells were immunoprecipitated with an anti-SMAD1 antibody or a control IgG. Enrichment of the DNA fragment containing SMAD-binding sites on thePparγ2promoter was evaluated by qPCR.
Fig 4. Metabolic parameters.(A) Serum triglyceride. (B) FFA. (C) Total cholesterol. (D) LDL-cholesterol in WT and KO mice on an HFD. Serum levels were measured after a 16-h fasting period;n= 9/group (a-d). (E) Glucose tolerance after an 8-week HFD;n= 9 for WT and n = 6 for KO mice. (F) Insulin tolerance after an 8-week HFD;n= 6 for WT and n = 6 for KO mice. (G, H) Insulin signaling pathway in WAT (G) and liver (H). The data shown are the mean±SEM. *P<0.05,**P<0.01,***P<0.001 between WT and KO mice.
Fig 5.AhnakKO mice exhibit enhanced glucose tolerance and insulin sensitivity.(A, B) Blood glucose levels during the hyperinsulinemic-euglycemic clamp. Glucose levels required to maintained euglycemia in both mice (A). Glucose infusion rate (GINF) during clamp studyAhnak-KO mice exhibited enhanced: the clamp study (B). (C) Insulin-mediated suppression of hepatic glucose output. (D) Whole-body glucose flux calculation (peripheral insulin sensitivity). (E) Insulin-stimulated 2-DG uptake in gastrocnemius muscle. (F) Suppression of plasma FFA levels during the clamp procedure; n = 7/group (A–
from HFD-fed KO mice (Fig 5G). These results suggested that uncoupled respiration and oxi-dation may contribute to increased oxygen consumption, which could cause resistance to diet-induced obesity in KO mice. Histologic evaluation of BAT displayed slightly reduced lipid-droplet accumulation in KO mice, compared to that in WT mice fed either RC or an HFD (S7A Fig). However, the BAT weights between the two groups were comparable (S7B Fig). The expression ofUcp3,Pparα,Pparβ/δ,Acox-1, andDio2increased despite the unaffected levels of
Ucp1in BAT of KO mice, compared to that of WT mice (S7C Fig). These results suggested that increased energy expenditure resulting from mitochondrial uncoupling in WAT of KO mice contributed to the resistance to diet-induced obesity.
Discussion
The physiological functions of AHNAK in adipose tissues have been unclear, although AHNAK is highly expressed in WAT (S1A Fig). Here, we provide evidence that AHNAK acts as a critical regulator of adipogenesisin vitroandin vivo. Studies on the role of Ahnak in adi-pose tissue have reported conflicting results. Alli and coworkers claimed that decreased AHNAK1 expression observed during adipocyte differentiation in 3T3-L1 cells indicated that AHNAK negatively regulates adipogenesis [32]. In contrast,Ahnakgene expression was increased 6-fold in adipose tissue during early-phase obesity in rats [16]. Previous findings have demonstrated elevated AHNAK levels in WAT from mice with genetically or environ-mentally induced obesity [16,33]. Consistent with previous murine-model studies, AHNAK expression significantly increased in the fat tissues of obese human subjects (Fig 1A).
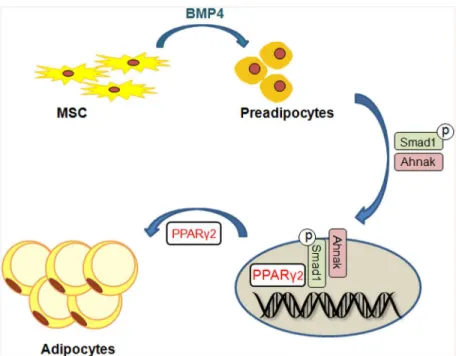
Loss of Ahnak resulted in lowered fat-cell formation due to suppressed SMAD1/5 phos-phorylation and nuclear translocation. Our results indicated that AHNAK regulates adipocyte differentiation by modulating BMP-induced canonical SMAD signaling. SMAD1 inactivation in AHNAK-deficient ADSCs led to impairedPparγ2transcription. Our data indicate that AHNAK is required for adipocyte differentiation via SMAD1 binding to thePparγ2promoter following BMP4 stimulation (Fig 7). Similar to AHNAK, SCHNURRI-2 interacts with SMAD1 and controls adipogenesis throughPparγ2transcriptional activation [34]. However, the possi-bilities underlying AHNAK involvement in regulation of the nuclear translocation or stability of pSMAD1 remain to be determined. Although additional studies are also required to eluci-date the function of AHNAK-dependent SMAD1 signaling in adipose hypertrophyin vivo, previous evidence has shown that BMP/SMAD signaling promotes adiposity by Tob2 expres-sion in mice [35].
Adipose tissue is composed of adipocytes and the stromal vascular fraction, which contains preadipocytes, mesenchymal stem cells, endothelial cells, and macrophages [36]. Adipocyte precursor cells in the stromal vascular fraction are capable of differentiation into mature adipo-cytes [37]. BMPs have crucial roles in cell fate-determinations of multipotent mesenchymal stem cells [38]. BMPs regulate gene expression ofRunx2,Pparγ2,Sox9, andMyoD, which are master regulators of lineage determination that control embryogenesis and organogenesis [39– 44]. Together, these findings imply that AHNAK present in the stromal vascular fraction of adipose tissue may explain the decreased AHNAK levels observed during adipogenesis, as well as the restricted adipogenic commitment and differentiation in AHNAK-KO mice. However, it remains unclear how AHNAK controls BMP4/SMAD1 signaling during mesenchymal differ-entiation into other cell types, such as the osteogenic, chondrogenic, and myogenic lineages. Furthermore, it would be interesting to determine whether AHNAK regulates BMP4 signal
n= 8 for KO mice on RC,n= 7 for WT andn= 9 for KO mice on HFD. The data shown are the mean±SEM.*P<0.05,**P<0.01,***P<0.001 between WT
and KO mice.
Fig 6.Ahnak-KO mice display increased energy expenditure.(A) Food intake (WT:n= 6, KO:n= 5). (B) Serum leptin concentrations (n = 4). (C) Measurement of locomotor activity (WT:n= 6, KO:n= 5). (D) Whole-body oxygen consumption (VO2) over the course of 24 h (WT:n= 6, KO:n= 5). (E) Average value of heat generation (WT:n= 6, KO:n= 5). (F) The respiratory exchange rate was calculated as CO2production/O2consumption (WT:n= 6, KO:n= 5). (G) Relative mRNA expression of genes involved in energy dissipation and in brown adipose-specific genes in WAT, as measured by qPCR (n= 6). Values were normalized to36B4expression. The data shown are the mean±SEM;*P<0.05,**P<0.01,***P<0.001.
transduction via other inhibitory mechanisms such as BMP receptors, I-SMAD (SMAD6/ SMAD7), or ubiquitination.
Previous studies reported that AHNAK activates PLC-γ1-PKCa and contributes to mito-genic signaling in response to growth factors [12,17]. The AHNAK protein controls cell cycle progression through c-MYC, which is highly expressed in AHNAK -deficient MEF cells [7]. Cell proliferation, arrest, cell-cycle re-entry, and differentiation by hormonal stimulation are crucial processes during adipogenesis [45]. Consistently, increased levels of c-MYC lead to the inhibition of adipocyte differentiation by blocking cell cycle arrest in 3T3-L1 cells [46,47]. Therefore, it would be interesting to uncover the link between AHNAK and c-MYC in 3T3-L1 cells, which are committed to an adipogenic lineage.
While we focused on the role of AHNAK in adipogenesis, our data also implicate AHNAK in energy and glucose homeostasis. Recent evidence showed that AHNAK expression inversely correlates with oxygen consumption [48]. Whole-body oxygen consumption and energy expenditure were significantly elevated in HFD-fed KO mice accompanied by increased levels of thermogenesis-related genes (Ucp1,Dio2, andAdrb3) and oxidation-related genes (Pparα
andPparβ/δ) in WAT, but no difference was found in BAT, which mainly controls heat gener-ation. Adiposity influences systemic insulin resistance [49]. Here, we demonstrated that AHNAK KO mice are protected against HFD-induced insulin resistance, with reduced fat accumulation. A recent study showed that mice lacking AHNAK were glucose intolerant [33], and we also found that HFD-fed AHNAK-KO mice displayed markedly lower fasting insulin levels (Fig 5G). This reduction suggests that the increased glucose tolerance in AHNAK-KO mice was attributable to insulin sensitivity. Furthermore, our hyperinsulinemic/euglycemic clamp experiments revealed that HFD-fed AHNAK-KO mice displayed increased insulin-mediated suppression of hepatic glucose output, with higher glucose uptake in the peripheral tissues. In this regard, AHNAK deficiency also resulted in significantly improved glucose-dis-posal rates with a robust increase in insulin signaling in target tissues. These results may have Fig 7. Putative model for the role ofAhnakin Smad1-dependent induction of PPARg2 by BMP signaling.
been due to a difference in the fat contents of the diets. The authors performed their experi-ments with a lower fat-containing diet than was employed in the current study. Another possi-bility is that the mice had a different genetic background, which can influence metabolism in mice [50]. While our mutant mice were derived from a C57BL/6 background, their mice origi-nated from BDF1, a cross between female C57BL/6 and male DBA/2. Because BDF1 mice are prone to develop obesity-induced diabetes more than B6 mice [51], our mutant mice could dis-play better glucose tolerance and greater responsiveness to insulin.
Results from this study demonstrated that AHNAK downregulation protects mice from obesity, hepatosteatosis, and insulin resistance. Furthermore, although AHNAK is implicated in the regulation of energy metabolism and glucose homeostasis, further studies are needed to determine the molecular mechanism whereby AHNAK regulates energy metabolism. We can-not exclude the possibility that AHNAK may influence other tissues or mouse development because we used mice carrying the null mutation. In particular, studying tissue-specific AHNAK inactivation will likely be useful in that indirect effects may be involved in the overall regulation of adiposity and energy metabolism. Moreover, it should be determined whether AHNAK overexpression contributes to aggravated obesity and metabolic homeostasis.
Collectively, our data show that AHNAK promotes adipose tissue development and obesity by potentiating BMP4/SMAD1 signaling and that AHNAK can serve as a novel regulator of metabolic homeostasis. Our data thus expand the current knowledge regarding the early deter-mination of adipose tissue development and highlight a potential indication for treating obe-sity-associated metabolic disorders.
Supporting Information
S1 Fig. Physiological characteristics ofAhnakKO mice.(A) Ahnak expression in various
tis-sues from 6-week-old C57BL6 mice (n = 4–6). Values were normalized to Gapdh. (B) Compar-ison of body weights from wild type (Ahnak+/+) and hetero (Ahnak+/-) mice (n = 3). (C) Body weights of WT and KO mice at various ages. (D) Representative pictures of micro-CT showing abdominal cross-sections, where the white arrows indicate fat. (E) Relative mRNA levels of the indicated genes in WAT of RC-fed mice were measured by qPCR. Values were normalized to
36B4. The data shown are the mean±SEM,P<0.05,P<0.01,P<0.001.
(TIF)
S2 Fig.AhnakKO mice are protected from hepatic steatosis-induced by an HFD.(A)
Quan-tification of liver weights. (B) Quantification of liver triglycerides and FFAs in mice. (C) Repre-sentative pictures of H&E and oil red O staining of liver sections. The data shown are mean ±SEM, n = 3–5.P<0.05,P<0.01,P<0.001 between WT and KO mice.
(TIF)
S3 Fig. Loss of Ahnak inhibits adipocyte differentiationin vitro.(A) mRNA expression of
Ahnak in the adipocyte fraction (Ad) and stromal vascular fraction (SVF) of eWATs (n = 4). (B) mRNA expression of Ahnak during adipogenesis in 3T3-L1 cells. (C) 3T3-L1 cells were transfected with siRNA before differentiation induction and subsequently stained with oil red O.
(TIF)
S4 Fig. The subcellular localizations of Ahnak in C3H10T cells.DAPI indicates nuclear staining.
S5 Fig. Interaction between Ahnak and Smad1.(A) Cell viability following transfection of Flag Ahnak expressed vector in C3H10T cells. (B) The Ahnak-Smad1 complexes were detected as spots in situ Duolink PLA. Nuclear material was stained by DAPI. The data shown are the mean±SEM,P<0.05,P<0.01,P<0.001 vs Mock.
(TIF)
S6 Fig. Insulin signaling.(A) Glucose tolerance after feeding on RC; WT:n= 6, KO:n= 4. (B) Insulin tolerance after of feeding on RC; WT:n= 4, KO:n= 6. The data shown are the mean±SEM,P<0.05,P<0.01,P<0.001 between WT and KO mice. (CandD) Insulin
signaling pathway in BAT (C) and gastrocnemius muscle (GM) (D) after an 8-week HFD. (TIF)
S7 Fig. Phenotypic characteristics of BAT.(A) H&E staining of BAT. Scale bar, 200μm; (B)
Quantification of BAT mass (left) and BAT mass normalized by body mass (right); WT:n= 5, KO: n = 4. (C) Relative mRNA expression involved in energy dissipation and brown adipose specific genes in BAT measured by qPCR from mice fed an HFD for 12 weeks (n = 6). Values were normalized to36B4expression. The data shown are mean±SEM;P<0.05,P<0.01,
P<0.001.
(TIF)
S8 Fig. Full unedited blots used in figures.Prestained Protein Marker (GenDEPOT, TX, USA) was used as a size marker. Therefore it is not visible in images obtained by CCD camera. (TIF)
S1 Table. Sequences of primers used for real-time PCR.
(DOCX)
Acknowledgments
We are grateful to Jae Woo Kim (Yonsei University) for providing 3T3-L1 and C3H10T1/2 cells.
Author Contributions
Conceived and designed the experiments: JHS IYK JKS. Performed the experiments: JHS IYK YNK KJR Seo Hyun L. CYK. Analyzed the data: JHS YNK CYK CSC SYC Sang Hyuk L. Con-tributed reagents/materials/analysis tools: SMS MS HSK CSC YSB. Wrote the paper: JHS IYK JKS.
References
1. Rosen ED, Spiegelman BM (2006) Adipocytes as regulators of energy balance and glucose homeosta-sis. Nature 444:847–853. PMID:17167472
2. Yadav H, Quijano C, Kamaraju AK, Gavrilova O, Malek R, Chen W, et al. (2011) Protection from obesity and diabetes by blockade of TGF-b/Smad3 signaling. Cell Metab 14:67–79. doi:10.1016/j.cmet.2011. 04.013PMID:21723505
3. Tan CK, Leuenberger N, Tan MJ, Yan YW, Chen Y, Kambadur R, et al. (2011) Smad3 deficiency in mice protects against insulin resistance and obesity induced by a high-fat diet. Diabetes 60:464–476.
doi:10.2337/db10-0801PMID:21270259
4. Rosen ED, MacDougald OA (2006) Adipocyte differentiation from the inside out. Nat Rev Mol Cell Biol 7:885–896. PMID:17139329
5. Huang H, Song TJ, Li X, Hu L, He Q, Liu M, et al. (2009) BMP signaling pathway is required for commit-ment of C3H10T1/2 pluripotent stem cells to the adipocyte lineage. Proc Natl Acad Sci U S A
6. Zamani N, Brown CW (2011) Emerging roles for the transforming growth factor-βsuperfamily in regulat-ing adiposity and energy expenditure. Endocr Rev 32:387–403. doi:10.1210/er.2010-0018PMID: 21173384
7. Lee IH, Sohn M, Lim HJ, Yoon S, Oh H, Shin S, et al. (2014) Ahnak functions as a tumor suppressor via modulation of TGFb/Smad signaling pathway. Oncogene 33: 4675–4684. doi:10.1038/onc.2014.69
PMID:24662814
8. Shtivelman E, Cohen FE, Bishop JM (1992) A human gene (AHNAK) encoding an unusually large pro-tein with a 1.2-microns polyionic rod structure. Proc Natl Acad Sci U S A 89:5472–5476. PMID: 1608957
9. Shtivelman E, Bishop JM (1993) The human gene AHNAK encodes a large phosphoprotein located pri-marily in the nucleus. J Cell Biol 120:625–630. PMID:8381120
10. Hashimoto T, Gamou S, Shimizu N, Kitajima Y, Nishikawa T (1995) Regulation of translocation of the desmoyokin/AHNAK protein to the plasma membrane in keratinocytes by protein kinase C. Exp Cell Res 217:258–266. PMID:7698224
11. Hohaus A, Person V, Behlke J, Schaper J, Morano I, Haase H (2002) The carboxyl-terminal region of ahnak provides a link between cardiac L-type Ca2+ channels and the actin-based cytoskeleton. FASEB J 16:1205–1216. PMID:12153988
12. Lee IH, You JO, Ha KS, Bae DS, Suh PG, Rhee SG, et al. (2004) AHNAK-mediated activation of phos-pholipase C-gamma1 through protein kinase C. J Biol Chem 279:26645–26653. PMID:15033986
13. Huang Y, Laval SH, van Remoortere A, Baudier J, Benaud C, Anderson LV, et al. (2007) AHNAK, a novel component of the dysferlin protein complex, redistributes to the cytoplasm with dysferlin during skeletal muscle regeneration. FASEB J 21:732–742. PMID:17185750
14. Shaw AS, Filbert EL (2009) Scaffold proteins and immune-cell signalling. Nat Rev Immunol 9:47–56.
doi:10.1038/nri2473PMID:19104498
15. Kim IY, Jung J, Jang M, Ahn YG, Shin JH, Choi JW, et al. (2010)1H NMR-based metabolomic study on resistance to diet-induced obesity in AHNAK knock-out mice. Biochem Biophys Res Commun 403:428–434. doi:10.1016/j.bbrc.2010.11.048PMID:21094140
16. Li J, Yu X, Pan W, Unger RH (2002) Gene expression profile of rat adipose tissue at the onset of high-fat-diet obesity. Am J Physiol Endocrinol Metab 282:E1334–1341. PMID:12006364
17. Lee IH, Lim HJ, Yoon S, Seong JK, Bae DS, Rhee SG, et al. (2008) Ahnak protein activates protein kinase C (PKC) through dissociation of the PKC-protein phosphatase 2A complex. J Biol Chem 283:6312–6320. doi:10.1074/jbc.M706878200PMID:18174170
18. Bowers RR, Kim JW, Otto TC, Lane MD (2006) Stable stem cell commitment to the adipocyte lineage by inhibition of DNA methylation: role of the BMP-4 gene. Proc Natl Acad Sci U S A 103:13022–13027.
PMID:16916928
19. Lee H, Kim HJ, Lee YJ, Lee MY, Choi H, Lee H, et al. (2012) Krüppel-like factor KLF8 plays a critical role in adipocyte differentiation. PLoS One 7(12):e52474. doi:10.1371/journal.pone.0052474PMID:
23285057
20. Liu F, Hata A, Baker JC, Doody J, Cárcamo J, Harland RM, et al. (1996) A human Mad protein acting as a BMP-regulated transcriptional activator. Nature 381:620–623. PMID:8637600
21. Rajkumar K, Modric T, Murphy LJ (1999) Impaired adipogenesis in insulin-like growth factor binding protein-1 transgenic mice. J Endocrinol 162:457–465. PMID:10467238
22. Yamamoto N, Akamatsu H, Hasegawa S, Yamada T, Nakata S, Ohkuma M, et al. (2007) Isolation of multipotent stem cells from mouse adipose tissue. J Dermatol Sci 48:43–52. PMID:17644316
23. Choi CS, Savage DB, Abu-Elheiga L, Liu ZX, Kim S, Kulkarni A, et al. (2007) Continuous fat oxidation in acetyl-CoA carboxylase 2 knockout mice increases total energy expenditure, reduces fat mass, and improves insulin sensitivity. Proc Natl Acad Sci U S A 104:16480–16485. PMID:17923673
24. Youn JH, Buchanan TA (1993) Fasting does not impair insulin-stimulated glucose uptake but alters intracellular glucose metabolism in conscious rats. Diabetes 42:757–763. PMID:8482433
25. Rossetti L, Giaccari A (1990) Relative contribution of glycogen synthesis and glycolysis to insulin-medi-ated glucose uptake. A dose-response euglycemic clamp study in normal and diabetic rats. J Clin Invest 85:1785–1792. PMID:2189891
26. Tang QQ, Otto TC, Lane MD (2004) Commitment of C3H10T1/2 pluripotent stem cells to the adipocyte lineage. Proc Natl Acad Sci U S A 101:9607–9611. PMID:15210946
28. Atkinson BJ, Griesel BA, King CD, Josey MA, Olson AL (2013) Moderate GLUT4 Overexpression Improves Insulin Sensitivity and Fasting Triglyceridemia in High-Fat Diet–Fed Transgenic Mice.
Diabe-tes 62: 2249–2258. doi:10.2337/db12-1146PMID:23474483
29. Abel ED, Peroni O, Kim JK, Kim Y-B, Boss O, Hadro E, et al. (2001) Adipose-selective targeting of the GLUT4 gene impairs insulin action in muscle and liver. Nature 409: 729–733. PMID:11217863
30. Guerre-Millo M (2004) Adipose tissue and adipokines: for better or worse. Diabetes Metab 30:13–19.
PMID:15029093
31. Maffei M, Halaas J, Ravussin E, Pratley RE, Lee GH, Zhang Y, et al. (1995) Leptin levels in human and rodent: Measurement of plasma leptin and ob RNA in obese and weight-reduced subjects. Nat Med 1:1155–1161. PMID:7584987
32. Alli AA, Gower WR Jr. (2009) The C type natriuretic peptide receptor tethers AHNAK1 at the plasma membrane to potentiate arachidonic acid-induced calcium mobilization. Am J Physiol Cell Physiol 297: C1157–1167. doi:10.1152/ajpcell.00219.2009PMID:19710363
33. Ramdas M, Harel C, Armoni M, Karnieli E. (2015) AHNAK-KO Mice are protected from diet-induced obesity but are glucose intolerant. Horm Metab Res 47:265–272. doi:10.1055/s-0034-1387736PMID: 25153686
34. Jin W, Takagi T, Kanesashi SN, Kurahashi T, Nomura T, Harada J, et al. (2006) Schnurri-2 controls BMP-dependent adipogenesis via interaction with Smad proteins. Dev Cell 10:461–471. PMID: 16580992
35. Takahashi A, Morita M, Yokoyama K, Suzuki T, Yamamoto T (2012) Tob2 inhibits peroxisome prolifera-tor-activated receptorγ2 expression by sequestering Smads and C/EBPαduring adipocyte differentia-tion. Mol Cell Biol 32:5067–5077. doi:10.1128/MCB.00610-12PMID:23071089
36. Riordan NH, Ichim TE, Min WP, Wang H, Solano F, Lara F, et al. (2009) Non-expanded adipose stromal vascular fraction cell therapy for multiple sclerosis. J Trans Med 7:29.
37. Rodeheffer MS, Birsoy K, Friedman JM (2008) Identification of white adipocyte progenitor cells in vivo. Cell 135:240–249. doi:10.1016/j.cell.2008.09.036PMID:18835024
38. Gesta S, Tseng YH, Kahn CR (2007) Developmental origin of fat: tracking obesity to its source. Cell 131:242–256. PMID:17956727
39. Blitz IL, Cho KW (2009) Finding partners: how BMPs select their targets. Dev Dyn 238:1321–1331. doi: 10.1002/dvdy.21984PMID:19441058
40. Phimphilai M, Zhao Z, Boules H, Roca H, Franceschi RT (2006) BMP signaling is required for RUNX2‐
dependent induction of the osteoblast phenotype. J Bone Miner Res 21:637–646. PMID:16598384
41. Reshef R, Maroto M, Lassar AB (1998) Regulation of dorsal somitic cell fates: BMPs and noggin control the timing and pattern of myogenic regulator expression. Genes Dev 12:290–303. PMID:9450925
42. Zehentner BK, Dony C, Burtscher H (1999) The transcription factor Sox9 Is involved in BMP‐2
signal-ing. J Bone Miner Res 14:1734–1741. PMID:10491221
43. Zhao GQ (2003) Consequences of knocking out BMP signaling in the mouse. Genesis 35:43–56.
PMID:12481298
44. Pan Q, Yu Y, Chen Q, Li C, Wu H, Wan Y, et al. (2008) Sox9, a key transcription factor of bone morpho-genetic protein‐2‐induced chondrogenesis, is activated through BMP pathway and a CCAAT box in the
proximal promoter. J Cell Physiol 217:228–241. doi:10.1002/jcp.21496PMID:18506848
45. Fajas L (2003) Adipogenesis: a cross-talk between cell proliferation and cell differentiation. Ann Med 35:79–85. PMID:12795337
46. Freytag SO (1998) Enforced expression of the c-myc oncogene inhibits cell differentiation by precluding entry into a distinct predifferentiation state in G0/G1. Mol Cell Biol 8:1614–1624.
47. Reichert M, Eick D (1999) Analysis of cell cycle arrest in adipocyte differentiation. Oncogene 18:459–
466. PMID:9927202
48. Parikh H, Nilsson E, Ling C, Poulsen P, Almgren P, Nittby H, et al. (2008) Molecular correlates for maxi-mal oxygen uptake and type 1 fibers. Am J Physiol Endocrinol Metab 294:E1152–1159. doi:10.1152/ ajpendo.90255.2008PMID:18445752
49. Griffith ML, Younk LM, Davis SN (2010) Visceral adiposity, insulin resistance, and type 2 diabetes. Am J Lifestyle Med 4:230–243.
50. Vaillant F, Lauzier B, Poirier I, Gélinas R, Rivard ME, Robillard Frayne I, et al. (2014) Mouse strain dif-ferences in metabolic fluxes and function of ex vivo working hearts. Am J Physiol Heart Circ Physiol 306: H78–87. doi:10.1152/ajpheart.00465.2013PMID:24186097