www.clim-past.net/9/1559/2013/ doi:10.5194/cp-9-1559-2013
© Author(s) 2013. CC Attribution 3.0 License.
Climate
of the Past
Geoscientiic
Geoscientiic
Geoscientiic
Geoscientiic
A 350 ka record of climate change from Lake El’gygytgyn, Far East
Russian Arctic: refining the pattern of climate modes by means of
cluster analysis
U. Frank1, N. R. Nowaczyk1, P. Minyuk2, H. Vogel3, P. Ros´en4, and M. Melles3
1Helmholtz Centre Potsdam, GFZ German Research Centre for Geosciences,
Section 5.2 – Paleoclimate and Landscape evolution, 14473 Potsdam, Germany
2North-East Interdisciplinary Science Research Institute, FEB RAS, 685000 Magadan, Russia 3Institute of Geology and Mineralogy, University of Cologne, 50674 Cologne, Germany 4Climate Impacts Research Centre (CIRC), Ume˚a University, 98107 Abisko, Sweden
Correspondence to:U. Frank (ufrank@gfz-potsdam.de)
Received: 5 September 2012 – Published in Clim. Past Discuss.: 17 October 2012 Revised: 30 May 2013 – Accepted: 17 June 2013 – Published: 22 July 2013
Abstract.Rock magnetic, biochemical and inorganic records of the sediment cores PG1351 and Lz1024 from Lake El’gygytgyn, Chukotka peninsula, Far East Russian Arctic, were subject to a hierarchical agglomerative cluster analysis in order to refine and extend the pattern of climate modes as defined by Melles et al. (2007). Cluster analysis of the data obtained from both cores yielded similar results, dif-ferentiating clearly between the four climate modes warm, peak warm, cold and dry, and cold and moist. In addition, two transitional phases were identified, representing the early stages of a cold phase and slightly colder conditions during a warm phase. The statistical approach can thus be used to resolve gradual changes in the sedimentary units as an indi-cator of available oxygen in the hypolimnion in greater de-tail. Based upon cluster analyses on core Lz1024, the pub-lished succession of climate modes in core PG1351, cov-ering the last 250 ka, was modified and extended back to 350 ka. Comparison to the marine oxygen isotope (δ18O)
stack LR04 (Lisiecki and Raymo, 2005) and the summer insolation at 67.5◦N, with the extended Lake El’gygytgyn
parameter records of magnetic susceptibility (κLF), total
or-ganic carbon content (TOC) and the chemical index of alter-ation (CIA; Minyuk et al., 2007), revealed that all stages back to marine isotope stage (MIS) 10 and most of the substages are clearly reflected in the pattern derived from the cluster analysis.
1 Introduction
The climate history of the Chukotka peninsula, Far East Rus-sian Arctic, for the last 250 ka was revealed by a multi-disciplinary study on sediment core PG1351 from Lake El’gygytgyn (see Brigham-Grette et al., 2007, and references therein). Based on the interpretation of its sediment compo-sition, physical properties, geochemistry, and organic com-ponents, four different climate modes were distinguished: warm, peak warm, cold and dry, and cold and wet (Melles et al., 2007). The individual climatic phases correspond to stages and substages of the marine isotopic record, when tuning the records of sediment variability to the Northern Hemisphere insolation (Melles et al., 2007; Nowaczyk et al., 2007). Additional information on the climatic history was provided from pollen counting (Lozkhin et al., 2007) and diatom analysis (Cherapanova et al., 2007) as well as sedi-mentological investigations (Asikainen et al., 2007).
160 140 520
540
Enmyvaam PG1351
172°00´ 172°10´ 172°20´
171°50´ E
67° 32´
67° 28´
67° 24´ N
560 500
120 LZ1024
El'gygytgyn
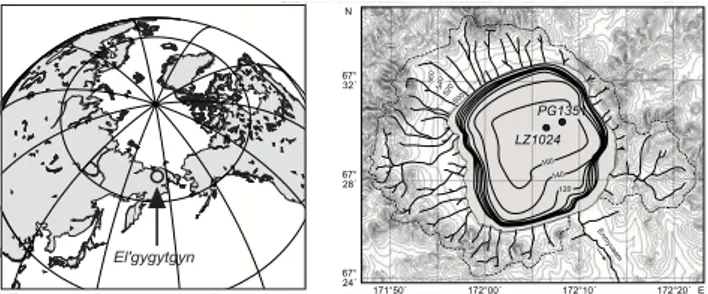
Fig. 1.Location of Lake El’gygytgyn (circle, not to scale) on the
Chukotka peninsula, Far East Russian Arctic (left) and close up of the lake with the watershed (dashed line, contour interval for topog-raphy is 20 m) and the locations of the sediment cores investigated (right).
reproducibility of the statistical approach to facies identifi-cation used in this study is evaluated by comparison of the results obtained from analysis of the individual cores. Cores PG1351 and Lz1024 are analysed in the context of revised age models now available for both cores (Nowaczyk et al., 2012, 2013), extending the existing record of environmental history of the Chukotka peninsula back to 350 ka. In addi-tion the development of an objective and quantitative method of sedimentary facies analysis provides a framework for on-going and future interpretation of the record now available from the International Continental Scientific Drilling Pro-gram (ICDP) core 5011-1 recovered from Lake El’gygytgyn in 2009.
2 Settings and material
Lake El’gygytgyn is located in central Chukotka, Far East Russian Arctic (67◦30′N, 172◦05′E), in the zone of hypoarc-tic tundra, about 100 km to the north of the Archypoarc-tic Circle (Fig. 1). The roughly circular lake with a diameter of 12 km and a maximum water depth of 175 m lies within a 3.58 (±0.04) Ma-old meteoritic crater (Layer, 2000). The rocks in the lake catchment consist primarily of igneous rocks, lava, tuffs, ignimbrites of rhyolites and dacites, rarely andesites and andesitic tuffs (Gurov and Koeberl, 2004) of Upper Cre-taceous age. Chemical and physical weathering products of these rocks make up the majority of the clastic material trans-ported into the lake by about 50 ephemeral creeks originat-ing from the crater rim. Weatheroriginat-ing of the rocks is largely controlled by the presence or absence of permafrost (Minyuk et al., 2007). Fluvial transport and sedimentation is limited to summer periods when air temperatures are above 0◦C and the ice cover on the lake is disintegrating (Nolan and Brigham-Grette, 2002).
During expeditions in 1998 and 2003, designed as pilot studies for the ICDP-drilling of Lake El’gygytgyn, two long sediment cores, PG1351 and Lz1024, were recovered from the lake centre at a water depth of 175 m (Fig. 1). Both
cores were recovered during the springtime through holes in the lake ice, using a gravity corer (UWITEC Ltd., Austria) for the sediment water interface and a 3 m-long percussion piston corer (UWITEC Ltd., Austria) for the deeper sedi-ments (Melles et al., 2005, 2007). The core segsedi-ments are overlapping, yielding two composite profiles with lengths of 1291 cm for PG1351 and 1660 cm for Lz1024. The sed-iment consists of alternations of brownish and greenish non-laminated and non-laminated greyish silt and clay; including some turbidites with thicknesses of up to 45 cm (Juschus et al., 2009). Former investigations on core PG1351 (Nowaczyk et al., 2002, 2007; Melles et al., 2007; Minyuk et al., 2007) revealed that anoxic and laminated conditions primarily oc-cur during periods of perennial ice cover and oxic and non-laminated conditions occur when open water controls mixing of the water body during summer times (Melles et al., 2007). In intervals with prevailing anoxic conditions reductive dis-solution of magnetite was observed whereas organic matter is well preserved. Biogenic productivity within the lake, con-trolled by availability of light and nutrients, also strongly depends on the duration of ice-free conditions and nutrient input from thawing permafrost soils during summer times.
3 Methods
3.1 Rock magnetic analyses
The magnetic susceptibility was measured on the split halves of the cores in 1 mm steps with a Bartington MS2E/1 spot-reading sensor integrated in an automated core logging sys-tem (Nowaczyk et al., 2002). Magnetic susceptibility (κLF)
of discrete samples (20×20×15 mm) was measured nearly continuously, taken along thezaxis of the core halves with an AGICO kappabridge KLY-3S. Isothermal remanent mag-netizations (IRM) on the samples from core Lz1024 were imprinted with a 2G ENTERPRISES 660 pulse magnetizer and measured with a MOLYNEUX MiniSpin fluxgate mag-netometer (noise level 0.2 mAm−1). A field of 1500 mT was chosen to imprint the saturation isothermal remnant magne-tization (SIRM) of all samples, followed by a backfield (BF) of−300 mT. The SIRM and backfield measurements for core PG1351 were performed with a Princeton measurement al-ternating gradient magnetometer (AGM) on an additional set of mini-samples with a volume of about 15–20 mm3 (see Nowaczyk et al., 2002, for details). S-ratios were calcu-lated as 0.5×(1-(IRMBF/SIRM)) following Bloemendal et
al. (1992).
3.2 Geochemical analyses
100 1000 100 1000 1700 1600 1500 1400 1300 1200 1100 1000 900 800 700 600 500 400 300 200 100 0 C o mposite d epth (cm) 100 1000 Lz1024 100 1000 PG1351
1600 1700 1800
350 300 250 200 150 100 50 0 Ag e (ka)
1600 1700 1800
67.5 °N insolation (MJJA)
(W m-2a-1)
Magnetic susceptibility (10-6)
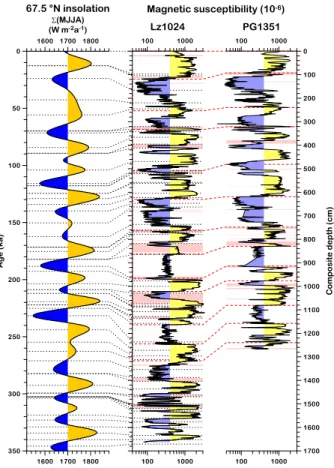
Fig. 2.Correlation of composite cores PG1351 and Lz1024 from
Lake El’gygytgyn by means of high-resolution records of magnetic susceptibility, and tuning of these logs to the summer insolation at
67.5◦N according to Laskar et al. (2004) (left). The tuning
proce-dure is described in detail in Nowaczyk et al. (2012, 2013). Some prominent correlation levels are marked by dashed red lines. Pink bars denote turbidite layers.
analysis of the neighbouring core PG1351 (Minyuk et al., 2007). A selected group of major elements was used to quan-tify the degree of alteration utilizing the “chemical index of alteration”, where CIA=[Al2O3/(Al2O3+ CaO+Na2O+
K2O)]×100.
Biogeochemical analyses on core PG1351 were performed on freeze-dried samples continuously subsampled in 2 cm intervals (Melles et al., 2007). The content of total organic carbon (TOC) was determined with a CHNS-932 analyser, whereas biogenic silica (BSi) content was measured by a wet chemical method following M¨uller and Schneider (1993). On core Lz1024, the quantification of BSi and TOC was under-taken by Fourier Transform Infrared Spectroscopy (FTIRS) on samples taken in intervals of 1 cm as described by Ros´en et al. (2010a). Reproducibility of the analyses is confirmed by the comparison with the BSi values obtained on a sub-set of samples by conventional measurements (Ros´en et al., 2010a, b).
3.3 Cluster analysis
The rock magnetic and geochemical data obtained from cores PG1351 and Lz1024 were subject to a hierarchical agglomer-ative cluster analysis in order to discriminate sediment facies of characteristic composition and compare them with facies defined in core PG1351 on the basis of visual comparison of proxy data (Melles et al., 2007). This method is commonly used for sediment analysis in terms of spatial distribution of metal and heavy metal pollution (e.g. Danielsson et al., 1999; Simeonov et al., 2000). Former application of this statistical method on rock magnetic data from the Dead Sea sediments revealed that it is particularly suited for grouping sediment samples with similar composition from a set of geophysical and geochemical variables (Frank et al., 2007). In addition the resulting clusters can be presented in colour and symbol-coded within standard plots, thus visualizing the influence of the single parameters on the cluster formation. Cluster analy-sis was performed on the same set of parameters available for each core that areκLFthe S-ratio, BSi, TOC, Ti02and CIA,
all of which are defined independently of each other. Thus the cluster-analysis was not biased by an emphasis on rock magnetic, inorganic or biogeochemical data. To obtain the same sample depths for all parameters taken from one core, the records ofκLF, S-ratio, TOC and BSi were re-sampled by interpolating between given values at depth associated with the existing inorganic geochemistry samples. Samples orig-inating from turbidites (Juschus et al., 2009) were excluded from the statistical analysis. The routine was performed with WinSTAT for Excel (R. Fitch Software, 2003). The logarithm of the bulk susceptibility was taken for statistical analysis be-cause values vary over more than one order of magnitude. All parameters were then standardized yielding a variance of 1 and a mean value of 0. The Euclidean distance was com-puted and used as a measure of similarity between the pairs of data points. The used agglomerations method is called in-cremental sums of squares: the distance between two clusters is proportional to the changes of the sum of squares within the groups during formation of the different groups.
3.4 Correlation and chronology
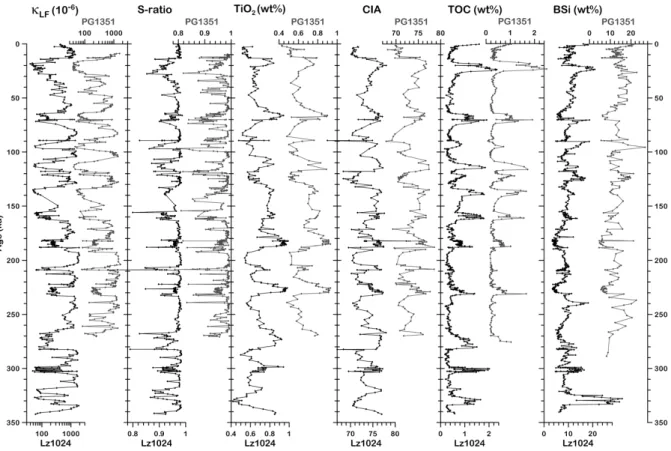
Fig. 3.Comparison of the records of magnetic susceptibility (κLF), S-ratio, TiO2content, chemical index of alteration (CIA), total organic carbon (TOC) content, and content of biogenic silicium (BSi) for cores PG1351 and Lz1024 from Lake El’gygytgyn. All records are plotted versus age.
is integrated in the long record of ICDP Site 5011-1 this cor-relation is also valid for PG1351 and the 5011-1 record.
The depth-age model was derived from the systematic tun-ing of magnetic susceptibility, BSi, TOC, and TiO2 to the
Northern Hemisphere insolation (Fig. 2), considering also OSL dating from core PG1351 (Nowaczyk et al., 2002, 2007; Forman et al., 2007) and Lz1024 (Juschus et al., 2007). This method was also applied to the core composite from ICDP Site 5011-1 (Nowazcyk et al., 2013). Applying this method to cores Lz1024 and PG1351 yielded an age of 350 ka and 275 ka for the base of the cores, respectively (Fig. 2). The slight shift towards older ages for the base of PG1351, with a new age of 275 ka instead of 252 ka (Nowaczyk et al., 2007), corresponds to the results of Lozkhin et al. (2007), suggest-ing that the lowermost part of the PG1351 pollen record represents MIS 8.
4 Results and discussion
Side-by-side plots of the rock magnetic parametersκLF and
S-ratio, TiO2content, CIA, TOC, and BSi versus age (Fig. 3)
confirms the overall similarity in the sediment composition of cores PG1351 and Lz1024, which are already visible in the high-resolution records of magnetic susceptibility (Fig. 2).
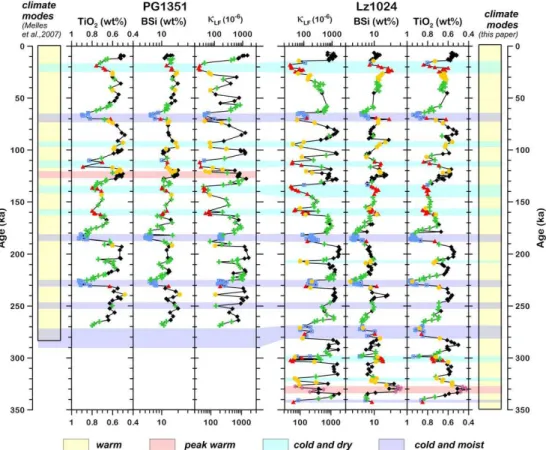
Thus, the interpretation of the sediment variability of core PG1351 in terms of changes between oxic and anoxic condi-tions in the bottom waters can directly be transferred to core Lz1024, including the pattern of climate modes as defined by Melles et al. (2007). Downcore plots of the results of the cluster analysis for both cores in combination with this pat-tern are shown in Fig. 4. The lower number of data points in Fig. 4 compared to Fig. 3 is due to the re-sampling of the data sets used for cluster analysis with a lower resolution and the elimination of the turbidite layers in the records.
A total of 6 clusters were identified in both cores, with one cluster only present in the lowermost part of LZ1024. The main parameters defining the clusters are the magnetic susceptibility and the BSi and TOC contents (Fig. 4). Sam-ples with low TOC values and high magnetic susceptibilities are marked either by black diamonds or green crosses, with the latter additionally defined by higher TiO2 values. Low
magnetic susceptibilities in combination with high BSi val-ues are typical for samples labelled with red triangles. Ex-tremely high BSi values in some samples lead to the forma-tion of a separate cluster (pink stars) (Fig. 4). The samples marked by blue squares have also low magnetic susceptibil-ities but in combination with low BSi and high TiO2values.
low S-ratios whereas all other parameters are unremarkable (Fig. 4).
Out of the 6 clusters identified, two correspond very well with the climate modes cold and dry (red triangles) and cold and moist (blue squares). Full anoxic conditions, interpreted as a result of a permanent ice cover during cold climatic pe-riods (Melles et al., 2007), are reflected for the time intervals 16.6–24.6, 64.8–73.2, 91.8–97.1, 110–116.9, 134.4–141.6, 157.1–162.8, 181.2–187.5, 224.9–231.3 and 246.6–252.7 ka (Fig. 4a and b). They are characterized by lowκLF values,
lowered S-ratios and high TOC values. The S-ratio, as a mea-sure for the percentage of high coercitive magnetic miner-als like hematite, decreases during intervminer-als with increased reductive dissolution of the magnetically softer magnetite. BSi contents in the glacial sediments show high variability (Fig. 4). They are low in the sediments indicative for cold and moist climate, probably due to blanketing snow on the permanent ice cover that hampers light penetration into the surface waters and thus biogenic production (Melles et al., 2007). During cold and dry climates, consequently, rather high BSi contents are interpreted by a wide absence of snow cover. In the time intervals 181.2–187.5 and 224.9–231.3 ka the increase in TOC and decrease inκLFis less pronounced.
Nevertheless, these sediments were deposited during cold pe-riods, as can be deduced from the high CIA and TiO2
val-ues (Fig. 4). Both parameters are found to be indicative for increased weathering during cold intervals (Minyuk et al., 2007), reflecting the rate of alteration and the amount of clastic material transported into the lake, respectively.
The three clusters, marked by black diamonds, yellow dots and green crosses, are representing warm-mode sam-ples (Fig. 4). Interglacial/Interstadial sedimentation in Lake El’gygytgyn generally is characterized by high values inκLF and S-ratios and low values in TOC, TiO2and CIA. A very
pronounced BSi peak occurs from 327.2 and 334.1 ka (MIS 9.5), with opal contents of up to 40 wt-%, being twice as high as in the rest of the profile, defining a separate cluster (pink stars) (Fig. 4). These high values suggest a distinctly higher biogenic production than in other interglacials, possibly due to a particularly warm climate. An increase in TOC is also found in the sediments formed between 120.1 and 127 ka (MIS 5.5), however, the TOC peak is lower than during MIS 9.5, and it is not associated with decreasedκLF values and
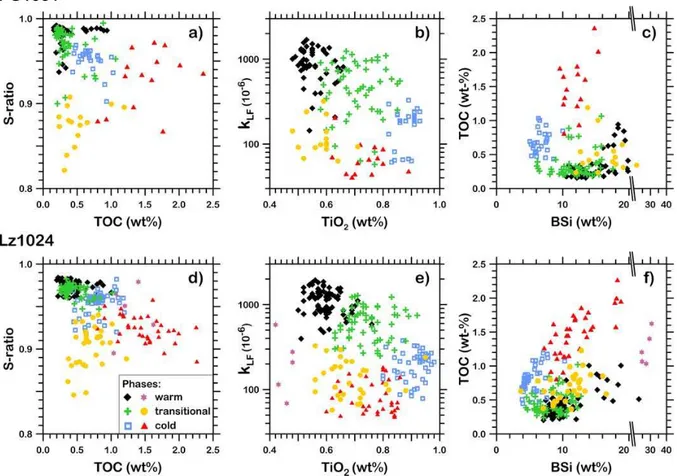
S-ratios, as indicators of enhanced dissolution of magnetite. More detailed information on changes in the sediment composition of core PG1351 and Lz1024, especially on the transitional intervals between full oxic and anoxic condi-tions, is given by the results of the separate cluster analy-ses. Scatter plots of the different parameters, except for CIA, which shows variations comparable to those of TiO2(Fig. 3),
reveal in more detail how the clusters are defined (Fig. 5a to f). The best parameters to distinguish between the individ-ual clusters areκLFand TiO2, representing the changes
be-tween oxic and anoxic conditions most effectively (Fig. 5b and e). Here it is clearly visible that the clusters are
dis-tributed along two mixing lines, and could be grouped into three pairs as well. These pairs are representing the dis-tinct warm climate mode samples: black (diamonds) and pink (stars) cluster, both cold mode samples: blue (squares) clus-ter and red (triangles) clusclus-ters, and yet unspecified warm cli-mate mode samples: green (crosses) cluster and yellow (dots) cluster (Fig. 5e). These pairs have basically the same minero-genic and magnetic mineral content each, but with distinct differences in productivity, as expressed by both the opal and TOC values. The impact of the higher TOC and opal contents on the minerogenic components is visible as a shift in both, κLF and TiO2, towards lower values by means of increased
dissolution and dilution, respectively. In the two separate clusters representing cold conditions the differences in pro-ductivity are attributed to the presence (blue squares=low productivity) or absence (red triangles=high productivity) of snow-covered ice (Melles et al., 2007), thus limiting the amount of sunlight available for primary production. During warm phases productivity is primarily affected by temper-ature, controlling the length of the ice-free period in sum-mer (Melles et al., 2007). Therefore, the pink (stars) cluster is representing a peak warm phase contrasting normal warm phases marked by black diamonds (Fig. 5e).
Whereas the cluster representing the extreme climatic con-ditions are easily to address, the interpretation of the pres-ence of two additional phases, marked by green crosses and yellow dots, becomes more difficult. They must be exam-ined within the context of the mixing lines. The mixing line formed by the samples from the black (diamonds), the green (crosses) and the blue (squares) is also identifiable in the S-ratio and, with restrictions, in TOC (Fig. 5a and d). The black diamond end members of this line are characterized by high magnetic susceptibilities and high S-ratios, whereas both TiO2 and TOC are low. This combination reflects the
oxic bottom-water conditions due to annual mixing during the ice-free period, in combination with a relative reduction of clastic sediment supply. Thus the magnetic mineral frac-tion is preserved, whereas the organic matter is degraded. At the other end of the mixing line, defined by the blue square cluster, sediment samples show the opposite behaviour with lower magnetic susceptibilities, on average higher TOC val-ues and increased TiO2content. These are characteristics for
cold climates when anoxic conditions prevail at the lake bot-tom, leading to a good preservation of the organic material, whereas the magnetic fraction, mainly magnetite, is severely affected by dissolution (Nowaczyk et al., 2002). The BSi val-ues are also low (Fig. 5c and f) since the biogenic produc-tivity within the lake is limited, and suppressed mixing of the lake water and frozen soils in the catchment led to a de-pletion of nutrients. The samples from the green (crosses) clusters are then to be defined as reflecting transitional con-ditions, most probably a less pronounced warm phase, since the S-ratio, the TOC and BSi values are similar to those in the black diamond cluster. The comparable lower κLF
Fig. 5.Defining the sediment characteristics of the different climatic phases identified in PG1351(a–c)and Lz1024(d–f)by combining
the parameters used for cluster analysis in a series of scatter plots.(a)and(d): TOC versus S-ratio (both are indicative for oxic/anoxic
conditions);(b)and(e): TiO2(lithogenic contribution) versusκLF(oxic/anoxic conditions);(c)and(f): BSi (diatom content) versus TOC
(oxic/anoxic conditions). More detail on the subdivision of the samples into six clusters is given in the text.
anoxic conditions at the sediment–water interface and an in-creased clastic sediment supply, respectively. In core Lz1024 this grouping is more pronounced than in core PG1351, since the number of samples is higher (Fig. 5e).
The second mixing line includes the samples from the red (triangles), the yellow (dots) and the pink (stars) clus-ter (Fig. 5e). The samples from the latclus-ter clusclus-ter are located in the lowermost meter of the investigated sediment profile, only covered in core Lz1024 (Figs. 3 and 4). These samples have TOC values similar to those from the red (triangles) cluster but they have extremely high opal values, in combi-nation with distinctively higher (lower) κLF (TiO2) values.
The association of the BSi peak values with unusually high content of organic matter, as expressed by high TOC con-tents, and low values ofκLFand S-ratio (Fig. 4) suggest that
a particularly high flux of organic matter during this warm phase has generated at least seasonally anoxic conditions in the pore waters and subsequent dissolution of magnetic min-erals. The red (triangles) are similar to the samples from the blue square cluster, but representing phases with a distinctly higher productivity, due to a wide absence of snow on the
permanent ice cover. That is not only reflected by increased TOC and BSi values, but by the lowestκLF values,
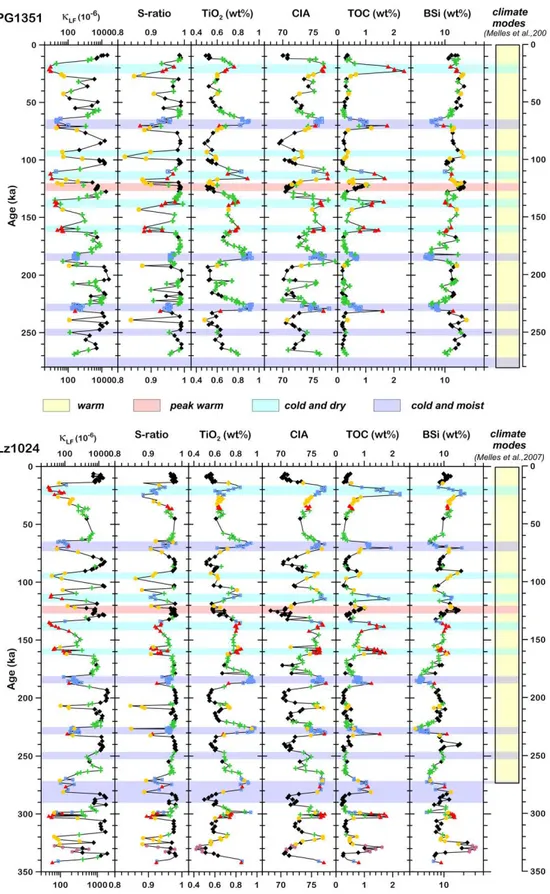
Fig. 6.Refining the boundaries of the climate modes at Lake El’gygytgyn by comparing the results of the cluster analysis for cores PG1351
and Lz1024 superimposed on the TiO2, the BSi and the magnetic susceptibility records versus age. Both TiO2curves are plotted on inverted
axes. For legend of the clusters see Fig. 5.
have partly overlapping sediment characteristics. Thus the samples from the yellow (dots) clusters are representing a preliminary or late stage of a cold phase, rather than of a warm phase. This interpretation is supported by the observa-tion that the cold and dry phase from 91.8–97.1 ka (Melles et al., 2007), is marked by yellow dot samples in core PG1351 and Lz1024 as well (Fig. 4).
In concordance with this interpretation of the clusters the scheme of climate modes, as defined by Melles et al. (2007), was then refined and extended to 350 ka in core Lz1024 (Fig. 6). Thus, three more phases dominated by dry and cold climate, one peak warm, and one cold and humid phase were identified. The decision to interpret the phase between 340.2 to 342.9 ka as cold and humid rather than cold and dry is based on the relatively low TOC values, compared to the interval from 298.2 to 303.8 ka (Fig. 3). The peak warm mode corresponding to MIS 5.5 (120.1 to 127 ka) was moved. There are some minor discrepancies between the re-sults of the cluster analysis performed for core Lz1024 and the boundaries of the climatic phases defined in core PG1351 (Fig. 6). This can be explained by the higher resolution of core Lz1024, yet leading to an adaptation of the climate phase boundaries as shown in Fig. 6. For a further division of the cold phases, as it is suggested by the results of the
clus-ter analysis, a minimum of two neighboured samples from the same cluster in both cores was requested, a precondi-tion which is not met. With a less strict observance of these rules, a division of the cold phase from 64.8–73.2 ka into one wet (64.8–69.9 ka) and one dry (69.9–73.2 ka) subphase (Fig. 6) would correspond to the results of Cherapanova et al. (2007), showing that a zone of low diatom abundance oc-curs between 63.2 and 67.5 ka, indicating a snow blanket on the perennial ice cover of the lake.
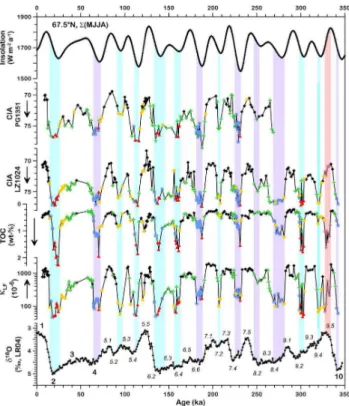
For a further interpretation of the clusters, the parameters κLF, TOC and CIA were plotted on an age scale together with
the marine oxygen isotope stack LR04 (Lisiecki and Raymo, 2005) and the cumulative summer (May to August) insola-tion at 67.5◦N according to Laskar et al. (2004) (Fig. 7).
Al-though the depth-age models of the El’gygytgyn sedimentary records of PG1351 and Lz1024 are both obtained by tun-ing to these two reference records (Nowaczyk et al., 2012, 2013), the similarity between the records reveals the strong coupling of Lake El’gygytgyn to external forcing processes. All the substages back to MIS 10 can easily be identified, best seen in the records reflecting the variability in the minero-genic components, which are κLF and CIA (Fig. 7). In the
Fig. 7.Magnetic susceptibility (κLF), TOC, and CIA data of core Lz1024 composite versus time together with the CIA data of core
PG1351, the summer insolation at 67.5◦N according to Laskar et
al. (2004, top) and the marine oxygen isotope (δ18O) stack LR04
by Lisiecki and Raymo (2005, bottom). Oxygen isotope stages are marked by bold numbers, substages by italicized numbers. The coloured symbols in the Lz1024 and PG1351 records denote the different clusters (see also Fig. 4). The shaded stripes denote cli-mate modes at Lake El’gygytgyn: peak warm (pink), cold and dry (turquoise) and cold and moist (blue). For legend of the clusters see Fig. 5.
grouped into the blue (squares) cluster, nor the red (trian-gles) cluster, which would be typical for the cold phases, but in a transitional group. Nevertheless, the samples asso-ciated with substages 7.2 and 9.4 are grouped into the yellow (dots) cluster, already identified as being representative for an early stage of a cold phase. The climatic deterioration ob-served in theδ18O record during substage 8.2, however, had only a minor influence on the sediment composition in Lake El’gygytgyn (Fig. 7).
The most unexpected observation is that substage 5.5, the Eemian, cannot be distinguished from the other warm peri-ods by means of cluster analysis, although it is known as the last peak warm phase before the beginning of the Holocene, with conditions similar to substage 9.5 (Fig. 7) (Miller et al., 2010). The latter clearly stands out, with its extremely high opal values, thus defining its own cluster (pink stars) (Fig. 5f). But this parameter and, based on the dilution ef-fect, the TiO2and, to a lesser degree, theκLFvalues, are the
only parameters out of the normal (Figs. 6 and 7). For stage
5.5 none of the parameters presented show values that dif-fer from those obtained for the other warm phases marked by black diamonds (Fig. 7). This corresponds to the results from ICDP core 5011-1 (Melles et al., 2012), showing that the sediment facies present during MIS 5.5 is typical for a wide range of glacial to interglacial settings, whereas MIS 9.5 belongs to a group of “super interglacials” that have dis-tinctly laminated sediments and reflect particularly warm in-terglacials. Therefore, it must be assumed that the observed global raise in temperature during stage 5.5 affected the veg-etation and the aquatic productivity, but not the conditions in the lake beyond the normal. Clear peaks in the amounts of tree pollen and diatoms, identified by Lozkhin et al. (2007) and Cherapanova et al. (2007), respectively, led to the con-clusion that there was an increase in precipitation (Lozkhin et al., 2007). However, this did not affect the rate of weath-ering and amount of minerogenic material, because both are generally low during warm phases (Fig. 7). For a further dis-cussion on this topic it would be necessary to have results of cluster analysis for the complete Holocene or stage 11 for comparison which are expected from the future work on the ICDP core 5011-1.
A second view on Fig. 7 reveals that nearly all warm phases marked by black diamonds are more strongly related to both the insolation and δ18O record than those marked by green crosses. The latter includes MIS 3, an interval that is not known for a marked global warming, but for a more pronounced regionality of climate change (Dawson, 1992) and the warm substages 6.3, 6.5, and 8.3. In the LR04δ18O record, these intervals are characterized by much heavier val-ues compared to the peaks marked by black diamonds in the El’gygytgyn records, that are MIS 1 and the warm substages in MIS 5, 7 and 9, which are associated with the lightestδ18O values. Naturally, there are some exceptions but the general trend is not in question (Fig. 7). This result indicates that it is possible to distinguish between three different types of warm climate modes in the sediments of Lake El’gygytgyn by means of cluster analysis, as implied by comparison to global records of climate variability. The primary reason for this lies in the high-latitude position of the lake, generating an environment that is very sensible to temperature changes. Complete mixing of the water body depends on ice-free con-ditions and therefore warm summer temperatures. Relative small changes in summer temperature will therefore severely effect the duration of the ice-free period, and thus the sedi-ment composition by means of enhanced or decreased bio-genic productivity, rate of mixing of the water body and hence, dissolution of either magnetite or organic matter.
5 Conclusions
composition with the neighbouring, 1291 cm-long compos-ite core PG1351. This allowed for extending and refining the existing pattern of climate variability from 250 ka back to 350 ka. By means of cluster analysis it was possible to clearly differentiate between three of the four climate modes as de-fined by Melles et al. (2007). In addition to the warm, cold and dry, and cold and moist modes, two transitional modes were identified, representing the early stages of cold phases and slightly colder conditions during warm phases, respec-tively. Thus the gradual changes in the sedimentary compo-sition as an indicator of available oxygen in the hypolimnion during glacial/non-glacial periods and the lack of mixing in the water column can be resolved in greater detail by us-ing statistical approaches. But not every climate phase is de-tectable by means of cluster analysis alone, as was demon-strated by the samples between 120.1 and 127 ka (MIS 5.5) that were not assigned to a peak warm mode as defined by Melles et al. (2007). The increased values in only one of the parameters used, the TOC, are not sufficient to single out this period. According to the statistical approaches, the MIS 9.5 has to be regarded as typical for “peak warm” instead, show-ing extreme values in at least two of the parameters, BSi and TiO2, used for cluster analysis (Figs. 3 and 7). Based on the
sediment composition of core Lz1024 and on the results of cluster analysis, the succession of climate modes was then slightly modified, with a minimum of two samples defining a climatic phase. Comparison of the parametersκLF, TOC and
CIA, the marine oxygen isotopeδ18O stack LR04, and the summer insolation at 67.5◦N, revealed that in the extended
record from Lake El’gygytgyn all stages back to MIS 10, and most of the substages are clearly reflected in the statistical clustering of the records as visualized by the colour pattern of the cluster analysis. This also applies to the subdivision of the warm phases, since phases marked by black diamonds are more prominent in the insolation and the LR04 stack than those marked by green crosses. Phases marked by yellow dots are either assigned to transitions into colder stages and substages, or to these stages itself, thus confirming that the gradual changes in the sedimentary units could be resolved and transformed into detailed records of climate variability.
Acknowledgements. We would like to thank J. Brigham-Grette,
A. Dehnert, G. Federov, O. Gluskkova, M. A. Haker, O. Juschus, M. Nolan, P. P. Overduin, S. Quart, V. Wennrich, and A. Zielke for their help in recovering the sediment cores from Lake El’gygytgyn during expeditions in 1998 and 2003. We thank Per Persson and the Chemistry Department at Ume˚a University for providing the FTIRS instrument. Financial support was kindly provided by the German Federal Ministry for Education and Research (BMBF grant nos. 03G0586 and 03G0642) and the Swedish Research Council (Vetenskapsr˚adet).
Edited by: T. Cook
The service charges for this open access publication have been covered by a Research Centre of the Helmholtz Association.
References
Asikainen, C. A., Francus P., and Brigham-Grette, J.: Sedimentol-ogy, clay mineralogy and grain-size as indicators of 65 ka of cli-mate change from El’gygytgyn Crater lake, Northeastern Siberia, J. Paleolimnol., 37, 105–122, 2007.
Bloemendal, J., King, J. W., Hall, F. R. and Doh, S.-J.: Rock mag-netism of late Neogene and Pleistocene deep-sea sediments: Re-lationship to sediment source, diagenetic processes, and sedi-ment lithology, J. Geophys. Res. 97, 4361–4375, 1992. Brigham-Grette, J., Melles, M., Minyuk, P., and El’gygytgyn
sci-entific Party: Overview and significanc of a 250 ka paleoclimate record from El’gygytgyn Crater lake, NE Russia, J. Paleolimnol., 37, 1–16, 2007.
Cherapanova, M. V., Snyder, J. A., and Brigham-Grette, J.: Diatom stratigraphy of the last 250 ka at Lake El’gygytgyn, northeast Siberia, J. Paleolimnol., 37, 155–162, 2007.
Danielsson, ˚A., Cato, I., Carman, R., and Rahm, L.: Spatial
cluster-ing of metals in the sediments of the Skagerrak/Kattegat, Appl. Geochem., 14, 689–706, 1999.
Dawson, A. G.: Ice Age Earth – Late Quaternary geology and cli-mate, Routledge, London, New York, 1992.
Forman, S. L., Pierson, J., G´omez, J., Brigham-Grette, J., Nowaczyk, N. R., and Melles, M.: Luminescence geochronology for sediments from Lake El’gygytgyn, northeast Siberia, Russia: constraining the timing of paleoenvironmental events for the past 200 ka, J. Paleolimnol., 37, 77–88, 2007.
Frank, U., Nowaczyk, N. R., and Negendank, J. F. W.: Rock mag-netism of greigite bearing sediments from the Dead Sea, Israel, Geophys. J. Int., 168, 921–934, 2007.
Gurov, E. P. and Koeberl, C.: Shocked rocks and impact glasses from the El’gygytgyn impact structure, Russia, Meteor. Planet. Sci., 39, 1495–1508, 2004.
Juschus, O., Juschus, O., Preusser, F., Melles, M., and Radtke, U.: Applying SAR-IRSL methodology for dating fine-grained sediments from Lake El’gygytgyn, north-eastern Siberia, Quat. Geochron., 2,187–194, 2007.
Juschus, O., Melles, M., Gebhard, A. C., and Niessen, F.: Late Quaternary mass movement events in Lake El’gygytgyn, North-eastern Siberia, Sedimentology, 56, 2155–2174, 2009.
Laskar, J., Robutel, P., Joutel, F., Gastineau, M., Correia, A. C. M., and Levrard, B.: A long-term numerical solution for the insola-tion quantities of the Earth, Astron. Astrophys., 428, 261–285, 2004.
Layer, P. W.: Argon-40/Argon-39 age of the El’gygytgyn impact event, Chukotka, Russia, Meteor. Planet. Sci., 35, 591–599, 2000.
Lisiecki, L. E. and Raymo, M. E.: A Plio-Pleistocene stack of 57
globally distributed benthicδ18O records, Paleoceanography, 20,
PA1003, doi:10.1029/2004PA001071, 2005.
Melles, M., Minyuk, P., Brigham-Grette, J., and Juschus, O. (Eds.): The Expedition El’gygytgyn Lake 2003 (Siberian Arctic), Ber. Polarforsch. Meeresforsch., 509 pp., 2005.
Melles, M., Bringham-Grette, J., Glushkova, O. Y., Minyuk, P. S., Nowaczyk N. R., and Hubberten, H.-W.: Sedimentary geo-chemisty of core PG1351 from Lake El’gygytgyn – a sensitive record of climate variability in the East Siberian Arctic during the past three glacial-interglacial cycles, J. Paleolimnol., 37, 89– 104, 2007.
Melles, M., Grette, J., Minyuk, P. S., Nowaczyk, N. R., Wennrich, V., DeConto, R. M., Anderson, P. M., Andreev, A. A., Coletti, A., Cook, T. L., Hovi, E., Kukkonen, M., Lozhkin, A. V., Ros´en, P., Tarasov, P., Vogel, H., and Wagner, B.: 2.8 Million Years of Arc-tic Climate Change from Lake El’gygytgyn, NE Russia, Science, 337, 315–320, 2012.
Miller, G. H., Brigham-Grette, J., Alley, R. B., Anderson, L., Bauch, H. A., Douglas, M. S. V., Edwards, M. E., Elias, S. A., Finney, B. P, Fitzpatrick, J. J., Funder, S. V., Herbert, T. D., Hinzman, L. D., Kaufman D. S., MacDonald, G. M., Polyak, L., Robock, A., Serreze, M.C., Smol, J. P., Spielhagen, R., White, J. W. C., Wolfe, A. P., and Wolff, E. W.: Temperature and precipitation history of the Arctic, Quaternary Sci. Rev., 29, 1679–1715, 2010. Minyuk, P. S., Brigham-Grette, J., Melles, M., Borkhodoev, V. Y.,
and Glushkova O. Y.: Inorganic geochemistry of El’gygytgyn Lake sediments (northeastern Russia) as an indicator of paleocli-matic change for the last 250 kyr, J. Paleolimnol., 37, 123–133, 2007.
M¨uller, P. J. and Schneider, J.: An automated leaching method for the determination of opal in sediments and particulate matters, Deep-Sea Res., 40, 425–444, 1993.
Nolan, M. and Brigham-Grette, J.: Basic hydrology, limnology, and meterology of modern Lake El’gygytgyn, Siberia, J. Paleolim., 37, 17–35, 2007.
Nowaczyk, N. R., Minyuk, P., Melles, M., Brigham-Grette, J., Glushkova, O., Nolan, M., Lozhkin, A. V., Stetsenko, T. V., An-dersen, P. M., and Forman, S. L.: Magnetostratigraphic results from impact crater Lake El’gygytgyn, northeastern Siberia: a 300 kyr long high-resolution terrestrial paleoclimatic record from the Arctic, Geophys. J. Int., 150, 109–126, 2002.
Nowaczyk, N. R., Minyuk, P., and Melles, M.: A revised age model for core PG1351 from Lake El’gygytgyn, Chukotka, based on magnetic susceptibility variations tuned to northern hemisphere insolation variations, J. Paleolimnol., 37, 65–76, 2007.
Nowaczyk, N. R., Haltia, E. M., Ulbricht, D., Wennrich, V., Sauer-brey, M. A., Ros´en, P., Vogel, H., Francke, A., Meyer-Jacob, C., Andreev, A. A., and Lozhkin, A. V.: Chronology of Lake El’gygytgyn sediments, Clim. Past Discuss., 9, 3061–3102, doi:10.5194/cpd-9-3061-2013, 2013.
Ros´en, P., Vogel, H., Cunningham, L., Reuss, N., Conley, D. J., and Persson, P.: Fourier transform infrared spectroscopy, a new method for rapid determination of total organic and inorganic carbon and biogenic silica concentration in lake sediments, J. Pa-leolimnol., 43, 247–259, 2010a.
Ros´en, P., Vogel, H., Cunningham, L., Hahn, A., Hausmann, S., Pienitz, R., Zolitschka, B., Wagner, B., and Persson, P.: A univer-sally applicable model for the quantitative determination of lake sediment composition using Fourier transform infrared spec-troscopy, Environ. Sci. Technol., 45, 8858–8865, 2010b. Simeonov, V., Massart, D. L., Andreev, G., and Tsakovski, S.:
