CPD
9, 2489–2515, 2013Biogeochemical properties and diagenetic changes
during the past
C. Meyer-Jacob et al.
Title Page
Abstract Introduction
Conclusions References
Tables Figures
◭ ◮
◭ ◮
Back Close
Full Screen / Esc
Printer-friendly Version Interactive Discussion
Discussion
P
a
per
|
Dis
cussion
P
a
per
|
Discussion
P
a
per
|
Discussio
n
P
a
per
|
Clim. Past Discuss., 9, 2489–2515, 2013 www.clim-past-discuss.net/9/2489/2013/ doi:10.5194/cpd-9-2489-2013
© Author(s) 2013. CC Attribution 3.0 License.
Open Access
Climate of the Past
Discussions
Geoscientiic Geoscientiic
Geoscientiic Geoscientiic
This discussion paper is/has been under review for the journal Climate of the Past (CP). Please refer to the corresponding final paper in CP if available.
Biogeochemical properties and
diagenetic changes during the past 3.6 Ma
recorded by FTIR spectroscopy in the
sediment record of Lake El’gygytgyn,
Far East Russian Arctic
C. Meyer-Jacob1, H. Vogel2,3, M. Melles2, and P. Ros ´en1,4
1
Department of Ecology and Environmental Science, Ume ˚a University, 901 87 Ume ˚a, Sweden
2
Institute of Geology and Mineralogy, University of Cologne, Zuelpicher Str. 49a, 50674 Cologne, Germany
3
Institute of Geological Sciences & Oeschger Centre for Climate Change Research, University of Bern, Baltzerstrasse 1+3, 3012 Bern, Switzerland
4
Climate Impacts Research Centre (CIRC), Abisko Scientific Research Station, 981 07 Abisko, Sweden
Received: 14 September 2012 – Accepted: 19 September 2012 – Published: 13 May 2013
Correspondence to: C. Meyer-Jacob (carsten.meyer-jacob@emg.umu.se)
CPD
9, 2489–2515, 2013Biogeochemical properties and diagenetic changes
during the past
C. Meyer-Jacob et al.
Title Page
Abstract Introduction
Conclusions References
Tables Figures
◭ ◮
◭ ◮
Back Close
Full Screen / Esc
Printer-friendly Version Interactive Discussion
Discussion
P
a
per
|
Dis
cussion
P
a
per
|
Discussion
P
a
per
|
Discussio
n
P
a
per
|
Abstract
A number of studies have shown that Fourier transform infrared spectroscopy (FTIRS) can be applied to quantitatively assess lacustrine sediment constituents. In this study, we developed calibration models based on FTIRS for the quantitative determination of biogenic silica (BSi; n=420; gradient: 0.9–56.5 %), total organic carbon (TOC; 5
n=309; gradient: 0.02–2.89 %), and total inorganic carbon (TIC; n=153; gradient: 0.01–1.46 %) in a 318 m long sediment record with a basal age of 3.6 Ma from Lake El’gygytgyn, Far East Russian Arctic. The developed partial least squares regression (PLSR) models yield high cross-validated (CV) RCV2 =0.85–0.91 and low root mean square error of cross-validation (RMSECV) (2.1–4.3 % of the gradient for the different 10
properties). The FTIRS-inferred concentrations of BSi, TOC, and TIC provide an initial insight into the climatic and environmental evolution at Lake El’gygytgyn throughout the late Pliocene and Quaternary showing a considerably high bioproductivity in the lake ecosystem between∼3.27–3.54 Ma during the early Pliocene warm period. Moreover,
we found that the recorded FTIR spectra contain information on sample burial depth as 15
a result of diagenetic changes (dehydration/dehydroxilation) of certain mineral phases. Despite the indicated post-depositional processes, the calibration models yield good statistical performances showing that general FTIRS models can be developed for sev-eral hundred meters long records extending sevsev-eral million years back in time. Our re-sults highlight FTIRS to be a rapid, cost-effective alternative to conventional methods 20
for quantification of biogeochemical properties.
1 Introduction
The understanding of past environmental changes is of particular importance to fa-cilitate the prediction of the magnitude and the regional implications of future en-vironmental changes, especially in view of an anthropogenic-forced global warming 25
CPD
9, 2489–2515, 2013Biogeochemical properties and diagenetic changes
during the past
C. Meyer-Jacob et al.
Title Page
Abstract Introduction
Conclusions References
Tables Figures
◭ ◮
◭ ◮
Back Close
Full Screen / Esc
Printer-friendly Version Interactive Discussion
Discussion
P
a
per
|
Dis
cussion
P
a
per
|
Discussion
P
a
per
|
Discussio
n
P
a
per
|
Records such as those from Lake Baikal (e.g. Williams et al., 1997), Lake Malawi (e.g. Scholz et al., 2006) and Lake Biwa (e.g. Fuji, 1988) extend several million years back in time and consist of several hundred meters of sediment. However, multiproxy anal-yses of such long records are very time-consuming and cost-intensive. Furthermore, high resolution sampling of these records can be restricted by the amount of sample 5
material available for the different analyses.
Fourier transform infrared spectroscopy (FTIRS) is a promising tool that copes with the above-mentioned problems due to its potential to analyse several compo-nents at once, simple sample pre-treatments, and the small sample size required for analysis (0.01 g). Because the excitation of polar bonds in molecules by IR-radiation 10
is wavenumber-specific depending on the structural and atomic composition of the molecules, it is possible to gather information about organic and minerogenic compo-nents from one single measurement. The technique has been applied to sediment to assess the concentration of silicate minerals (Sifeddine et al., 1994; Bertaux et al., 1996, 1998; Wirrmann et al., 2001), and carbonates (Mecozzi et al., 2001), as well as 15
to characterize humic substances (Braguglia et al., 1995; Belzile et al., 1997; Calace et al., 1999, 2006; Mecozzi and Pietrantonio, 2006).
FTIRS has also successfully been applied in paleolimnological studies to quantify biogeochemical properties (e.g. biogenic silica (BSi), total organic carbon (TOC), to-tal inorganic carbon (TIC), and toto-tal nitrogen (TN)) (Vogel et al., 2008; Ros ´en et al., 20
2010). The developed FTIRS models of these approaches were based on site-specific and regional calibrations, respectively. Further, Ros ´en et al. (2011) have shown that universally applicable models can be developed and be applied to globally distributed lakes with considerably different settings. However, in these studies reconstructions of selected properties by means of FTIRS have been conducted on sediment records of 25
CPD
9, 2489–2515, 2013Biogeochemical properties and diagenetic changes
during the past
C. Meyer-Jacob et al.
Title Page
Abstract Introduction
Conclusions References
Tables Figures
◭ ◮
◭ ◮
Back Close
Full Screen / Esc
Printer-friendly Version Interactive Discussion
Discussion
P
a
per
|
Dis
cussion
P
a
per
|
Discussion
P
a
per
|
Discussio
n
P
a
per
|
variations in sediment composition arising from climatic, environmental or diagenetic changes bias the robustness of IR calibrations.
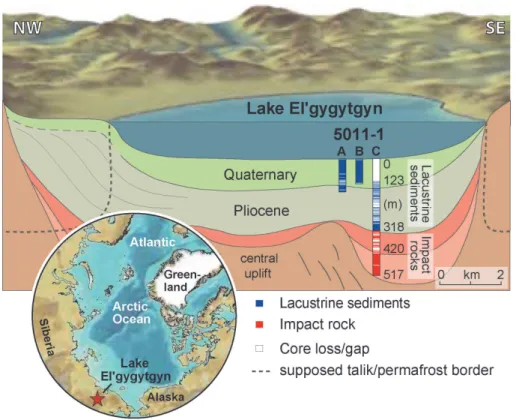
In this study, FTIRS is applied to a 318 m long sediment record from Lake El’gygytgyn, Far East Russian Arctic (67◦30′N, 172◦5′E) (Fig. 1), which was recov-ered during an ICDP (International Continental Scientific Drilling Program) funded deep 5
drilling campaign in 2009 (ICDP site 5011-1) (Melles et al., 2011). With its continu-ous formation and basal age of 3.6 Ma (Melles et al., 2012; Nowaczyk et al., 2012), the record of Lake El’gygytgyn for the first time provides high-resolution insights into the climatic and environmental evolution of the Arctic during the Quaternary and late Pliocene.
10
Within the framework of this study, we aim to test for the first time the applicability of IR based calibration models for BSi, TOC, and TIC using a sediment record extending several million years back in time. This test will shed light on the impact of potential diagenetically triggered changes in sediment composition on FTIR calibration models. Moreover, this study aims at providing initial insights into the climatic and environmental 15
evolution of the Arctic from the Pliocene to the present as recorded by bioproductivity indicators in the sediment record of Lake El’ gygytgyn.
2 Material and methods
2.1 Core recovery
Drilling operations were performed, from the lake ice cover, by Drilling, Observation and 20
Sampling of the Earth’s Continental Crust (DOSECC) Inc. using a GLAD-800 drilling system (Global Lake Drilling 800 m) in spring 2009. The lake sediments were sampled by three holes (A, B, and C) at ICDP site 5011-1, forming a core composite that pene-trates down to the underlying impact breccia at 318 m below lake floor (m b.l.f.) (Fig. 1). The sample site is situated in the deepest part of the lake.
CPD
9, 2489–2515, 2013Biogeochemical properties and diagenetic changes
during the past
C. Meyer-Jacob et al.
Title Page
Abstract Introduction
Conclusions References
Tables Figures
◭ ◮
◭ ◮
Back Close
Full Screen / Esc
Printer-friendly Version Interactive Discussion
Discussion
P
a
per
|
Dis
cussion
P
a
per
|
Discussion
P
a
per
|
Discussio
n
P
a
per
|
FTIRS measurements were performed on 380 samples covering the entire compos-ite profile of scompos-ite 5011-1. The samples were taken from core catchers (∼every 3 m) and core cuttings (∼every 1 m) of the drill cores. In addition, samples from
percus-sion piston cores PG1351 and Lz1024 were included in the calibrations. These 12.9 and 16.6 m long cores were recovered in 1998 and 2003, respectively (Juschus et al., 5
2005; Melles et al., 2007).
2.2 Analytical methods
Conventionally measured concentrations of biogeochemical properties (BSi, TOC, TIC) were used as reference data for the development of our calibration models. All sedi-ment samples were freeze-dried and ground to a particle size <63 µm using either 10
a swing mill (samples from ICDP site 5011-1) or a planetary mill (samples from PG1351 and Lz1024). TC and TIC in samples from site 5011-1 were determined by suspension method using a DIMATOC® 100 liquid analyser (Dimatec Corp.). TOC was then cal-culated by subtracting TIC from TC. The TOC content in samples from core PG1351 was analysed with a Metalyt-CS-1000-S (ELTRA Corp.) after sample pretreatment with 15
HCL (10 %) at a temperature of 80◦C to remove carbonate. Concentrations of BSi in all sediment cores were obtained by applying the wet chemical leaching method according to M ¨uller and Schneider (1993).
Accumulation rates (ARX) of BSi (ARBSi), TOC (ARTOC), and TIC (ARTIC) in g cm−2yr−1were calculated according to Eq. (1) (Bralower and Thierstein, 1987): 20
ARX =SR·(WBD−1.025·Φ)·%X (1)
where SR is the sedimentation rate in cm yr−1, WBD is the wet bulk density in g cm−3, Φis the porosity, and %X is the concentration of the property of interest. Sedimentation rates were determined according to the age model of Nowaczyk et al. (2012) and WBD 25
CPD
9, 2489–2515, 2013Biogeochemical properties and diagenetic changes
during the past
C. Meyer-Jacob et al.
Title Page
Abstract Introduction
Conclusions References
Tables Figures
◭ ◮
◭ ◮
Back Close
Full Screen / Esc
Printer-friendly Version Interactive Discussion
Discussion
P
a
per
|
Dis
cussion
P
a
per
|
Discussion
P
a
per
|
Discussio
n
P
a
per
|
averaged over 4 cm and sample levels affected by mass movements (Sauerbrey et al., 2013) were not considered in the reconstruction of accumulation rates.
Prior to the FTIR measurement, all samples were freeze-dried and ground to a parti-cle size<63 µm. 0.011±0.0001 g sample material was then mixed with 0.5±0.0005 g
of oven-dried spectroscopic grade potassium bromide (KBr) (Uvasol®, Merck Corp.), 5
which does not influence the FTIR spectrum due to its transparency in the IR region. Afterwards the mixture was homogenized using a mortar and pestle. The low sample concentration (2.2 %) was chosen to avoid spectral distortions by very high absorbance and optical effects (Herbert et al., 1992; Griffiths and de Haseth, 2007). To gain con-stant measuring conditions and avoid variability caused by variations of temperature, 10
the measurements were performed in a temperature controlled laboratory with a con-stant temperature of 25±0.2◦C. Samples were stored in the same room at least 5 h prior to the measurement. A Bruker IFS 66v/S FTIR spectrometer (Bruker Optics Inc.) equipped with a diffuse reflectance accessory (Harrick Inc.) was used for the analysis under vacuum (4 mbar). Each sample was scanned 64 times at a resolution of 4 cm−1 15
(reciprocal centimeters) for the wavenumber range from 3750 to 400 cm−1or from 2666 to 25 000 nm.
2.3 Numerical analyses
Baseline correction and multiplicative scatter correction (MSC) were applied to nor-malize the recorded FTIR spectra and to remove spectral variations caused by noise 20
(Geladi et al., 1985; Martens and Næs, 1989). We used partial least squares regression (PLSR) to develop calibration models between FTIR spectral information and the corre-sponding conventionally measured BSi, TOC, and TIC concentrations. Conventionally measured primary sediment properties were square root transformed prior to analysis. Both external and internal validations were applied to quantitatively estimate the com-25
CPD
9, 2489–2515, 2013Biogeochemical properties and diagenetic changes
during the past
C. Meyer-Jacob et al.
Title Page
Abstract Introduction
Conclusions References
Tables Figures
◭ ◮
◭ ◮
Back Close
Full Screen / Esc
Printer-friendly Version Interactive Discussion
Discussion
P
a
per
|
Dis
cussion
P
a
per
|
Discussion
P
a
per
|
Discussio
n
P
a
per
|
each model component. In this evaluation a calibration model based on 90 % of the available data was applied to the remaining 10 % to estimate its prediction ability. This procedure was then repeated a total of 10 times until the entire data set was predicted solely based on the corresponding spectral information. The resulting cross-validated coefficient of determination R2
cv and root mean square error of cross-validation (RM-5
SECV) were used to evaluate the internal model performance. The external validation was performed on 50 samples randomly chosen and equally distributed over the entire composite profile of ICDP site 5011-1. The coefficient of determination (R2) between conventionally measured and FTIR-inferred concentrations of biogeochemical proper-ties as well as the root mean square error of prediction (RMSEP) were considered 10
to estimate the prediction ability of the developed calibration applied to samples not included in the calibration set.
We performed the multivariate data analyses using SIMCA-P 11.5 (Umetrics AB, SE-907 19 Ume ˚a, Sweden). OPUS 5.5 (Bruker Optics Inc.) was used for the visualiza-tion of single FTIR spectra. For more informavisualiza-tion about the numerical analysis in this 15
approach, see Vogel et al. (2008) and Ros ´en et al. (2010).
3 Results and discussion
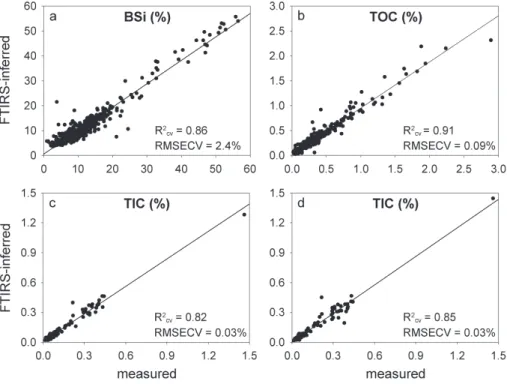
3.1 Statistical performance of FTIRS models
All three models, the 2-component FTIRS-BSi-model, the 8-component FTIRS-TOC-model, and the 8-component FTIRS-TIC-FTIRS-TOC-model, are based on the spectral range from 20
450 to 3750 cm−1 and show a strong correlation between FTIRS-inferred and conven-tionally measured concentrations (Rcv2 =0.86 for BSi; Rcv2 =0.91 for TOC; Rcv2 =0.82 for TIC) (Table 1). Corresponding RMSECV are low: 2.4 % for BSi (4.3 % of the gradi-ent), 0.09 % for TOC (3.1 % of the gradigradi-ent), and 0.03 % for TIC (2.1 % of the gradient). The external validation showed good statistical performance. TheR2 values are 0.94 25
CPD
9, 2489–2515, 2013Biogeochemical properties and diagenetic changes
during the past
C. Meyer-Jacob et al.
Title Page
Abstract Introduction
Conclusions References
Tables Figures
◭ ◮
◭ ◮
Back Close
Full Screen / Esc
Printer-friendly Version Interactive Discussion
Discussion
P
a
per
|
Dis
cussion
P
a
per
|
Discussion
P
a
per
|
Discussio
n
P
a
per
|
the gradient) and 0.13 % for TOC (7.9 % of the gradient), which indicate both a high prediction ability of the general trend and high prediction accuracies with respect to the absolute values of the proxy of interest.
In comparison with the BSi and TOC models, the TIC-model has a slightly poorer statistical performance (R2=0.82, RMSECV=0.05 % (13.2 % of the gradient)) (Fig. 2). 5
However, Ros ´en et al. (2010, 2011) have shown that a PLS model for TIC solely based on wavenumbers related to the C-O molecular vibrations of calcite (700–725, 860– 890, 1300–1560, 1780–1810, 2460–2640 cm−1) (Huang and Kerr, 1960; Mecozzi et al., 2001) can yield a high statistical performance as well. In this study, a 7-component TIC-model based on these selected wavenumbers shows an improved performance 10
with anRcv2 of 0.85, an RMSECV of 0.03 % (2.1 % of the gradient), and for the external validation set, anR2of 0.89 (Fig. 2) and an RMSEP of 0.03 % (7.9 % of the gradient). This indicates that the TIC model using selected wavenumbers has higher prediction ability of the general trend as well as of the absolute values.
3.2 Spectral information
15
Pronounced absorption bands in the loadings of the FTIRS models can be related to known absorption bands of organic and minerogenic compounds. For the BSi model the most important spectral regions positively correlated to the BSi concen-tration are situated between 790–860, 1060–1320 and 2750–3580 cm−1(Fig. 3). Pre-vious studies have shown that these regions can be attributed to absorptions caused 20
by molecular vibrations of biogenic silica. Absorptions at around 1100 cm−1 are as-signed to the stretching vibration mode of the [SiO4] tetrahedron, while the absorp-tion band at around 800 cm−1 is caused by inter-tetrahedral Si-O-Si bending vibra-tions (Moenke, 1974b; Gendron-Badou et al., 2003). A FTIR spectrum of purified BSi from Lake El’gygytgyn sediment shows two additional absorption bands at around 471 25
and 945 cm−1(Fig. 4), which are not pronounced in the loadings. The band at around 471 cm−1is associated with the bending vibration mode of the [SiO
CPD
9, 2489–2515, 2013Biogeochemical properties and diagenetic changes
during the past
C. Meyer-Jacob et al.
Title Page
Abstract Introduction
Conclusions References
Tables Figures
◭ ◮
◭ ◮
Back Close
Full Screen / Esc
Printer-friendly Version Interactive Discussion
Discussion
P
a
per
|
Dis
cussion
P
a
per
|
Discussion
P
a
per
|
Discussio
n
P
a
per
|
the band at around 945 cm−1 is related to Si-OH molecular vibrations (Rickert et al., 2002; Gendron-Badou et al., 2003). Instead, these spectral regions show a negative correlation to the BSi concentration due to fact that other silicates (e.g. feldspars, clay minerals) cause absorption in this part of the IR-spectrum as well (Farmer, 1974; Moenke, 1974b). This can result in an anti-correlation to the BSi content, because 5
measurements of concentrations of biogeochemical properties reflect the relative pro-portion of biogeochemical and minerogenic compounds. The positive loading values in the spectral regions between 2750 and 3580 cm−1can be linked to stretching vibrations of OH molecules (Moenke, 1974a), which are embedded in the molecular structure of BSi. The loadings of our BSi calibration model are consistent with the loading plots 10
previously reported by Vogel et al. (2008) and Ros ´en et al. (2010, 2011).
The most important absorption band in the loadings of the TOC model is situated between 1050 and 1275 cm−1 (Fig. 3). Absorption of IR radiation in this region can be linked to known absorption bands of organic compounds. For instance, absorp-tions between 1040 and 1070 cm−1 are ascribed to C-O stretching vibrations of car-15
bohydrates or polysaccharides (Calace et al., 1999; Chapman et al., 2001; Cocozza et al., 2003). Absorptions at around 1125 cm−1 are due to C-O-C stretching vibra-tions of complex carbohydrates, and absorption between 1230 and 1265 cm−1are at-tributed to C-O stretching vibrations of ethers or carboxyl groups (Cocozza et al., 2003; Mecozzi and Pietrantonio, 2006). However, the similarity of the loading plots of TOC 20
and BSi indicates an interdependency between both proxies. Sediment samples of Lake El’gygytgyn used for the calibration models are in general characterized by low TOC concentrations (mean: 0.41 %) and high BSi concentrations (mean: 12.1 %). It is likely that the positive loading values from 1050 to 1275 cm−1 are therefore attributed to Si-O molecular vibrations of BSi rather than to vibrations caused by organic matter. 25
CPD
9, 2489–2515, 2013Biogeochemical properties and diagenetic changes
during the past
C. Meyer-Jacob et al.
Title Page
Abstract Introduction
Conclusions References
Tables Figures
◭ ◮
◭ ◮
Back Close
Full Screen / Esc
Printer-friendly Version Interactive Discussion
Discussion
P
a
per
|
Dis
cussion
P
a
per
|
Discussion
P
a
per
|
Discussio
n
P
a
per
|
characteristic of organic matter, since an overlap with specific absorption bands of BSi can be excluded. The positive values between 2560 and 3575 cm−1 as well as at around 3700 cm−1 are related to absorptions caused by hydroxide groups, which are common in organic matter. However, because the influence of BSi on the calibration model for TOC is likely, it is difficult to determine how much of the absorption is caused 5
by hydroxide contained in organic matter (direct relationship) and how much of the absorption results from hydroxide groups associated with BSi (indirect relationship).
Distinctive positive absorption peaks in the loadings of the TIC calibration model at around 715, 875, 1795, 2515 cm−1 as well as the broad absorption band at around 1460 cm−1(Fig. 3) correspond well with known absorption bands caused by molecular 10
vibrations of carbonates (Huang and Kerr, 1960; Mecozzi et al., 2001). Furthermore, FTIRS model developments by Vogel et al. (2008) and Ros ´en et al. (2010, 2011) as well as FTIR spectra of carbonate-rich sediments (Ros ´en et al., 2010) have shown that these spectral regions are the most important for carbonates. The negative loading values between 1025 and 1270 cm−1as well as the negative values between 2630 and 15
3730 cm−1can partly be explained by an indirect relationship between the occurrence of TIC and BSi. The appearance of carbonates in the analysed samples is almost exclusively restricted to the lowermost part of the sediment record and accompanied by low BSi concentrations, which result in a negative correlation of spectral regions related to molecular vibrations of BSi to the TIC content.
20
3.3 Indications for diagenetic changes
A 9-component calibration model relating spectral information to the sample burial depth (n=329, 450–3750 cm−1) shows a significant correlation between the FTIR-inferred and measured depth (Rcv2 =0.85, RMSECV=29.3 m (9.4 % of the gradient), R2=0.85, and RMSEP=35.8 m (11.7 % of the gradient)) (Fig. 5a). This indicates 25
CPD
9, 2489–2515, 2013Biogeochemical properties and diagenetic changes
during the past
C. Meyer-Jacob et al.
Title Page
Abstract Introduction
Conclusions References
Tables Figures
◭ ◮
◭ ◮
Back Close
Full Screen / Esc
Printer-friendly Version Interactive Discussion
Discussion
P
a
per
|
Dis
cussion
P
a
per
|
Discussion
P
a
per
|
Discussio
n
P
a
per
|
developed for BSi, but has an inverse trend (Fig. 5c). This can be explained by the general trend of decreasing BSi concentrations with increasing depth within the sedi-ment record (Fig. 6). AnR2 of 0.45 highlights the moderate correlation between both parameters. However, this correlation explains only partly the possibility to determine the sample burial depth on the basis of spectral information, because different FTIRS-5
inferred burial depths result for samples of equal BSi content.
The spectral region between 2600 and 3750 cm−1 might be particularly relevant to explain the depth-related information in the FTIR spectra. Absorption in this region is mostly related to molecular vibrations of hydroxyl groups (Moenke, 1974a) contained in organic matter and several minerals such as clay minerals or biogenic silica. A 9-10
component calibration model (n=329) only based on this spectral region provides a statistical performance comparable to the model based on the entire spectral range. AnRcv2 of 0.84, an RMSECV of 29.9 m (9.6 % of the gradient), anR2of 0.91 (Fig. 5b), and an RMSEP of 28.7 m (9.4 % of the gradient) result from the internal and exter-nal validation, respectively. The negative correlation of this range indicates a dehydra-15
tion/dehydroxylation of certain sediment components with increasing burial depth. For instance, biogenic silica loses hydroxyl water due to condensation reactions during its maturation in the surface sediments (Schmidt et al., 2001; Rickert et al., 2002). This process is likely to proceed with increasing burial depth and might explain the influence of BSi on the loadings of our FTIRS-depth model. Further investigations are required 20
to determine from which components the depth-related information in the IR spectrum derive. Nevertheless, these findings indicate that IR spectroscopy might be a useful tool to estimate sediment maturation and provide information on diagenetic processes occurring along a sediment profile.
3.4 Variability of the biogeochemical properties throughout the last 3.6 Ma
25
CPD
9, 2489–2515, 2013Biogeochemical properties and diagenetic changes
during the past
C. Meyer-Jacob et al.
Title Page
Abstract Introduction
Conclusions References
Tables Figures
◭ ◮
◭ ◮
Back Close
Full Screen / Esc
Printer-friendly Version Interactive Discussion
Discussion
P
a
per
|
Dis
cussion
P
a
per
|
Discussion
P
a
per
|
Discussio
n
P
a
per
|
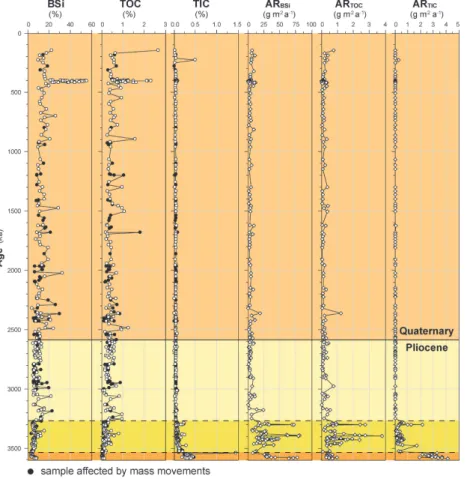
increasing trend from the bottom to the top of the sediment profile. The lowest con-centrations of BSi and TOC occur in sediments from the basal part of the record, which were deposited prior to 3.54 Ma and, somewhat less pronounced, between 3.54 and
∼3.27 Ma. Sediments of the marine isotope stage (MIS) 11 interglacial (∼400 ka)
con-tain the highest BSi concentrations, while the most recent of the analysed samples 5
(145 ka) shows the highest TOC concentration.
The inferred concentrations of TIC vary between 0 and 1.45 % (mean: 0.08 %) (Fig. 6). Samples deposited between ∼3.27–3.54 Ma contain low concentrations of
carbonate up to 0.3 %, whereas sediments formed within the first ∼50 kyr after the lake formation show the highest concentrations of TIC up to 1.5 %. Samples covering 10
the last∼3.27 Myr (mean: 0.05 %), in contrast, are supposed to be free of carbonate,
due to the RMSECV and RMSEP of 0.03 % and the limit of detection of approximately 0.05 % for the conventional method on which the calibration model for TIC is based. The only exception is one sample at around 223 ka, which has a TIC content of 0.50 %. Two different carbonate mineral phases, calcite and siderite, were determined in the 15
analysed samples from their wavenumber-specific IR absorbance. Calcite (Ca[CO3]) shows distinct absorption peaks at 712, 876, 1435, 1812, and 2545 cm−1, while siderite (Fe[CO3]) has specific peaks at 737, 866, 1422, and 1818 cm−1 (Huang and Kerr, 1960). Whilst calcite was determined in the basal sediments, siderite was detected in the∼223 ka old sample from the upper part of the sediment profile. The occurrence of
20
both mineral phases has been confirmed by XRD and thermomagnetic measurements, respectively. The occurrence of carbonate in the basal sediments might be connected to the origin of the lake depression created by a meteorite impact 3.58±0.04 Ma ago
(Layer, 2000). The impact may have induced hydrothermal activity, which is common after impact events where the melted/heated target material acting as heat source 25
CPD
9, 2489–2515, 2013Biogeochemical properties and diagenetic changes
during the past
C. Meyer-Jacob et al.
Title Page
Abstract Introduction
Conclusions References
Tables Figures
◭ ◮
◭ ◮
Back Close
Full Screen / Esc
Printer-friendly Version Interactive Discussion
Discussion
P
a
per
|
Dis
cussion
P
a
per
|
Discussion
P
a
per
|
Discussio
n
P
a
per
|
Because the sedimentation rate significantly changes during the past 3.6 Ma (Nowaczyk et al., 2012), accumulation rates were calculated to evaluate the carbonate accumulation and paleobioproductivity in Lake El’gygytgyn (Fig. 6). The accumulation rates of TIC (ARTIC) confirm the pattern already shown by the TIC concentrations, with high carbonate values at the core base, which more or less successively decrease to 5
zero by∼3.27 Ma, and a single occurrence in the sample at ∼223 ka. Accumulation rates of BSi (ARBSi) and TOC (ARTOC) show similar patterns in the lower part of the record (Fig. 6). The initial sedimentation during the first∼50 kyr is characterised by
high but rapidly decreasing ARBSifrom>60 to 7.3, while ARTOCfluctuate around a rel-atively low mean value of 0.5 g m−2yr−1. The high ARBSiat the base of the record does 10
not necessarily reflect a high primary production by diatoms, because sediments de-posited after the meteorite impact probably contain other amorphous silicates formed by the impact (e.g. ashes, glasses). IR absorbance caused by these components can have strong similarities to absorption bands of biogenic silica and therefore may lead to poor estimates by the BSi-FTIRS calibration model. Further, it can be assumed that bio-15
logical activity was strongly impaired during the initial sedimentation in the El’gygytgyn impact structure as a consequence of the meteorite impact. This is corroborated by the almost entire absence of microfossils in the first post-impact sediments (Brigham-Grette et al., 2013).
Notable algae productivity might have been initiated as late as about 3.54 Ma ago, 20
when both ARBSiand ARTOC increase to average rates of 30.0 and 1.0 g m−2yr−1, re-spectively, and remain high until ∼3.27 Ma (Fig. 6). However, both flux rates show
strong variations between 6.5–81.2 g m−2yr−1 for BSi and 0.1–3.8 g m−2yr−1 for TOC, suggesting substantial fluctuations in bioproduction during this period. The period 3.54 to ∼3.27 Ma coincides with the early Pliocene warm period (∼5–3 Ma), which was
25
characterized by∼2–3◦C higher global surface temperatures compared to today
CPD
9, 2489–2515, 2013Biogeochemical properties and diagenetic changes
during the past
C. Meyer-Jacob et al.
Title Page
Abstract Introduction
Conclusions References
Tables Figures
◭ ◮
◭ ◮
Back Close
Full Screen / Esc
Printer-friendly Version Interactive Discussion
Discussion
P
a
per
|
Dis
cussion
P
a
per
|
Discussion
P
a
per
|
Discussio
n
P
a
per
|
et al., 2011). The termination of the productivity maximum at Lake El’gygytgyn between 3.25–3.29 Ma is consistent with the onset of ice sheet expansion and cooling of coastal waters in Antarctica at about 3.3 Ma (McKay et al., 2012) and with decreasingpCO2 concentrations from 3.2 Ma on (Seki et al., 2010). Pollen-based temperature and pre-cipitation reconstructions from the El’gygytgyn sediment record suggest temperatures 5
of 7–8◦C and precipitation values of around 400 mm yr−1higher than today for the pe-riod between 3.6 and 3.4 Ma. Further, this pepe-riod is characterized by a significantly larger size of the dominant planktonic diatom (Pliocaenicussp.) compared to any other interval in the sediment record, indicating increased nutrient availability and reduced seasonal ice cover (Brigham-Grette et al., 2013).
10
During the late Pliocene and Quaternary –∼3.27 Ma to present – accumulation rates
of BSi and TOC are considerably lower. The decreased fluxes indicate a deterioration of environmental and climatic conditions in the Siberian Arctic impeding bioproductivity. Variations in the accumulation rates are comparatively small during the past 3.27 Myr and probably an effect of large scale glacial-interglacial climate change. During these 15
large scale cycles, bioproductivity at Lake El’gygytgyn is primarily controlled by the duration of lake ice cover. Warm periods are characterised by high aquatic primary production and a mixing of the entire water body due to the summer melt of the ice cover, while during cold periods the bioproductivity is limited due to the year-round ice cover causing a stratification of the water column with anoxic bottom waters (Melles 20
et al., 2007). However, the dataset does not reflect the entire glacial-interglacial pattern due to the low sample resolution.
4 Conclusions
The results of our study demonstrate that robust FTIRS calibration models can be developed for the quantitative assessment of biogeochemical properties in very long 25
CPD
9, 2489–2515, 2013Biogeochemical properties and diagenetic changes
during the past
C. Meyer-Jacob et al.
Title Page
Abstract Introduction
Conclusions References
Tables Figures
◭ ◮
◭ ◮
Back Close
Full Screen / Esc
Printer-friendly Version Interactive Discussion
Discussion
P
a
per
|
Dis
cussion
P
a
per
|
Discussion
P
a
per
|
Discussio
n
P
a
per
|
TOC, TIC and BSi for the 3.6 Ma old sediment record of Lake El’gygytgyn show a good statistical performance. Furthermore, our results suggest that FTIRS provides informa-tion about the sample burial depth and therefore about post-deposiinforma-tional changes in sediment composition. For the sediment record of Lake El’gygytgyn, our findings in-dicate a dehydration/dehydroxylation of certain mineral phases with increasing burial 5
depth/age. It remains uncertain which components are affected by these processes, but future analyses comparing IR information of single sediment components of different age might answer this question. The fact that robust FTIRS models can be developed despite the indicated diagenetic changes in the sediment column suggests that the technique is not limited to young, unconsolidated sediments. However, an internal cal-10
ibration might be needed to provide results of high accuracy for sediment succession affected by diagenesis.
Our study demonstrates that FTIRS is a fast and cost-effective analytical alternative to conventional methods for the quantitative estimation of biogeochemical properties like BSi, TOC, or TIC. Its successful application to a record extending several million 15
years back in time corroborates the potential of the technique for other lake deep drilling projects dealing with long sediment successions potentially affected by diagenetic pro-cesses.
Acknowledgement. The El’gygytgyn Drilling Project was funded by the International Continen-tal Scientific Drilling Program (ICDP), the US National Science Foundation (NSF), the German 20
Federal Ministry of Education and Research (BMBF), Alfred Wegener Institute (AWI) and Geo-ForschungsZentrum Potsdam (GFZ), the Russian Academy of Sciences Far East Branch (RAS FEB), the Russian Foundation of Basic Research (RFBR), and the Austrian Federal Ministry of Science and Research (BMWF). The Russian GLAD 800 drilling system was developed and operated by DOSECC Inc., and LacCore at the University of Minnesota handled core curation. 25
CPD
9, 2489–2515, 2013Biogeochemical properties and diagenetic changes
during the past
C. Meyer-Jacob et al.
Title Page
Abstract Introduction
Conclusions References
Tables Figures
◭ ◮
◭ ◮
Back Close
Full Screen / Esc
Printer-friendly Version Interactive Discussion
Discussion
P
a
per
|
Dis
cussion
P
a
per
|
Discussion
P
a
per
|
Discussio
n
P
a
per
|
References
Belzile, N., Joly, H. A., and Li, H.: Characterization of humic substances extracted from Cana-dian lake sediments, Can. J. Chem., 75, 14–27, 1997.
Bertaux, J., Ledru, M. P., Soubi `es, F., and Sondag, F.: The use of quantitative mineralogy linked to palynological studies in paleoenvironmental reconstruction: the case study of the “Lagoa 5
Campestre” lake, salitre, Minas Gerais, Brazil, C. R. Acad. Sci. Paris, 323, 65–71, 1996. Bertaux, J., Fr ¨ohlich, F., and Ildefonse, P.: Multicomponent analysis of FTIR spectra:
quantifi-cation of amorphous and crystallized mineral phases in synthetic and natural sediments, J. Sediment. Res., 68, 440–447, 1998.
Braguglia, C. M., Campanella, L., Petronio, B. M., and Scerbo, R.: Sedimentary humic acids in 10
the continental margin of the Ross Sea (Antarctica), Int. J. Environ. Anal. Chem., 60, 61–70, 1995.
Bralower, T. J. and Thierstein, H. R.: Organic carbon and metal accumulation rates in Holocene and mid-Cretaceous sediments: palaeoceanographic significance, in: Marine Petroleum Source Rocks, edited by: Brooks, J. and Fleet, A. J., London, Geol. Soc. Sp., 26, 345–369, 15
1987.
Brierley, C. M., Fedorov, A. V., Liu, Z., Herbert, T. D., Lawrence, K. T., and LaRiviere, J. P.: Greatly expanded tropical warm pool and weakened Hadley circulation in the early Pliocene, Science, 323, 1714–1718, 2009.
Brigham-Grette, J., Melles, M., Minyuk, P., Andreev, A., Tarasov, P., DeConto, R., Koenig, 20
S., Nowaczyk, N., Wennrich, V., Ros ´en, P., Haltia-Hovi, E., Cook, T., Gebhardt, C., Meyer-Jacob, C., Snyder, J., and Herzschuh, U.: Pliocene Warmth, Polar Amplification, and Stepped Pleistocene Cooling recorded in NE Arctic Russia, Science, online first, doi:10.1126/science.1233137, 2013.
Calace, N., Capolei, M., Lucchese, M., and Petronio, B. M.: The structural composition of humic 25
compounds as indicator of organic carbon sources, Talanta, 49, 277–284, 1999.
Calace, N., Cardellicchio, N., Petronio, B. M., Pietrantonio, M., and Pietroletti, M.: Sedimentary humic substances in the Northern Adriatic Sea (Mediterranean Sea), Mar. Environ. Res., 61, 40–58, 2006.
Chapligin, B., Meyer, H., Bryan, A., Snyder, J., and Kemnitz, H.: Assessment of purification 30
CPD
9, 2489–2515, 2013Biogeochemical properties and diagenetic changes
during the past
C. Meyer-Jacob et al.
Title Page
Abstract Introduction
Conclusions References
Tables Figures
◭ ◮
◭ ◮
Back Close
Full Screen / Esc
Printer-friendly Version Interactive Discussion
Discussion
P
a
per
|
Dis
cussion
P
a
per
|
Discussion
P
a
per
|
Discussio
n
P
a
per
|
Chapman, S. J., Campbell, C. D., Fraser, A. R., and Puri, G.: FTIR spectroscopy of peat in and bordering Scots pine woodland: relationship with chemical and biological properties, Soil Biol. Biochem., 33, 1193–1200, 2001.
Cocozza, C., D’Orazio, V., Miano, T. M., and Shotyk, W.: Characterization of solid and aqueous phases of a peat bog profile using molecular fluorescence spectroscopy, ESR and FT-IR, 5
and comparison with physical properties, Org. Geochem., 34, 49–60, 2003.
Farmer, V. C.: The layer silicates, in: The Infrared Spectra of Minerals, edited by: Farmer, V. C., Mineralogical Society Monograph 4, Adlard & Son, Dorking, Surrey, 331–363, 1974.
Fuji, N.: Palaeovegetation and palaeoclimate changes around Lake Biwa, Japan during the last ca. 3 million years, Quaternary Sci. Rev., 7, 21–28, 1988.
10
Gebhardt, A. C., Francke, A., K ¨uck, J., Sauerbrey, M., Niessen, F., Wennrich, V., and Melles, M.: Petrophysical characterization of the lacustrine sediment succession drilled in Lake El’gygytgyn, Far East Russian Arctic, Clim. Past Discuss., 9, 351–391, doi:10.5194/cpd-9-351-2013, 2013.
Geladi, P., MacDougall, D., and Martens, H.: Linearization and scatter-correction for near-15
infrared reflectance spectra of meat, Appl. Spectrosc., 39, 491–500, 1985.
Gendron-Badou, A., Coradin, T., Maquet, J., Fr ¨ohlich, F., and Livage, J.: Spectroscopic charac-terization of biogenic silica, J. Non-Cryst. Solids, 316, 331–337, 2003.
Griffiths, P. R. and de Haseth, J. A.: Fourier Transform Infrared Spectroscopy, Wiley, New York,
2007. 20
Haywood, A. M. and Vales, P. J.: Modelling Pliocene warmth: contribution of atmosphere, oceans and cryosphere, Earth Planet. Sc. Lett., 218, 363–377, 2004.
Herbert, T. D., Brian, A. D., and Burnett, C.: Precise major component determination in deep-sea sediments using Fourier transform infrared spectroscopy, Geochim. Cosmochim. Ac., 56, 1759–1763, 1992.
25
Hill, D. J., Dolan, A. M., Haywood, A. M., Hunter, S. J., and Stoll, D. K.: Sensitivity of the Greenland Ice Sheet to Pliocene sea surface temperatures, Stratigraphy, 7, 111–121, 2010. Huang, C. K. and Kerr, P. F.: Infrared study of the carbonate minerals, Am. Mineral., 45, 311–
324, 1960.
IPCC: Climate change 2007: The physical science basis, in: Contribution of Working Group I 30
CPD
9, 2489–2515, 2013Biogeochemical properties and diagenetic changes
during the past
C. Meyer-Jacob et al.
Title Page
Abstract Introduction
Conclusions References
Tables Figures
◭ ◮
◭ ◮
Back Close
Full Screen / Esc
Printer-friendly Version Interactive Discussion
Discussion
P
a
per
|
Dis
cussion
P
a
per
|
Discussion
P
a
per
|
Discussio
n
P
a
per
|
Juschus, O., Wennrich, V., Quart, S., Minyuk, P., Melles, M., Gebhardt, C. and Niessen, F.: New long record Lz1024, in: The expedition El’gygytgyn lake 2003 (Siberian Arctic), edited by: Melles, M., Minyuk, P., Brigham-Grette, J., and Juschus, O., Reports on Polar and Marine Research, 509, 110–113, 2005.
McKay, R., Naish, T., Carter, L., Riesselman, C., Dunbar, R., Sjunneskog, C., Winter, D., San-5
giorgi, F., Warren, C., Pagani, M., Schouten, S., Willmott, V., Levy, R., DeConto, R., and Powell, R. D.: Antarctic and Southern Ocean influences on Late Pliocene global cooling, P. Natl. Acad. Sci. USA, 109, 6423–6428, 2012.
Layer, P. W.: Argon-40/argon-39 age of the El’gygytgyn impact event, Chukotk, Russia, Mete-orit. Planet. Sci., 35, 591–599, 2000.
10
Martens, H. and Næs, T.: Multivariate Calibration, John Wiley & Sons, Chichester, New York, Brisbane, Toronto, Singapore, 1989.
Mecozzi, M. and Pietrantonio, E.: Carbohydrates proteins and lipids in fulvic and humic acids of sediments and its relationships with mucilanginous aggregates in the Italian seas, Mar. Chem., 101, 27–39, 2006.
15
Mecozzi, M., Pietrantonio, E., Amici, M., and Romanelli, G.: Determination of carbonate in marine solid samples by FTIR-ATR spectroscopy, Analyst, 126, 144–146, 2001.
Melles, M., Brigham-Grette, J., Glushkova, O. Y., Minyuk, P. S., Nowacyk, N. R., and Hub-berten, H.-W.: Sedimentary geochemistry of core PG1351 from Lake El’gygytgyn – a sen-sitive record of climate variability in the East Siberian Arctic during the past three glacial-20
interglacial cycles, J. Paleolimnol., 37, 89–104, 2007.
Melles, M., Brigham-Grette, J., Minyuk, P., Koeberl, C., Andreev, A., Cook, T., Federov, G., Gebhardt, C., Haltia-Hovi, E., Kukkonen, M., Nowaczyk, N., Schwamborn, G., Wennrich, V., and the El’gygytgyn Scientific Party: the El’gygytgyn Scientific Drilling Project – conquering Arctic challenges through continental drilling, Sci. Drill., 11, 29–40, 2011.
25
Melles, M., Brigham-Grette, J., Minyuk, P. S., Nowaczyk, N. R., Wennrich, V., DeConto, R. M., Anderson, A., Andreev, A. A., Coletti, A., Cook, T. L., Haltia-Hovi, E., Kukkonen, M., Lozhkin, A. V., Ros ´en, P., Tarasov, P., Vogel, H., and Wagner, B.: 2.8 million years of Arc-tic climate change from Lake El’gygytgyn, NE Russia, Science, 337, 315–320, 2012. Moenke, H. H. W.: Vibrational spectra and the crystal-chemical classification of minerals, in: 30
CPD
9, 2489–2515, 2013Biogeochemical properties and diagenetic changes
during the past
C. Meyer-Jacob et al.
Title Page
Abstract Introduction
Conclusions References
Tables Figures
◭ ◮
◭ ◮
Back Close
Full Screen / Esc
Printer-friendly Version Interactive Discussion
Discussion
P
a
per
|
Dis
cussion
P
a
per
|
Discussion
P
a
per
|
Discussio
n
P
a
per
|
Moenke, H. H. W.: Silica, the three-dimensional silicates, borosilicates and beryllium silicates, in: The Infrared Spectra of Minerals, edited by: Farmer, V. C., Mineralogical Society Mono-graph 4, Adlard & Son, Dorking, Surrey, 365–382, 1974b.
M ¨uller, P. J. and Schneider, J.: An automated leaching method for the determination of opal in sediments and particulate matter, Deep-Sea Res., 40, 424–444, 1993.
5
Naumov, M. V.: Impact-generated hydrothermal systems: data from Popigai, Kara, and Puchezh-Katunki impact structures, in: Impacts in Precambrian Shields, edited by: Plado, J. and Pesonen, L. J., Springer-Verlag, Berlin, 117–171, 2002.
Nowaczyk, N. R., Haltia-Hovi, E. M., Ulbricht, D., Wennrich, V., Kukkonen, M., Ros ´en, P., Vogel, H., Meyer-Jacob, C., Andreev, A., Lozhkin, A. V., and El’gygytgyn Scientific Party: 10
Chronology of Lake El’gygytgyn sediments, Clim. Past Discuss., in preparation, 2012. Osinski, G. R., Lee, P., Parnell, J., Spray, J. G., and Baron, M.: A case study of impact-induced
hydrothermal activity: the Haughton impact structure, Devon Island, Canadian High Arctic, Meteorit. Planet. Sci., 40, 1859–1877, 2005.
Pagani, M., Liu, Z., LaRiviere, J., and Ravelo, A. C.: High earth-system climate sensitivity de-15
termined from Pliocene carbon dioxide concentrations, Nat. Geosci., 3, 27–30, 2010. Raymo, M. E., Mitrovica, J. X., O’Leary, M. J., DeConto, R. M., and Hearty, P. J.: Departures
from eustasy in Pliocene sea-level records, Nat. Geosci., 4, 328–332, 2011.
Rickert, D., Schl ¨uter, M., and Wallmann, K.: Dissolution kinetics of biogenic silica from the water column to the sediments, Geochim. Cosmochim. Ac., 66, 439–455, 2002.
20
Ros ´en, P., Vogel, H., Cunningham, L., Reuss, N., Conley, D. J., and Persson, P.: Fourier trans-form infrared spectroscopy, a new method for rapid determination of total organic and in-organic and biogenic silica concentration in lake sediments, J. Paleolimnol., 43, 247–259, 2010.
Ros ´en, P., Vogel, H., Cunningham, L., Hahn, A., Hausmann, S., Pienitz, R., Zolitschka, B., 25
Wagner, B., and Persson, P.: Universally applicable model for the quantitative determination of lake sediment composition using Fourier transform infrared spectroscopy, Environ. Sci. Technol., 45, 8858–8865, 2011.
Sauerbrey, M. A., Juschus, O., Gebhardt, A. C., Wennrich, V., Nowaczyk, N. R., and Melles, M.: Mass movement deposits in the 3.6 Ma sediment record of Lake El’gygytgyn, Far East 30
CPD
9, 2489–2515, 2013Biogeochemical properties and diagenetic changes
during the past
C. Meyer-Jacob et al.
Title Page
Abstract Introduction
Conclusions References
Tables Figures
◭ ◮
◭ ◮
Back Close
Full Screen / Esc
Printer-friendly Version Interactive Discussion
Discussion
P
a
per
|
Dis
cussion
P
a
per
|
Discussion
P
a
per
|
Discussio
n
P
a
per
|
Schmidt, M., Botz, R., Rickert, D., Bohrmann, G., Hall, S. R., and Mann, S.: Oxygen isotope of marine diatoms and relations to opal – a maturation, Geochim. Cosmochim. Ac., 65, 201– 211, 2001.
Scholz, C. A., Cohen, A. S., Johnson, T. C., King, J. W., and Moran, K.: The 2005 Lake Malawi drilling project, Sci. Drill., 2, 17–19, 2006.
5
Seki, O., Foster, G. L., Schmidt, D. N., Mackensen, A., Kawamura, K., and Pancost, R. D.: Alkenone and boron-based PliocenepCO2 records, Earth Planet. Sc. Lett., 292, 201–211,
2010.
Sifeddine, A., Fr ¨ohlich, F., Fournier, M., Martin, L., Servant, M., Soubi `es, F., Turcq, B., Sug-uio, K., and Volkmer-Ribeiro, C.: La sedimentation lacustre indicateur de changements des 10
pal ´eoenvironnements au cours des 30 000 derni `eres ann ´ees (Carajasm Amazonie, Br ´esil), C. R. Acad. Sci. Paris, 318, 1645–1652, 1994.
Vogel, H., Ros ´en, P., Wagner, B., Melles, M., and Persson, P.: Fourier transform infrared spec-troscopy, a new cost-effective tool for qualitative analysis of biogeochemical properties in
long sediment records, J. Paleolimnol., 40, 689–702, 2008. 15
Williams, D. F., Peck, J., Karabanov, E. B., Prokopenko, A. A., Kravchinsky, V., King, J., and Kuzmin, M. I.: Lake Baikal record of continental climate response to orbital insolation during the past 5 million years, Science, 278, 1114–1117, 1997.
Wirrmann, D., Bertaux, J., and Kossoni, A.: Late Holocene paleoclimatic changes in Western Central Africa inferred from mineral abundance in dated sediments from Lake Ossa (South-20
CPD
9, 2489–2515, 2013Biogeochemical properties and diagenetic changes
during the past
C. Meyer-Jacob et al.
Title Page
Abstract Introduction
Conclusions References
Tables Figures
◭ ◮
◭ ◮
Back Close
Full Screen / Esc
Printer-friendly Version Interactive Discussion
Discussion
P
a
per
|
Dis
cussion
P
a
per
|
Discussion
P
a
per
|
Discussio
n
P
a
per
|
Table 1. Statistical performance of developed calibration models using wavenumbers from 450–3750 cm−1
(all WN) and selected wavenumbers (selected WN) for biogenic silica (BSi), total organic carbon (TOC), and total inorganic carbon (TIC) based on sediments from Lake El’gygytgyn.
Statistics BSi (%) TOC (%) TIC (%)
all WN all WN all WN selected WN
Calibr
ation
set
PLS components 2 8 8 7
Samples (n) 420 309 153 153
Min 0.9 0.02 0.01 0.01
Max 56.5 2.89 1.46 1.46
Gradient 55.6 2.87 1.45 1.45
Mean 12.1 0.41 0.12 0.12
Included 450–3750 450–3750 450–3750 700–725; 860–890;
wavenumbers 1300–1560; 1780–
(cm−1
) 1810; 2460–2640
Inter
nal
validation
R2cv 0.86 0.91 0.82 0.85
RMSECV 2.4 0.09 0.03 0.03
RMSECV 4.3 3.1 2.1 2.1
(% gradient)
Exter
nal
validation
set
Min 1.2 0.04 0.02
Max 36.9 1.68 0.40
Gradient 35.7 1.64 0.38
Mean 10.1 0.37 0.09
Exter
nal
validation
R2 0.94 0.83 0.82 0.89
RMSEP 2.1 0.13 0.05 0.03
RMSEP 7.0 7.9 13.2 7.9
CPD
9, 2489–2515, 2013Biogeochemical properties and diagenetic changes
during the past
C. Meyer-Jacob et al.
Title Page
Abstract Introduction
Conclusions References
Tables Figures
◭ ◮
◭ ◮
Back Close
Full Screen / Esc
Printer-friendly Version Interactive Discussion
Discussion
P
a
per
|
Dis
cussion
P
a
per
|
Discussion
P
a
per
|
Discussio
n
P
a
per
|
Fig. 2.Conventionally measured (x-axis) versus FTIRS-inferred concentrations (y-axis) of bio-genic silica (BSi), total organic carbon (TOC), and total inorganic carbon (TIC) with the cross-validated coefficient of determination (Rcv2) and root mean square error of cross-validation (RM-SECV) resulting from the internal validation of the developed calibration models.(a)FTIRS-BSi calibration model using wavenumbers from 450 to 3750 cm−1
,(b)FTIRS-TOC calibration model using wavenumbers from 450–3750 cm−1
,(c)FTIRS-TIC calibration model including wavenum-bers from to 450–3750 cm−1, and(d) FTIRS-TIC calibration model based on wavenumbers
of known absorption bands of calcite (700–725, 860–890, 1300–1560, 1780–1810, 2460– 2640 cm−1
CPD
9, 2489–2515, 2013Biogeochemical properties and diagenetic changes
during the past
C. Meyer-Jacob et al.
Title Page
Abstract Introduction
Conclusions References
Tables Figures
◭ ◮
◭ ◮
Back Close
Full Screen / Esc
Printer-friendly Version Interactive Discussion
Discussion
P
a
per
|
Dis
cussion
P
a
per
|
Discussion
P
a
per
|
Discussio
n
P
a
per
|
Fig. 4.FTIR spectrum of biogenic silica (BSi) from a sediment sample of Lake El’gygytgyn puri-fied according to Chapligin et al. (2012) showing distinct absorption bands at around 1100 cm−1
(Si-O stretching vibration), 945 cm−1
(Si-OH stretching vibration), 800 cm−1
CPD
9, 2489–2515, 2013Biogeochemical properties and diagenetic changes
during the past
C. Meyer-Jacob et al.
Title Page
Abstract Introduction
Conclusions References
Tables Figures
◭ ◮
◭ ◮
Back Close
Full Screen / Esc
Printer-friendly Version Interactive Discussion
Discussion
P
a
per
|
Dis
cussion
P
a
per
|
Discussion
P
a
per
|
Discussio
n
P
a
per
|
Fig. 5. (a,b)Conventionally measured (x-axis) versus FTIRS-inferred burial depth (y-axis) with the cross-validated coefficient of determination (Rcv2) and root mean square error of cross-validation (RMSECV) resulting from the internal cross-validation of the developed models (included wavenumbers: (a) 450–3750 cm−1
and (b) 2600–3750 cm−1
CPD
9, 2489–2515, 2013Biogeochemical properties and diagenetic changes
during the past
C. Meyer-Jacob et al.
Title Page
Abstract Introduction
Conclusions References
Tables Figures
◭ ◮
◭ ◮
Back Close
Full Screen / Esc
Printer-friendly Version Interactive Discussion
Discussion
P
a
per
|
Dis
cussion
P
a
per
|
Discussion
P
a
per
|
Discussio
n
P
a
per
|